Summary
This experiment investigates parallel i/o tuning. Fractional factorial design to optimize parallel file I/O throughput on a Lustre filesystem.
The design varies 5 factors: stripe count, ranging from 4 to 32, stripe size (MB), ranging from 1 to 16, aggregators, ranging from 4 to 64, collective io, ranging from on to off, and alignment (MB), ranging from 1 to 4. The goal is to optimize 2 responses: write bw (GB/s) (maximize) and read bw (GB/s) (maximize). Fixed conditions held constant across all runs include filesystem = lustre, file size gb = 100.
A fractional factorial design reduces the number of runs from 32 to 8 by deliberately confounding higher-order interactions. This is ideal for screening — identifying which of the 5 factors matter most before investing in a full study.
Key Findings
For write bw, the most influential factors were collective io (33.7%), stripe size (24.4%), alignment (16.2%). The best observed value was 21.49 (at stripe count = 32, stripe size = 16, aggregators = 4).
For read bw, the most influential factors were aggregators (24.5%), stripe size (21.9%), alignment (20.3%). The best observed value was 25.83 (at stripe count = 4, stripe size = 1, aggregators = 64).
Recommended Next Steps
- Follow up with a response surface design (CCD or Box-Behnken) on the top 3–4 factors to model curvature and find the true optimum.
- Consider whether any fixed factors should be varied in a future study.
- The screening results can guide factor reduction — drop factors contributing less than 5% and re-run with a smaller, more focused design.
Experimental Setup
Factors
| Factor | Levels | Type | Unit |
|---|
stripe_count | 4, 32 | continuous | |
stripe_size | 1, 16 | continuous | MB |
aggregators | 4, 64 | continuous | |
collective_io | on, off | categorical | |
alignment | 1, 4 | continuous | MB |
Fixed: filesystem=lustre, file_size_gb=100
Responses
| Response | Direction | Unit |
|---|
write_bw | ↑ maximize | GB/s |
read_bw | ↑ maximize | GB/s |
Experimental Matrix
The Fractional Factorial Design produces 8 runs. Each row is one experiment with specific factor settings.
| Run | stripe_count | stripe_size | aggregators | collective_io | alignment |
|---|
| 1 | 4 | 16 | 64 | on | 1 |
| 2 | 32 | 1 | 4 | on | 1 |
| 3 | 32 | 16 | 4 | off | 1 |
| 4 | 32 | 16 | 64 | off | 4 |
| 5 | 4 | 16 | 4 | on | 4 |
| 6 | 32 | 1 | 64 | on | 4 |
| 7 | 4 | 1 | 4 | off | 4 |
| 8 | 4 | 1 | 64 | off | 1 |
How to Run
$ doe info --config use_cases/09_parallel_io_tuning/config.json
$ doe generate --config use_cases/09_parallel_io_tuning/config.json --output results/run.sh --seed 42
$ bash results/run.sh
$ doe analyze --config use_cases/09_parallel_io_tuning/config.json
$ doe optimize --config use_cases/09_parallel_io_tuning/config.json
$ doe report --config use_cases/09_parallel_io_tuning/config.json --output report.html
Analysis Results
Generated from actual experiment runs.
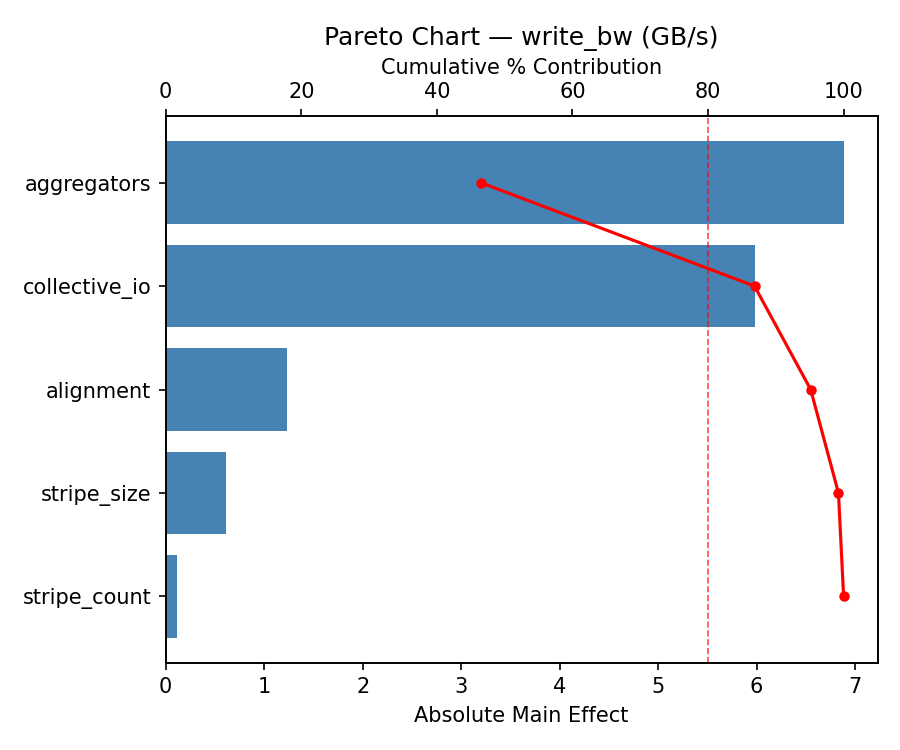
Response: write_bw
Pareto Chart
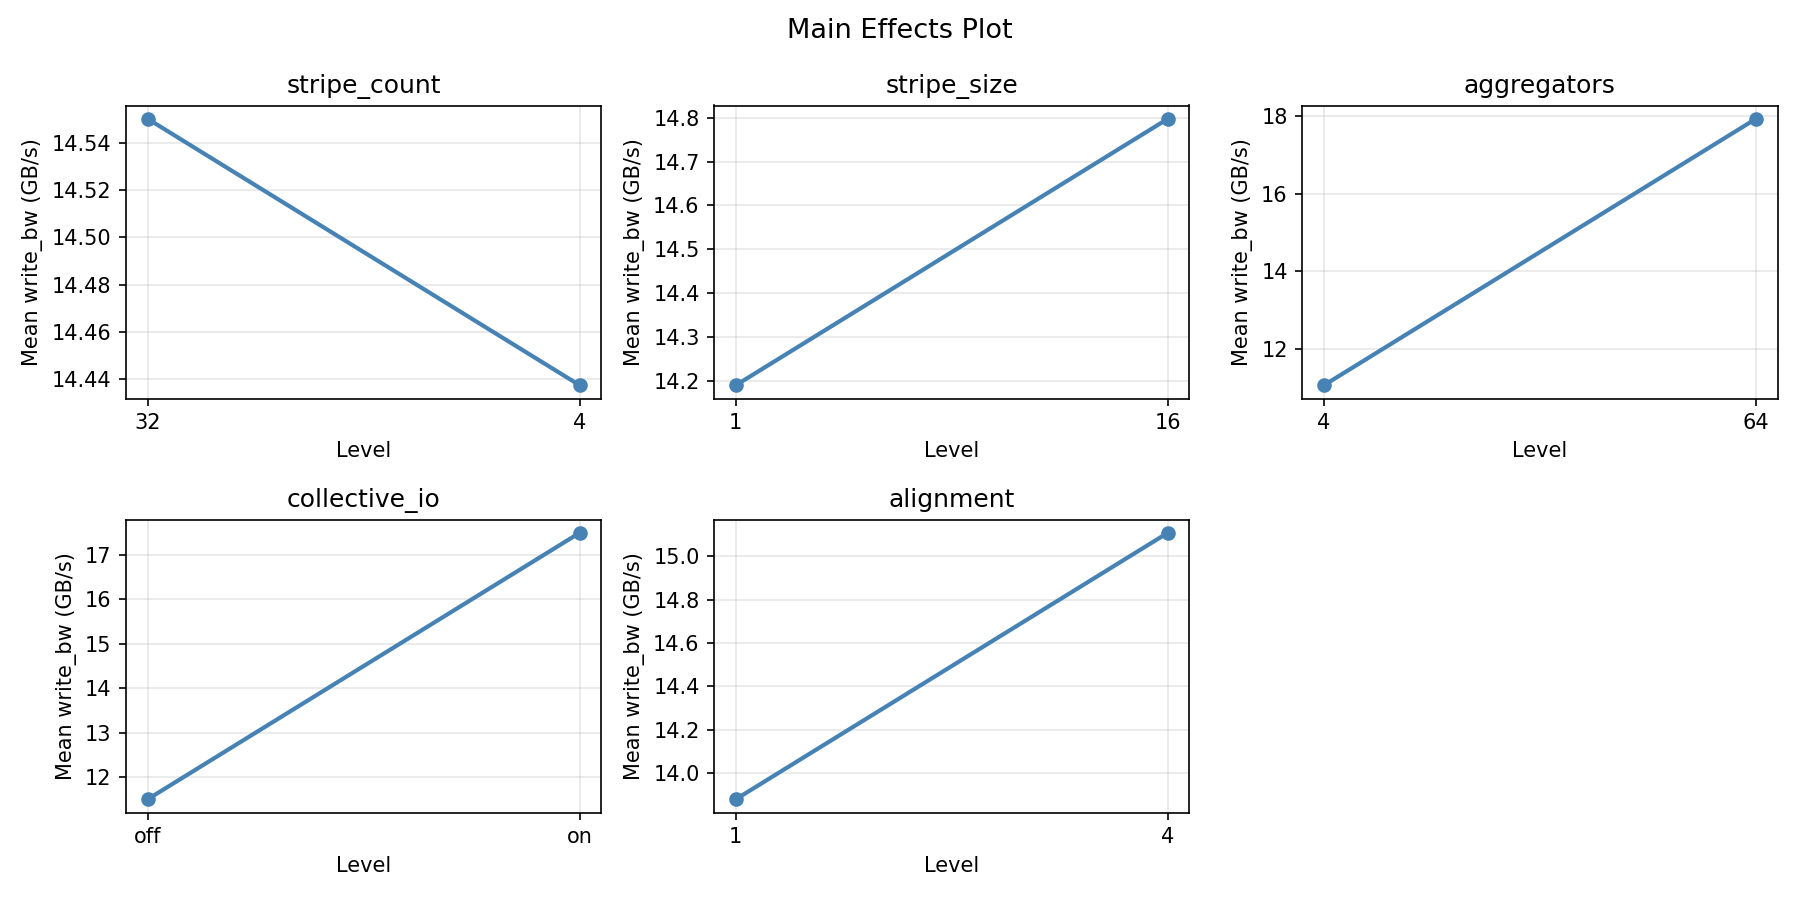
Main Effects Plot
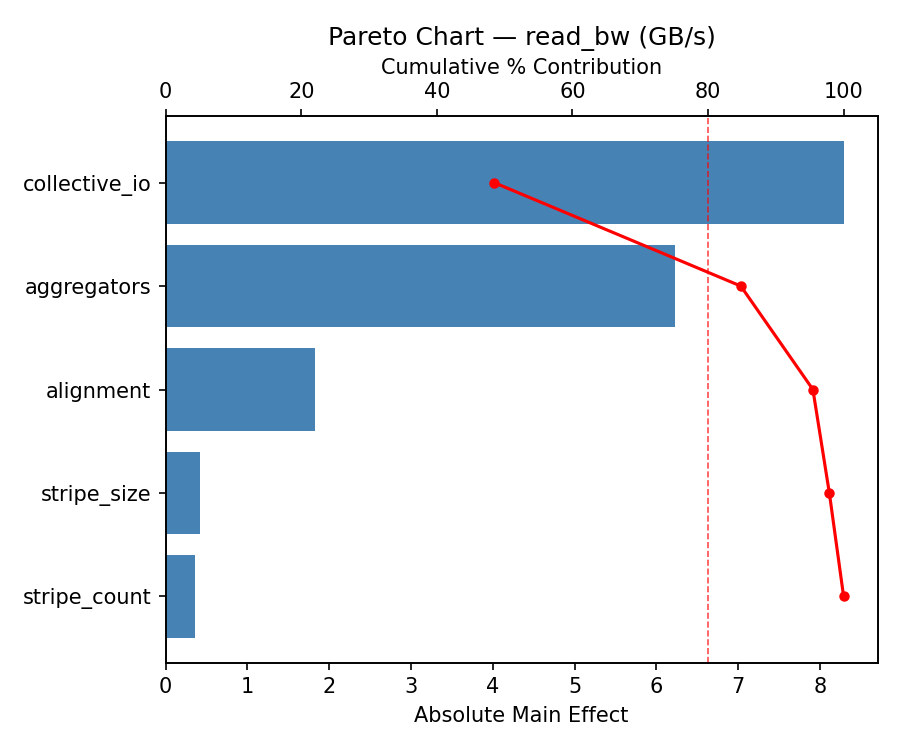
Response: read_bw
Pareto Chart
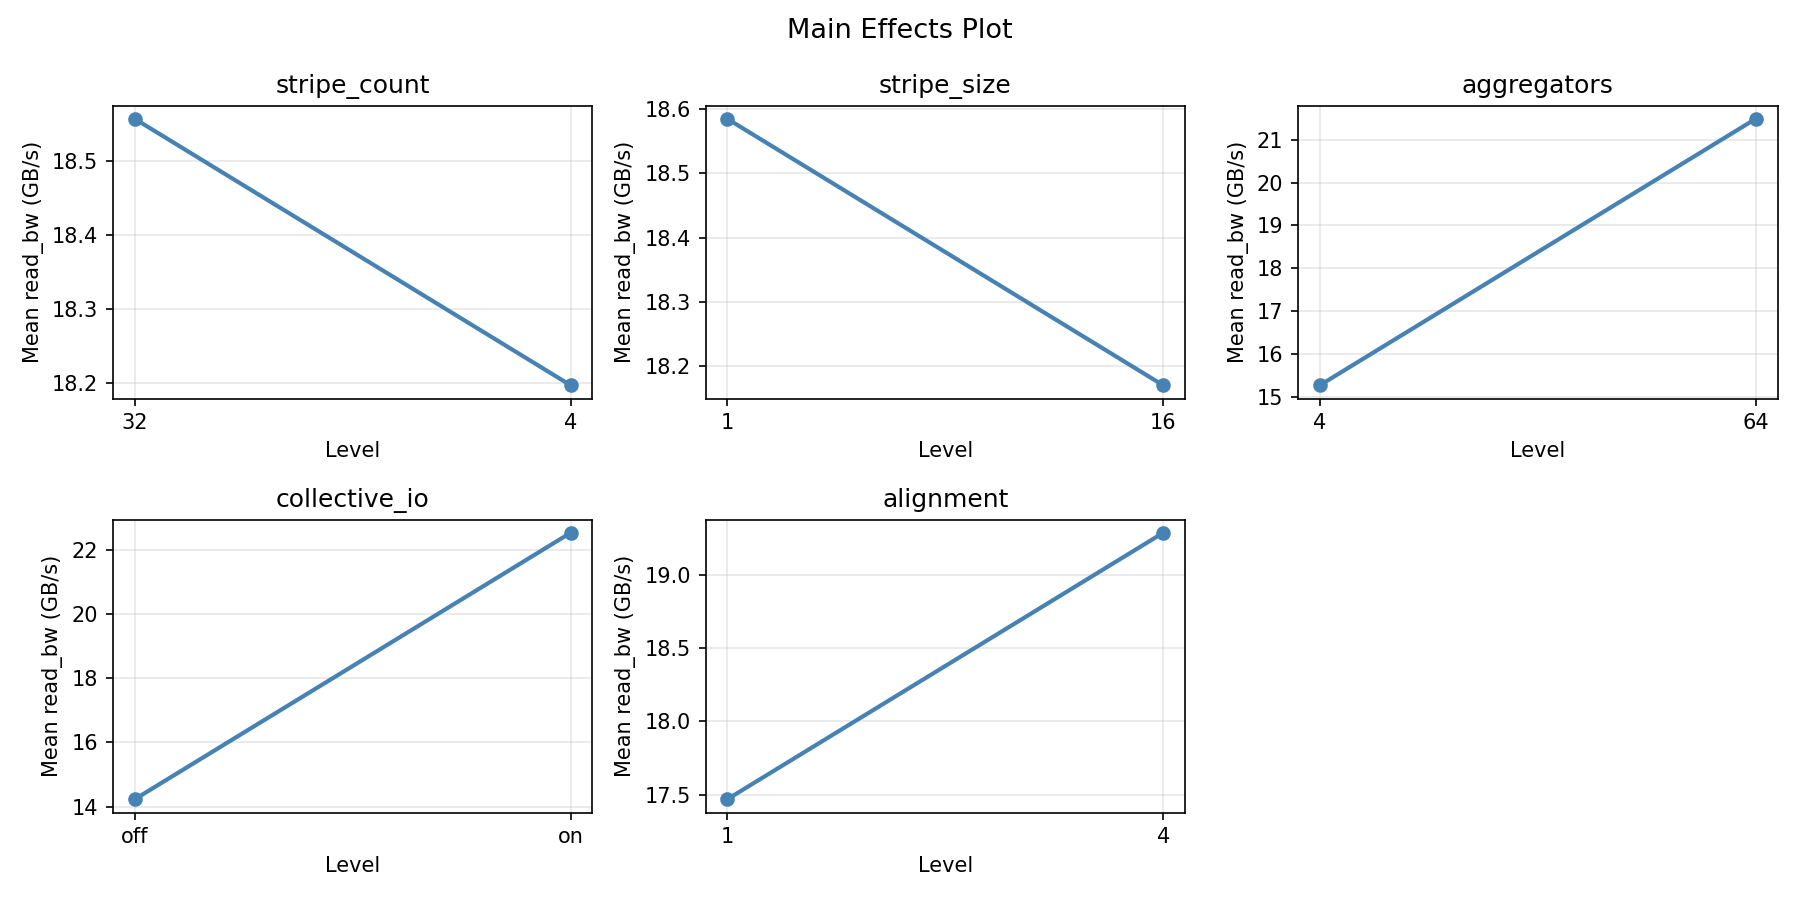
Main Effects Plot
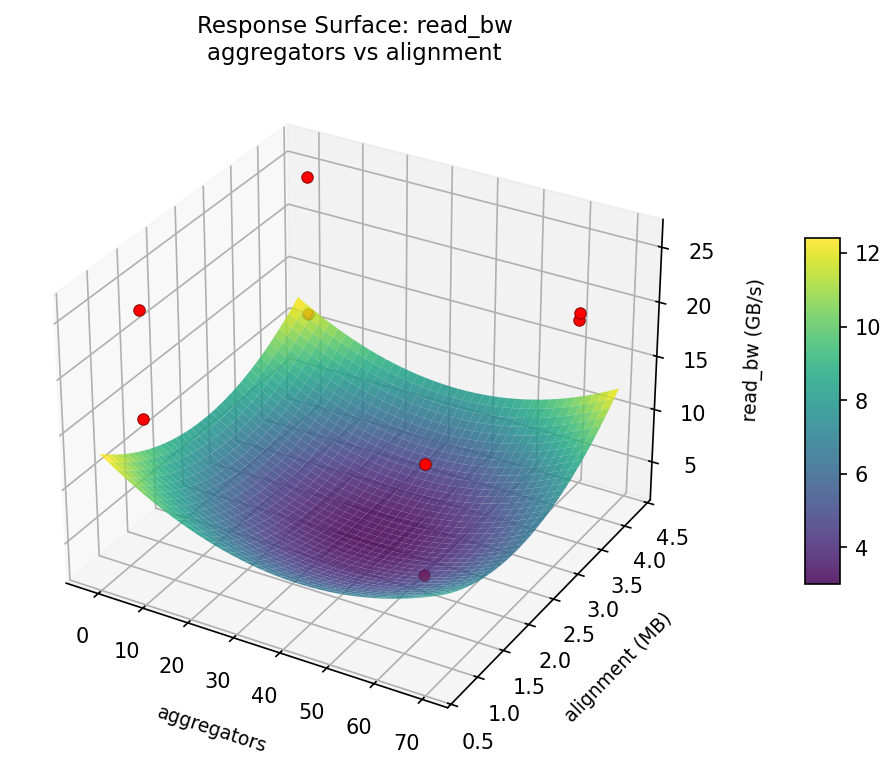
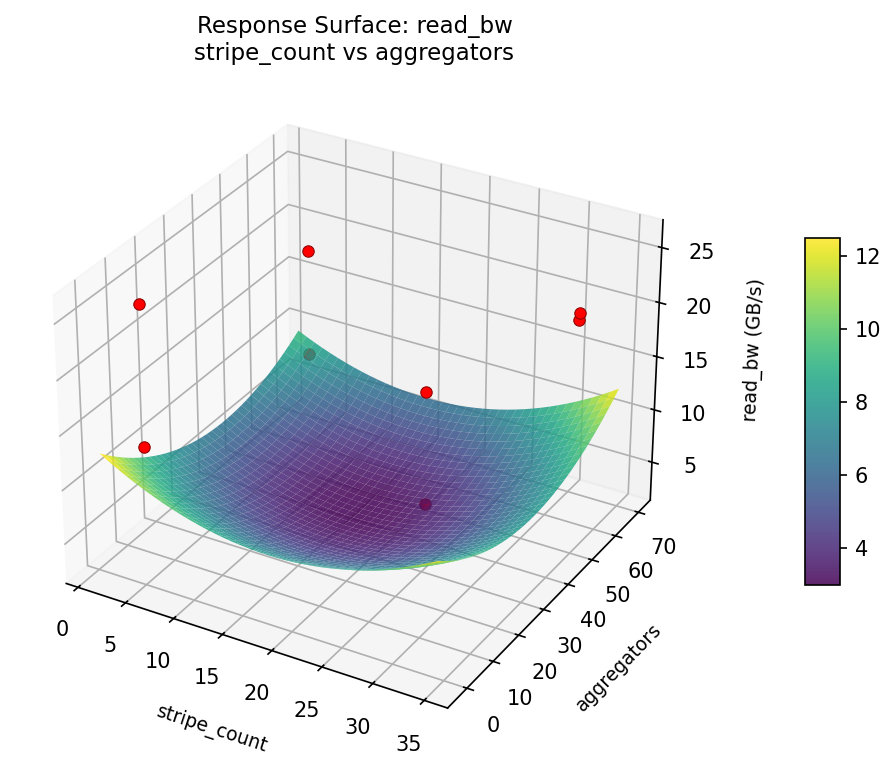
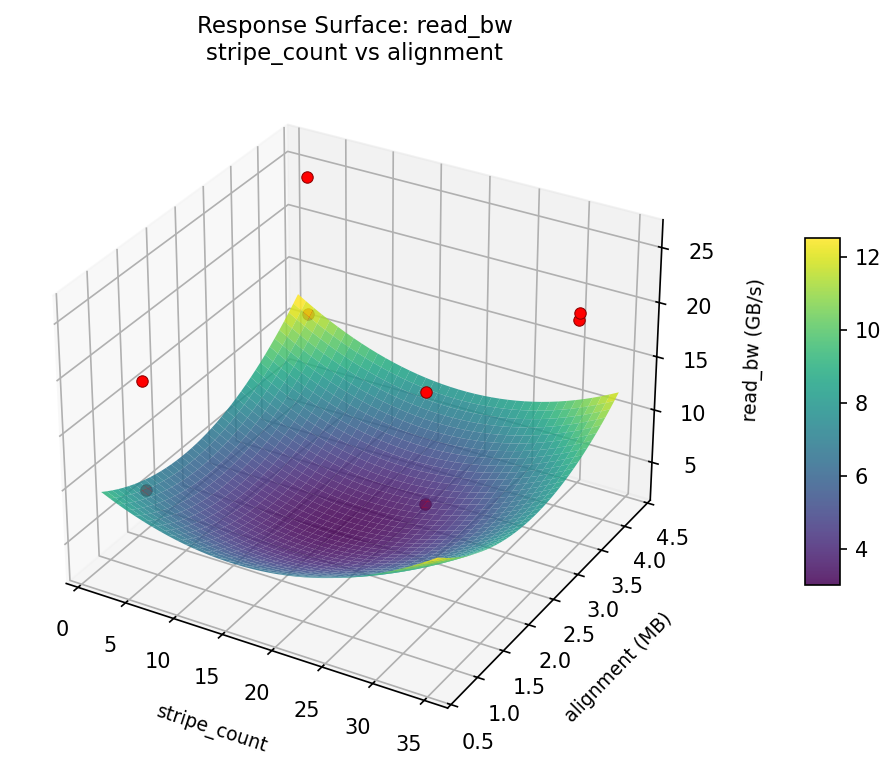
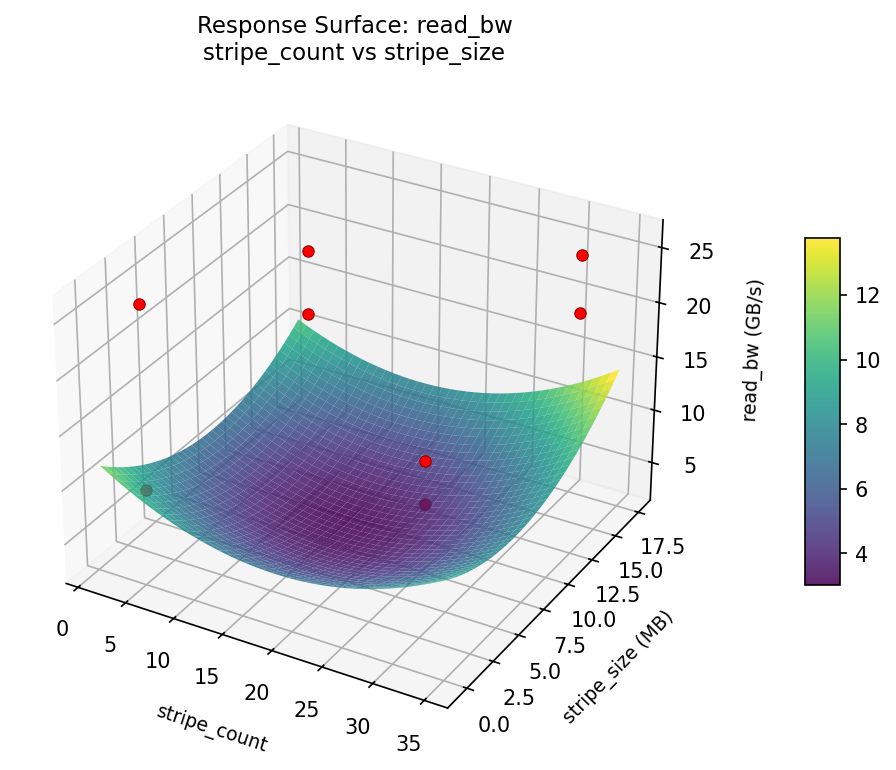
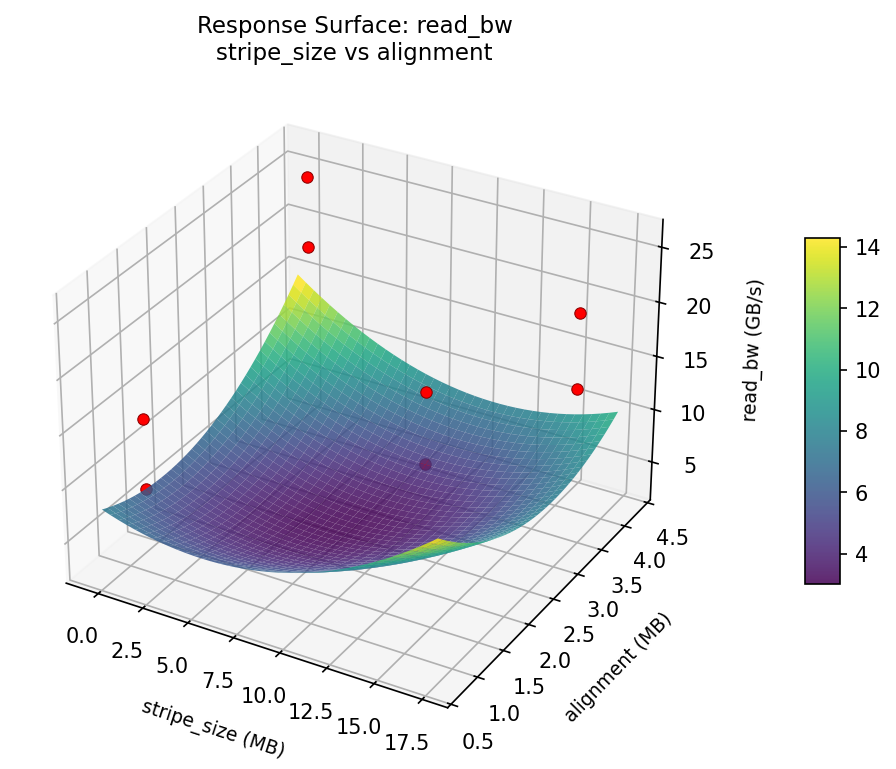
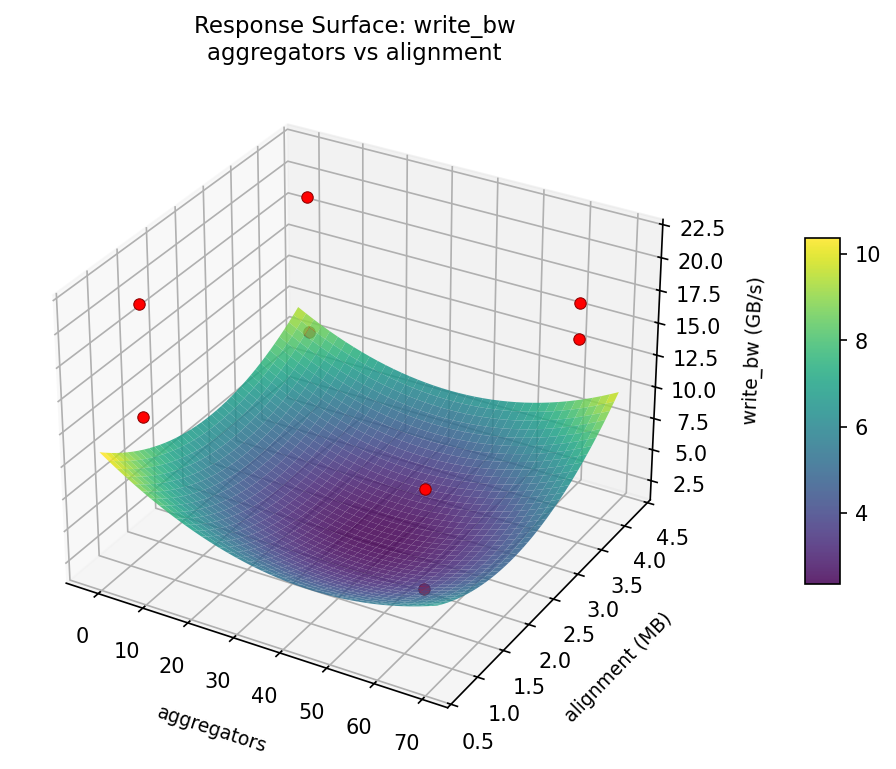
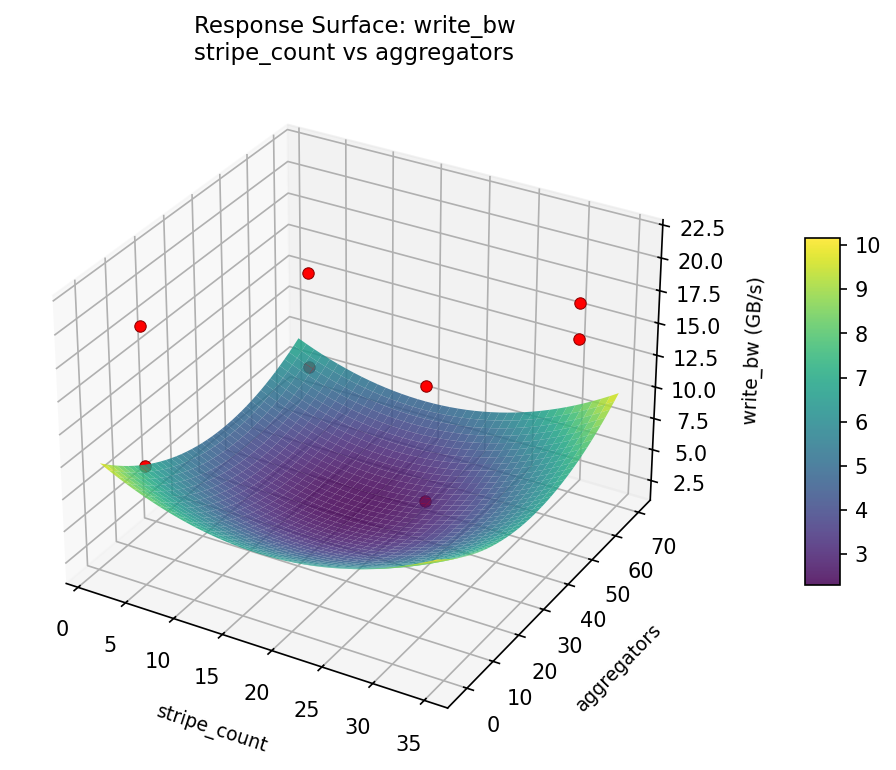
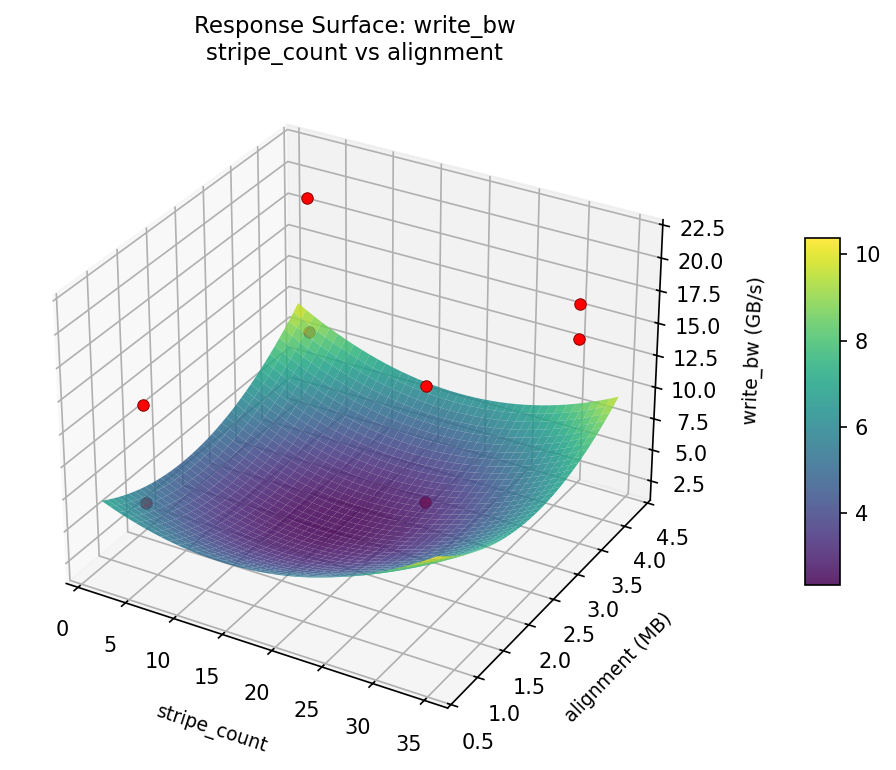
Response Surface Plots
3D surfaces fitted with quadratic RSM. Red dots are observed data points.
📊
How to Read These Surfaces
Each plot shows predicted response (vertical axis) across two factors while other factors are held at center. Red dots are actual experimental observations.
- Flat surface — these two factors have little effect on the response.
- Tilted plane — strong linear effect; moving along one axis consistently changes the response.
- Curved/domed surface — quadratic curvature; there is an optimum somewhere in the middle.
- Saddle shape — significant interaction; the best setting of one factor depends on the other.
- Red dots far from surface — poor model fit in that region; be cautious about predictions there.
write_bw (GB/s) — R² = 1.000, Adj R² = 1.000
The model fits well — the surface shape is reliable.
Curvature detected in stripe_count, stripe_size — look for a peak or valley in the surface.
Strongest linear driver: collective_io (decreases write_bw).
Notable interaction: stripe_count × stripe_size — the effect of one depends on the level of the other. Look for a twisted surface.
read_bw (GB/s) — R² = 1.000, Adj R² = 1.000
The model fits well — the surface shape is reliable.
Curvature detected in stripe_count, stripe_size — look for a peak or valley in the surface.
Strongest linear driver: collective_io (decreases read_bw).
Notable interaction: stripe_count × stripe_size — the effect of one depends on the level of the other. Look for a twisted surface.
read: bw aggregators vs alignment
read: bw stripe count vs aggregators
read: bw stripe count vs alignment
read: bw stripe count vs stripe size
read: bw stripe size vs aggregators

read: bw stripe size vs alignment
write: bw aggregators vs alignment
write: bw stripe count vs aggregators
write: bw stripe count vs alignment
write: bw stripe count vs stripe size
write: bw stripe size vs aggregators
write: bw stripe size vs alignment
Full Analysis Output
=== Main Effects: write_bw ===
Factor Effect Std Error % Contribution
--------------------------------------------------------------
stripe_count -7.3525 1.8006 49.5%
collective_io 3.6175 1.8006 24.3%
alignment -1.5575 1.8006 10.5%
stripe_size -1.4225 1.8006 9.6%
aggregators -0.9125 1.8006 6.1%
=== Interaction Effects: write_bw ===
Factor A Factor B Interaction % Contribution
------------------------------------------------------------------------
stripe_size collective_io -7.3525 21.5%
aggregators alignment 7.3525 21.5%
stripe_count stripe_size 3.6175 10.6%
stripe_size aggregators -3.4325 10.0%
collective_io alignment 3.4325 10.0%
stripe_size alignment 2.5625 7.5%
aggregators collective_io -2.5625 7.5%
stripe_count aggregators 1.5575 4.6%
stripe_count collective_io -1.4225 4.2%
stripe_count alignment 0.9125 2.7%
=== Summary Statistics: write_bw ===
stripe_count:
Level N Mean Std Min Max
------------------------------------------------------------
32 4 18.1700 3.2792 13.9800 21.4900
4 4 10.8175 3.7047 6.4000 14.5900
stripe_size:
Level N Mean Std Min Max
------------------------------------------------------------
1 4 15.2050 6.9202 6.4000 21.4900
16 4 13.7825 3.3585 9.2400 17.3200
aggregators:
Level N Mean Std Min Max
------------------------------------------------------------
4 4 14.9500 6.3671 6.4000 21.4900
64 4 14.0375 4.4070 9.2400 19.8900
collective_io:
Level N Mean Std Min Max
------------------------------------------------------------
off 4 12.6850 4.5748 6.4000 17.3200
on 4 16.3025 5.5555 9.2400 21.4900
alignment:
Level N Mean Std Min Max
------------------------------------------------------------
1 4 15.2725 5.2986 9.2400 21.4900
4 4 13.7150 5.5520 6.4000 19.8900
=== Main Effects: read_bw ===
Factor Effect Std Error % Contribution
--------------------------------------------------------------
stripe_count -7.9600 2.0289 54.4%
collective_io 5.2850 2.0289 36.1%
stripe_size -1.1000 2.0289 7.5%
alignment 0.1950 2.0289 1.3%
aggregators -0.0800 2.0289 0.5%
=== Interaction Effects: read_bw ===
Factor A Factor B Interaction % Contribution
------------------------------------------------------------------------
stripe_size collective_io -7.9600 22.1%
aggregators alignment 7.9600 22.1%
stripe_count stripe_size 5.2850 14.7%
stripe_size aggregators -3.5850 10.0%
collective_io alignment 3.5850 10.0%
stripe_size alignment 3.1400 8.7%
aggregators collective_io -3.1400 8.7%
stripe_count collective_io -1.1000 3.1%
stripe_count aggregators -0.1950 0.5%
stripe_count alignment 0.0800 0.2%
=== Summary Statistics: read_bw ===
stripe_count:
Level N Mean Std Min Max
------------------------------------------------------------
32 4 22.3575 3.6959 19.0000 25.8300
4 4 14.3975 4.5759 9.0800 19.9900
stripe_size:
Level N Mean Std Min Max
------------------------------------------------------------
1 4 18.9275 8.0909 9.0800 25.8300
16 4 17.8275 3.2512 12.9900 19.9900
aggregators:
Level N Mean Std Min Max
------------------------------------------------------------
4 4 18.4175 6.7688 9.0800 25.2700
64 4 18.3375 5.5694 12.9900 25.8300
collective_io:
Level N Mean Std Min Max
------------------------------------------------------------
off 4 15.7350 4.7580 9.0800 19.3300
on 4 21.0200 5.9649 12.9900 25.8300
alignment:
Level N Mean Std Min Max
------------------------------------------------------------
1 4 18.2800 5.3388 12.9900 25.2700
4 4 18.4750 6.9506 9.0800 25.8300
Optimization Recommendations
=== Optimization: write_bw ===
Direction: maximize
Best observed run: #6
stripe_count = 4
stripe_size = 16
aggregators = 64
collective_io = on
alignment = 1
Value: 21.49
RSM Model (linear, R² = 0.48):
Coefficients:
intercept: +14.4937
stripe_count: -2.9937
stripe_size: -0.6137
aggregators: +0.3037
collective_io: +1.1663
alignment: +0.0563
Predicted optimum:
stripe_count = 4
stripe_size = 16
aggregators = 64
collective_io = on
alignment = 1
Predicted value: 18.2875
Factor importance:
1. stripe_count (effect: 6.0, contribution: 58.3%)
2. collective_io (effect: 2.3, contribution: 22.7%)
3. stripe_size (effect: -1.2, contribution: 12.0%)
4. aggregators (effect: 0.6, contribution: 5.9%)
5. alignment (effect: 0.1, contribution: 1.1%)
=== Optimization: read_bw ===
Direction: maximize
Best observed run: #4
stripe_count = 4
stripe_size = 1
aggregators = 4
collective_io = off
alignment = 4
Value: 25.83
RSM Model (linear, R² = 0.66):
Coefficients:
intercept: +18.3775
stripe_count: -4.1450
stripe_size: -0.9100
aggregators: -0.2075
collective_io: +1.0175
alignment: +0.1800
Predicted optimum:
stripe_count = 4
stripe_size = 16
aggregators = 4
collective_io = on
alignment = 4
Predicted value: 23.0175
Factor importance:
1. stripe_count (effect: 8.3, contribution: 64.2%)
2. collective_io (effect: 2.0, contribution: 15.8%)
3. stripe_size (effect: -1.8, contribution: 14.1%)
4. aggregators (effect: -0.4, contribution: 3.2%)
5. alignment (effect: 0.4, contribution: 2.8%)
Multi-Objective Optimization
When responses compete, Derringer–Suich desirability finds the best compromise.
Each response is scaled to a 0–1 desirability, then combined via a weighted geometric mean.
Overall Desirability
D = 1.0000
Per-Response Desirability
| Response | Weight | Desirability | Predicted | Dir |
|---|
write_bw |
1.5 |
|
22.67 1.0000 22.67 GB/s |
↑ |
read_bw |
1.5 |
|
27.70 1.0000 27.70 GB/s |
↑ |
Recommended Settings
| Factor | Value |
|---|
stripe_count | 4.036 |
stripe_size | 15.87 MB |
aggregators | 47.69 |
collective_io | off |
alignment | 1.394 MB |
Source: from RSM model prediction
Trade-off Summary
Sacrifice = how much worse than single-objective best.
| Response | Predicted | Best Observed | Sacrifice |
|---|
read_bw | 27.70 | 25.83 | -1.87 |
Top 3 Runs by Desirability
| Run | D | Factor Settings |
|---|
| #4 | 0.9051 | stripe_count=4, stripe_size=1, aggregators=64, collective_io=off, alignment=1 |
| #1 | 0.6506 | stripe_count=4, stripe_size=16, aggregators=4, collective_io=on, alignment=4 |
Model Quality
| Response | R² | Type |
|---|
read_bw | 0.9998 | linear |
Full Multi-Objective Output
============================================================
MULTI-OBJECTIVE OPTIMIZATION
Method: Derringer-Suich Desirability Function
============================================================
Overall desirability: D = 1.0000
Response Weight Desirability Predicted Direction
---------------------------------------------------------------------
write_bw 1.5 1.0000 22.67 GB/s ↑
read_bw 1.5 1.0000 27.70 GB/s ↑
Recommended settings:
stripe_count = 4.036
stripe_size = 15.87 MB
aggregators = 47.69
collective_io = off
alignment = 1.394 MB
(from RSM model prediction)
Trade-off summary:
write_bw: 22.67 (best observed: 21.49, sacrifice: -1.18)
read_bw: 27.70 (best observed: 25.83, sacrifice: -1.87)
Model quality:
write_bw: R² = 0.9933 (linear)
read_bw: R² = 0.9998 (linear)
Top 3 observed runs by overall desirability:
1. Run #6 (D=0.9392): stripe_count=4, stripe_size=16, aggregators=64, collective_io=on, alignment=1
2. Run #4 (D=0.9051): stripe_count=4, stripe_size=1, aggregators=64, collective_io=off, alignment=1
3. Run #1 (D=0.6506): stripe_count=4, stripe_size=16, aggregators=4, collective_io=on, alignment=4