Summary
This experiment investigates study session optimization. Full factorial of study block length, break duration, technique, and environment noise level for retention and attention span.
The design varies 4 factors: block min (min), ranging from 15 to 50, break min (min), ranging from 3 to 15, active recall pct (%), ranging from 0 to 100, and noise db (dB), ranging from 25 to 65. The goal is to optimize 2 responses: retention pct (%) (maximize) and attention score (pts) (maximize). Fixed conditions held constant across all runs include subject = biology, total hours = 3.
A full factorial design was used to explore all 16 possible combinations of the 4 factors at two levels. This guarantees that every main effect and interaction can be estimated independently, at the cost of a larger experiment (16 runs).
Quadratic response surface models were fitted to capture potential curvature and factor interactions. The RSM contour plots below visualize how pairs of factors jointly affect each response.
Key Findings
For retention pct, the most influential factors were noise db (43.1%), break min (36.9%), block min (16.9%). The best observed value was 74.0 (at block min = 15, break min = 3, active recall pct = 100).
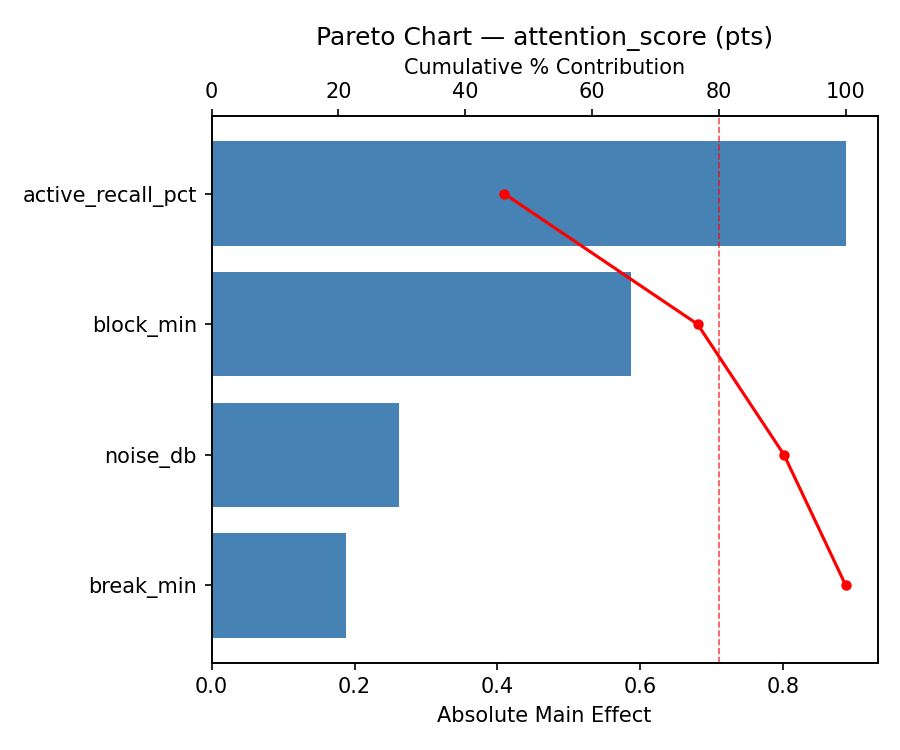
For attention score, the most influential factors were active recall pct (42.0%), block min (29.3%), break min (28.2%). The best observed value was 9.1 (at block min = 50, break min = 3, active recall pct = 0).
Recommended Next Steps
- Consider whether any fixed factors should be varied in a future study.
Experimental Setup
Factors
| Factor | Low | High | Unit |
|---|
block_min | 15 | 50 | min |
break_min | 3 | 15 | min |
active_recall_pct | 0 | 100 | % |
noise_db | 25 | 65 | dB |
Fixed: subject = biology, total_hours = 3
Responses
| Response | Direction | Unit |
|---|
retention_pct | ↑ maximize | % |
attention_score | ↑ maximize | pts |
Configuration
{
"metadata": {
"name": "Study Session Optimization",
"description": "Full factorial of study block length, break duration, technique, and environment noise level for retention and attention span"
},
"factors": [
{
"name": "block_min",
"levels": [
"15",
"50"
],
"type": "continuous",
"unit": "min"
},
{
"name": "break_min",
"levels": [
"3",
"15"
],
"type": "continuous",
"unit": "min"
},
{
"name": "active_recall_pct",
"levels": [
"0",
"100"
],
"type": "continuous",
"unit": "%"
},
{
"name": "noise_db",
"levels": [
"25",
"65"
],
"type": "continuous",
"unit": "dB"
}
],
"fixed_factors": {
"subject": "biology",
"total_hours": "3"
},
"responses": [
{
"name": "retention_pct",
"optimize": "maximize",
"unit": "%"
},
{
"name": "attention_score",
"optimize": "maximize",
"unit": "pts"
}
],
"settings": {
"operation": "full_factorial",
"test_script": "use_cases/113_study_habit/sim.sh"
}
}
Experimental Matrix
The Full Factorial Design produces 16 runs. Each row is one experiment with specific factor settings.
| Run | block_min | break_min | active_recall_pct | noise_db |
|---|
| 1 | 15 | 15 | 100 | 65 |
| 2 | 50 | 3 | 0 | 65 |
| 3 | 15 | 15 | 0 | 65 |
| 4 | 15 | 15 | 100 | 25 |
| 5 | 50 | 15 | 100 | 25 |
| 6 | 50 | 3 | 100 | 25 |
| 7 | 50 | 15 | 0 | 25 |
| 8 | 50 | 3 | 0 | 25 |
| 9 | 15 | 3 | 0 | 65 |
| 10 | 15 | 3 | 100 | 25 |
| 11 | 50 | 15 | 0 | 65 |
| 12 | 50 | 15 | 100 | 65 |
| 13 | 15 | 15 | 0 | 25 |
| 14 | 50 | 3 | 100 | 65 |
| 15 | 15 | 3 | 0 | 25 |
| 16 | 15 | 3 | 100 | 65 |
Step-by-Step Workflow
1
Preview the design
$ doe info --config use_cases/113_study_habit/config.json
2
Generate the runner script
$ doe generate --config use_cases/113_study_habit/config.json \
--output use_cases/113_study_habit/results/run.sh --seed 42
3
Execute the experiments
$ bash use_cases/113_study_habit/results/run.sh
4
Analyze results
$ doe analyze --config use_cases/113_study_habit/config.json
5
Get optimization recommendations
$ doe optimize --config use_cases/113_study_habit/config.json
6
Multi-objective optimization
With 2 competing responses, use --multi to find the best compromise via Derringer–Suich desirability.
$ doe optimize --config use_cases/113_study_habit/config.json --multi
7
Generate the HTML report
$ doe report --config use_cases/113_study_habit/config.json \
--output use_cases/113_study_habit/results/report.html
Features Exercised
| Feature | Value |
|---|
| Design type | full_factorial |
| Factor types | continuous (all 4) |
| Arg style | double-dash |
| Responses | 2 (retention_pct ↑, attention_score ↑) |
| Total runs | 16 |
Analysis Results
Generated from actual experiment runs using the DOE Helper Tool.
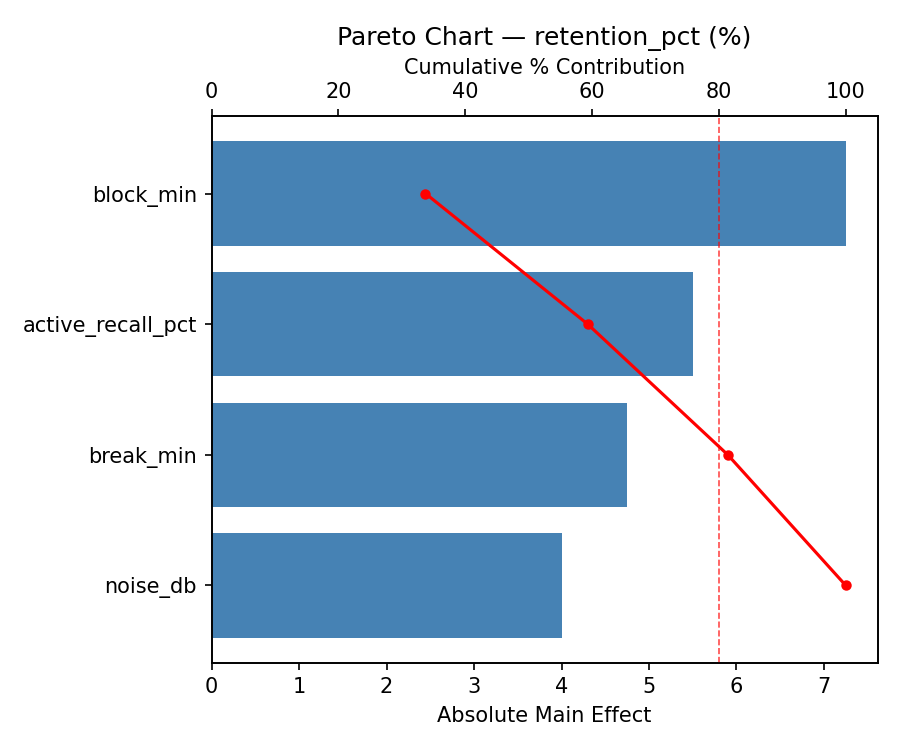
Response: retention_pct
Top factors: noise_db (43.1%), break_min (36.9%), block_min (16.9%).
ANOVA
| Source | DF | SS | MS | F | p-value |
|---|
| Source | DF | SS | MS | F | p-value |
| block_min | 1 | 30.2500 | 30.2500 | 0.167 | 0.6996 |
| break_min | 1 | 144.0000 | 144.0000 | 0.796 | 0.4132 |
| active_recall_pct | 1 | 1.0000 | 1.0000 | 0.006 | 0.9436 |
| noise_db | 1 | 196.0000 | 196.0000 | 1.083 | 0.3457 |
| block_min*break_min | 1 | 16.0000 | 16.0000 | 0.088 | 0.7782 |
| block_min*active_recall_pct | 1 | 81.0000 | 81.0000 | 0.448 | 0.5331 |
| block_min*noise_db | 1 | 16.0000 | 16.0000 | 0.088 | 0.7782 |
| break_min*active_recall_pct | 1 | 132.2500 | 132.2500 | 0.731 | 0.4316 |
| break_min*noise_db | 1 | 2.2500 | 2.2500 | 0.012 | 0.9156 |
| active_recall_pct*noise_db | 1 | 240.2500 | 240.2500 | 1.328 | 0.3013 |
| Error | 5 | 904.7500 | 180.9500 | | |
| Total | 15 | 1763.7500 | 117.5833 | | |
Pareto Chart
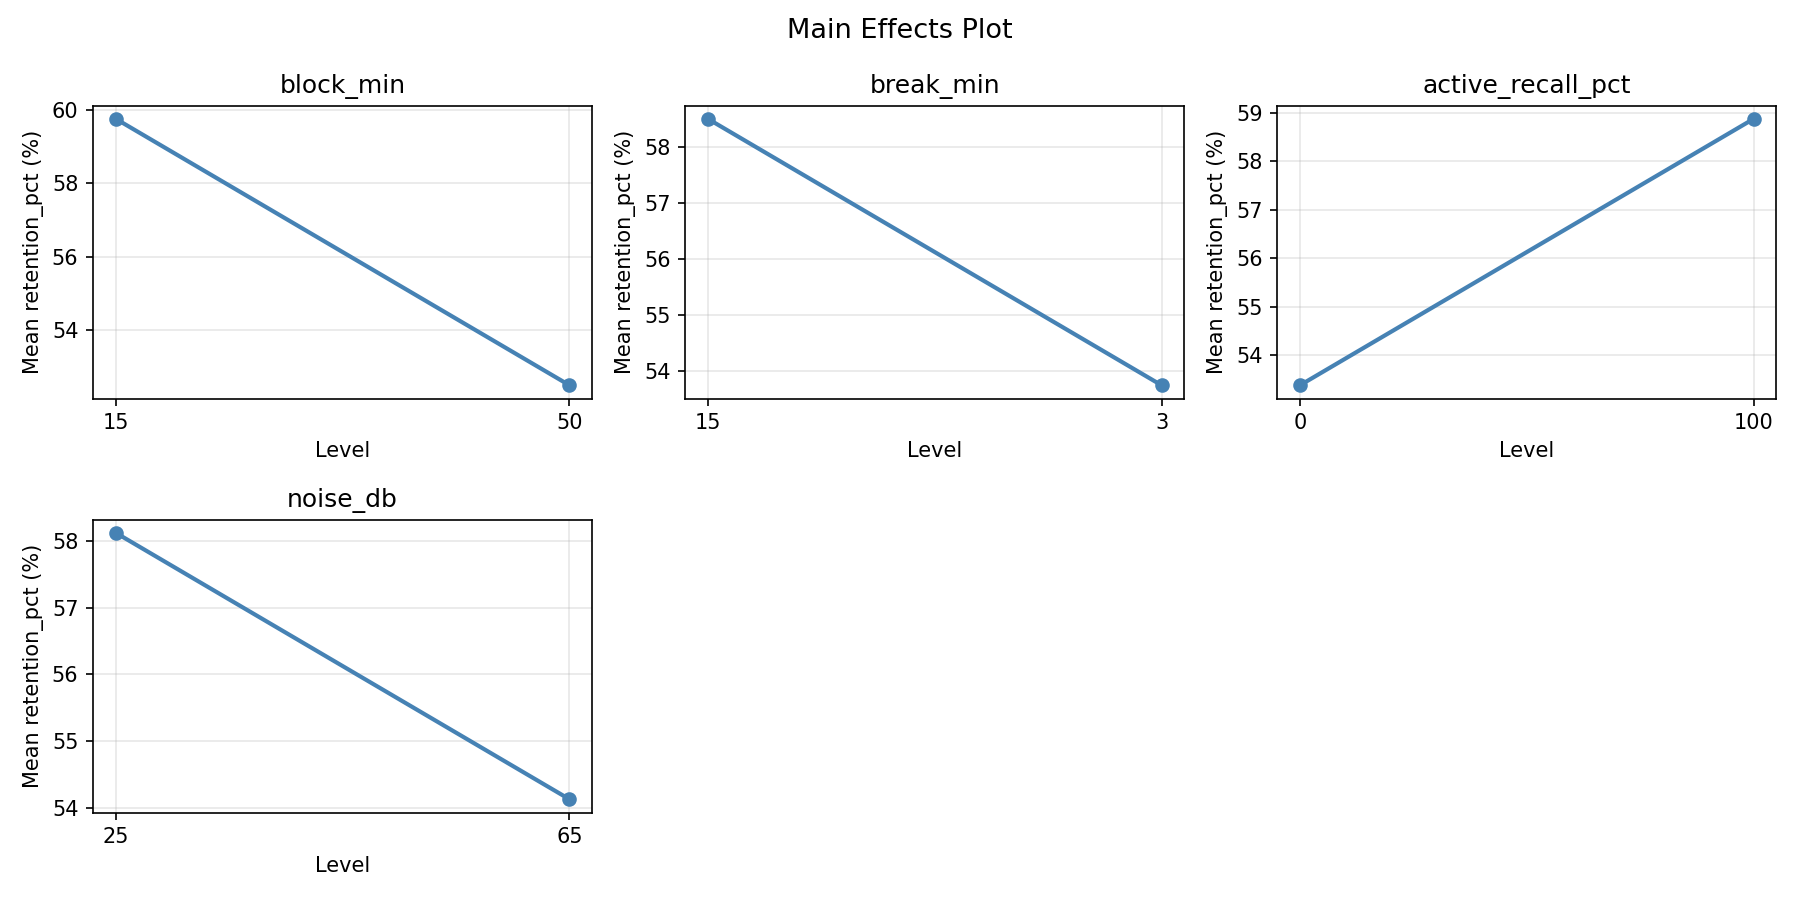
Main Effects Plot
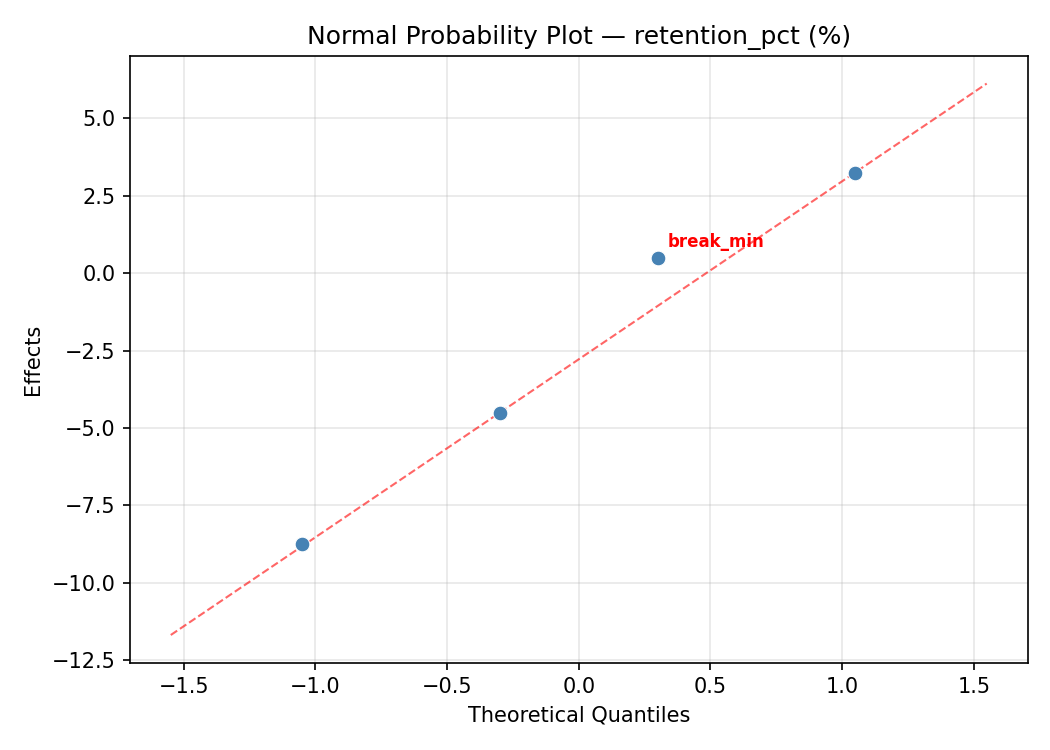
Normal Probability Plot of Effects
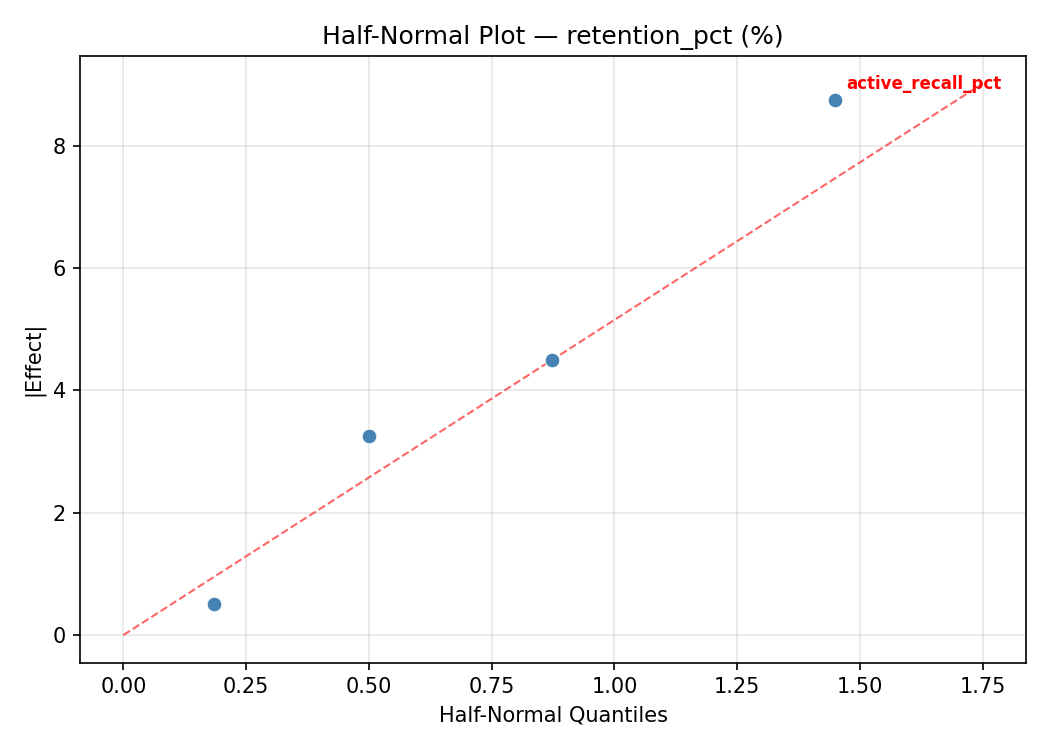
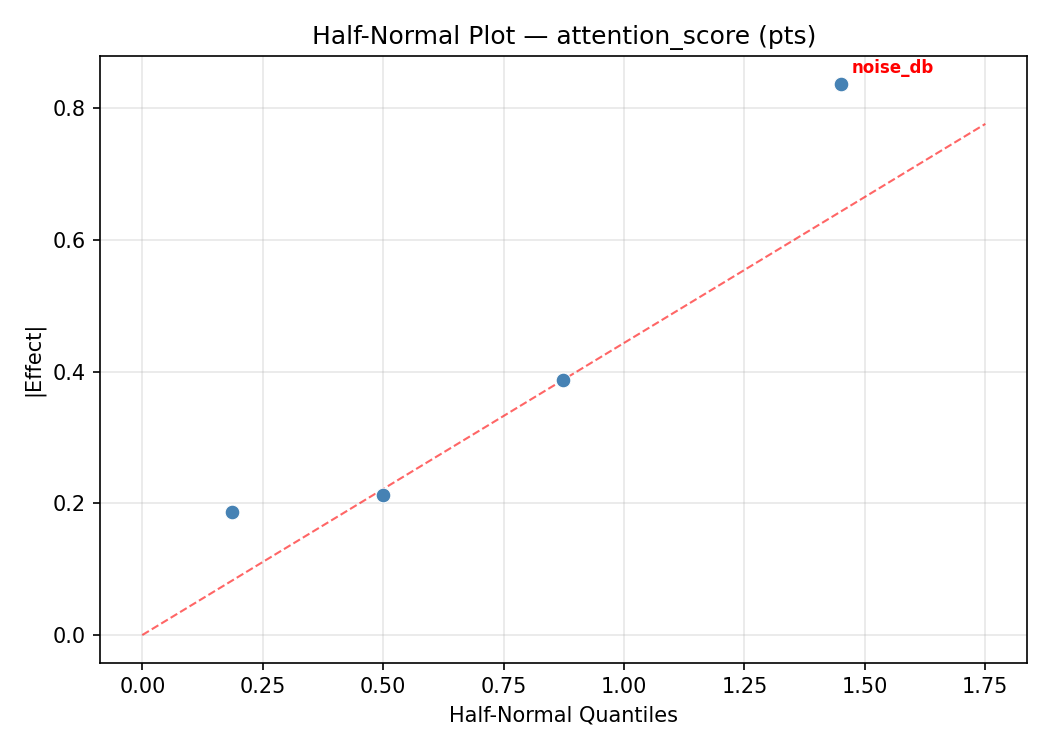
Half-Normal Plot of Effects
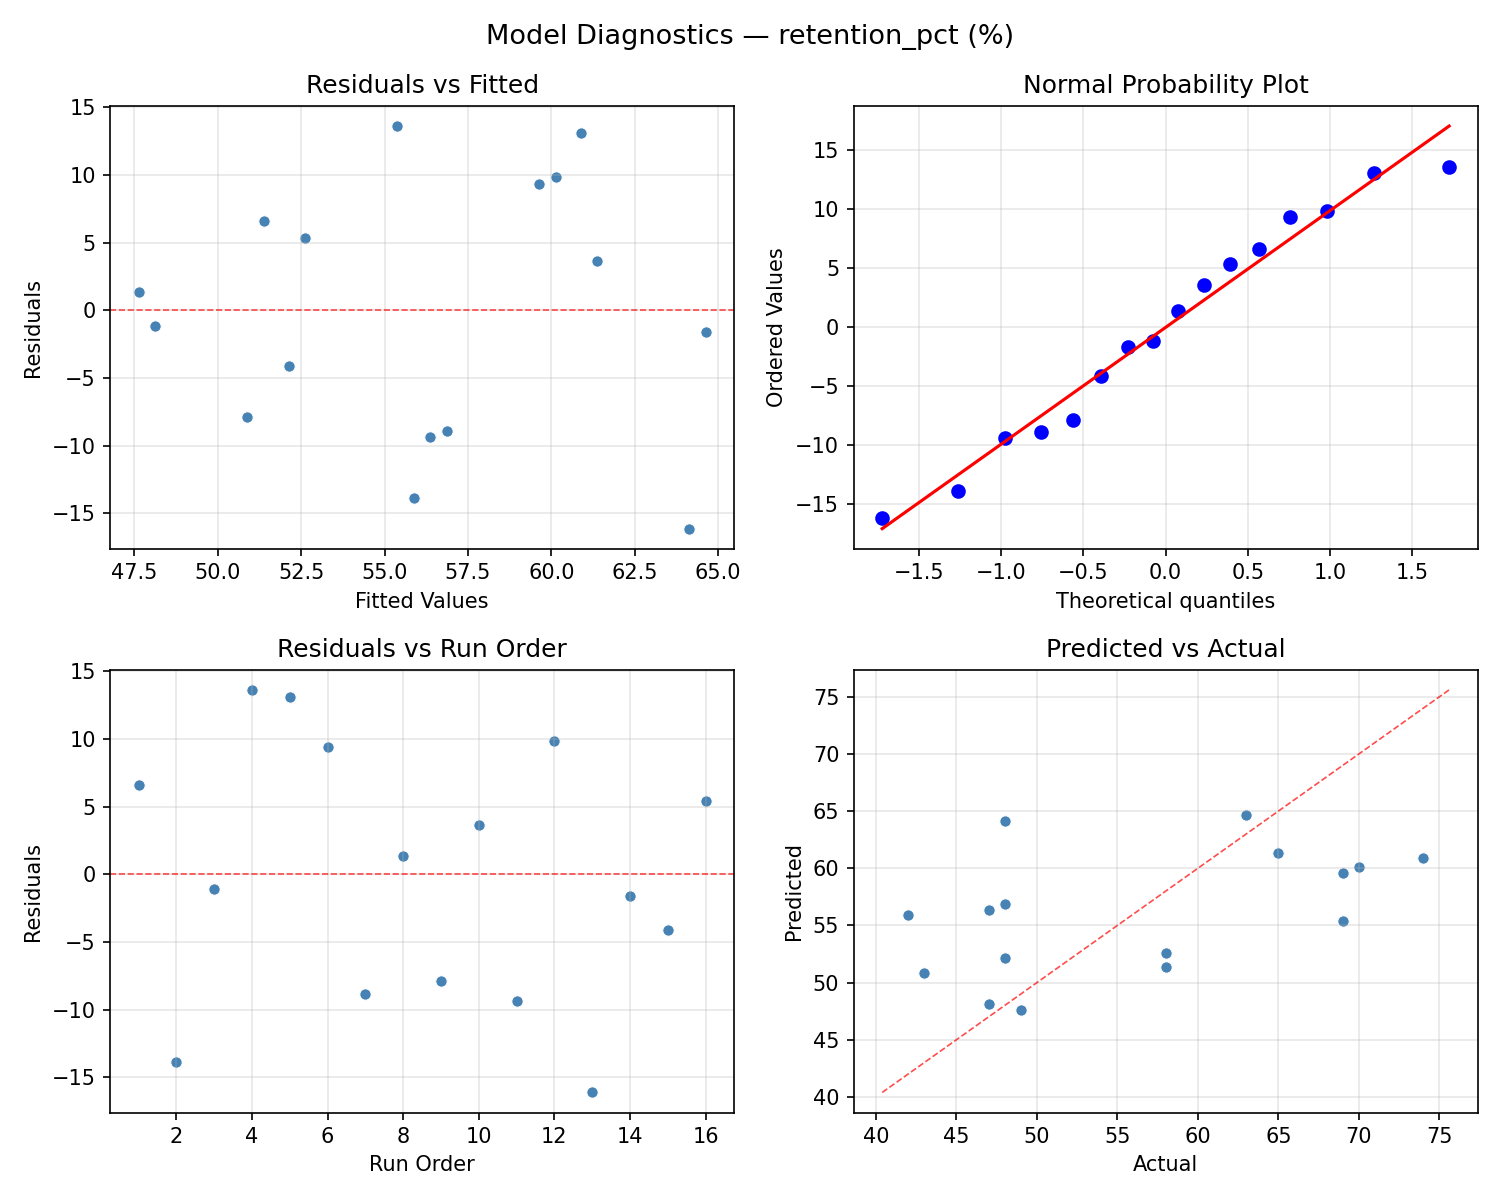
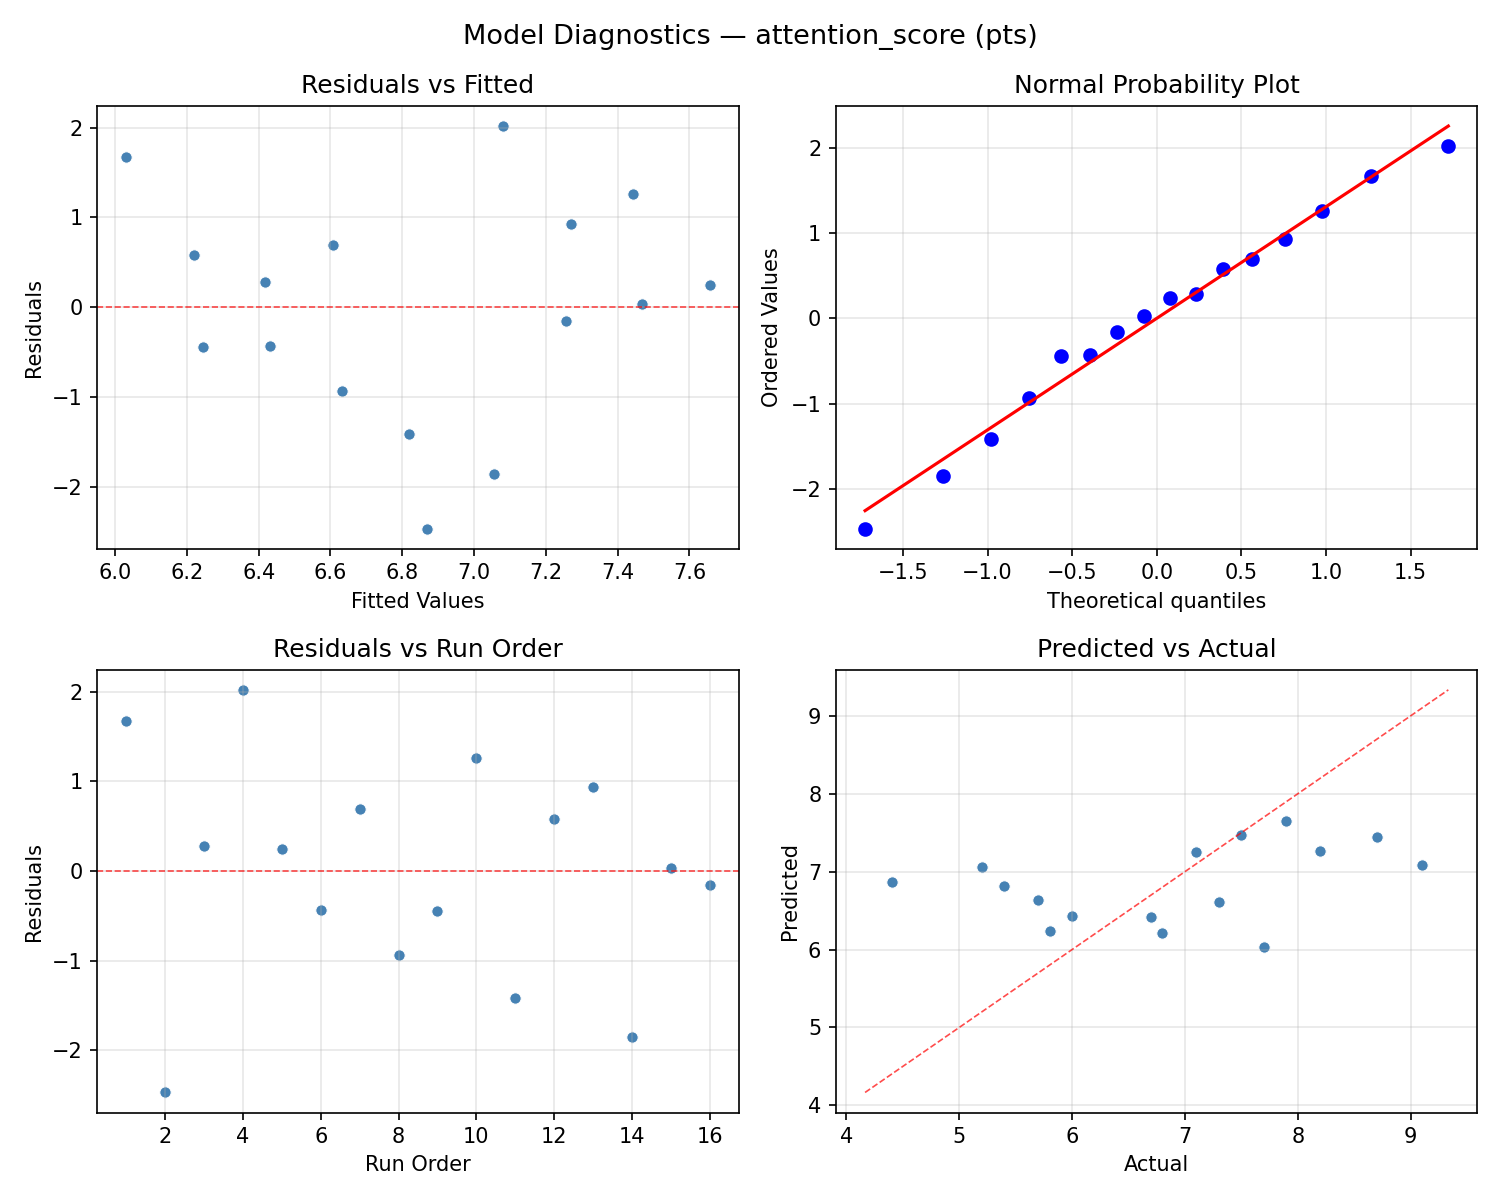
Model Diagnostics
Response: attention_score
Top factors: active_recall_pct (42.0%), block_min (29.3%), break_min (28.2%).
ANOVA
| Source | DF | SS | MS | F | p-value |
|---|
| Source | DF | SS | MS | F | p-value |
| block_min | 1 | 1.8906 | 1.8906 | 1.692 | 0.2501 |
| break_min | 1 | 1.7556 | 1.7556 | 1.571 | 0.2655 |
| active_recall_pct | 1 | 3.9006 | 3.9006 | 3.490 | 0.1207 |
| noise_db | 1 | 0.0006 | 0.0006 | 0.001 | 0.9820 |
| block_min*break_min | 1 | 0.2256 | 0.2256 | 0.202 | 0.6720 |
| block_min*active_recall_pct | 1 | 0.1056 | 0.1056 | 0.095 | 0.7709 |
| block_min*noise_db | 1 | 3.1506 | 3.1506 | 2.819 | 0.1540 |
| break_min*active_recall_pct | 1 | 0.5256 | 0.5256 | 0.470 | 0.5233 |
| break_min*noise_db | 1 | 0.5256 | 0.5256 | 0.470 | 0.5233 |
| active_recall_pct*noise_db | 1 | 9.1506 | 9.1506 | 8.188 | 0.0353 |
| Error | 5 | 5.5881 | 1.1176 | | |
| Total | 15 | 26.8194 | 1.7880 | | |
Pareto Chart
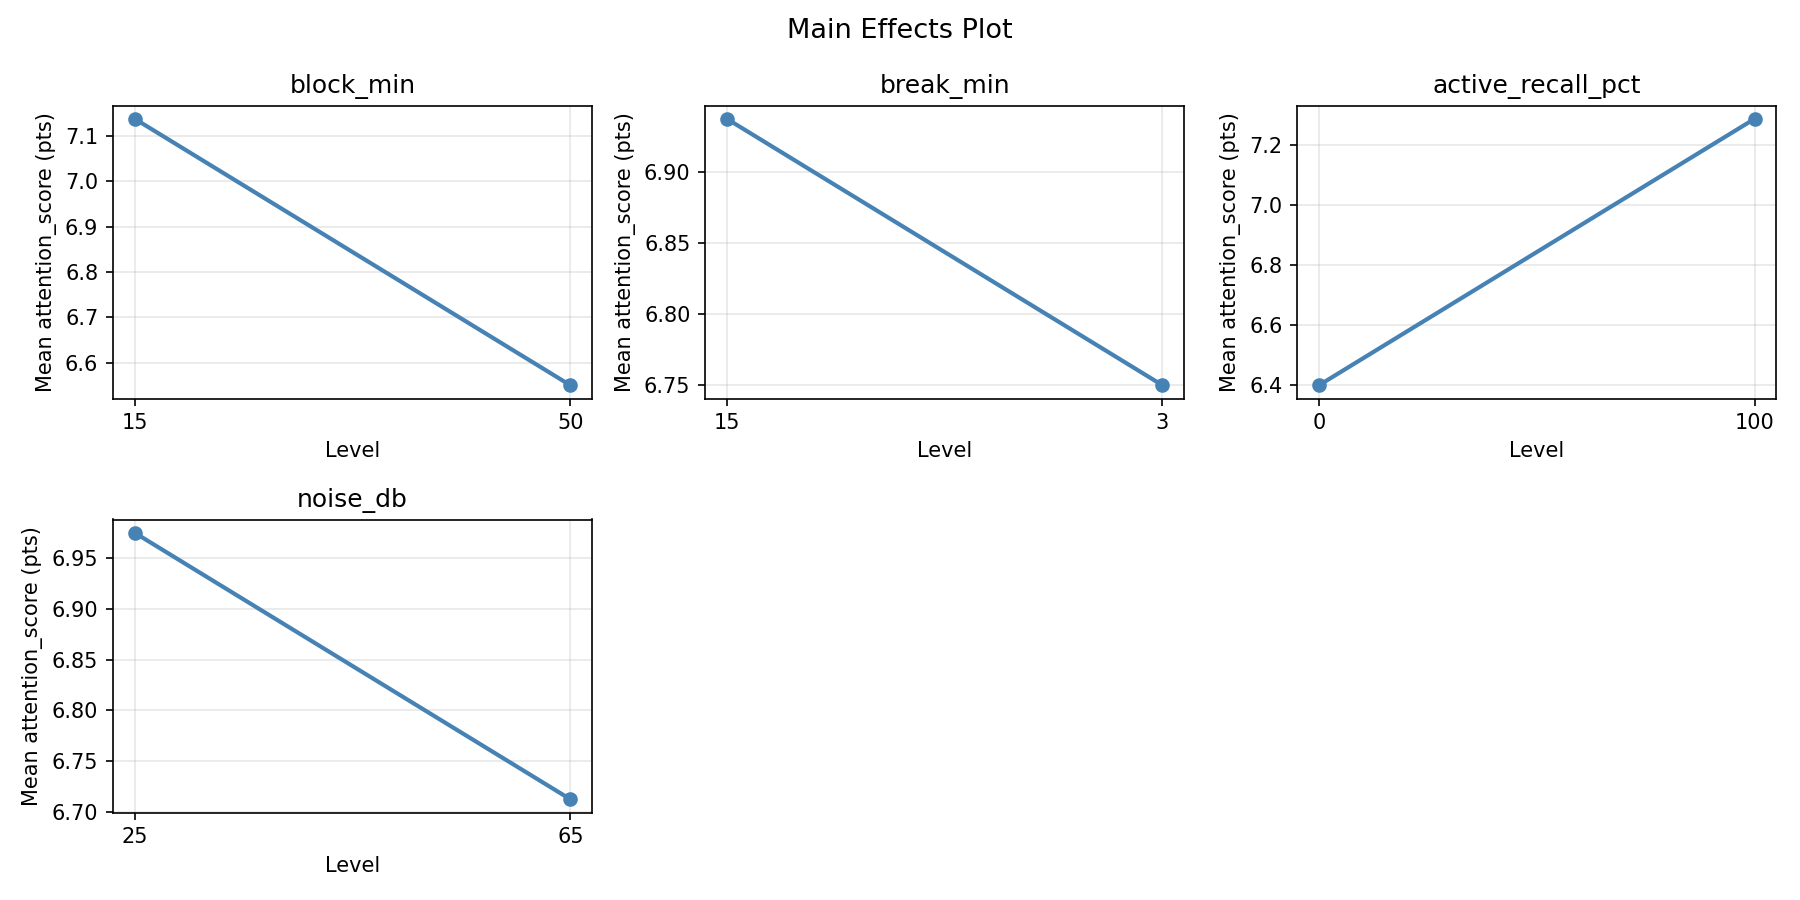
Main Effects Plot
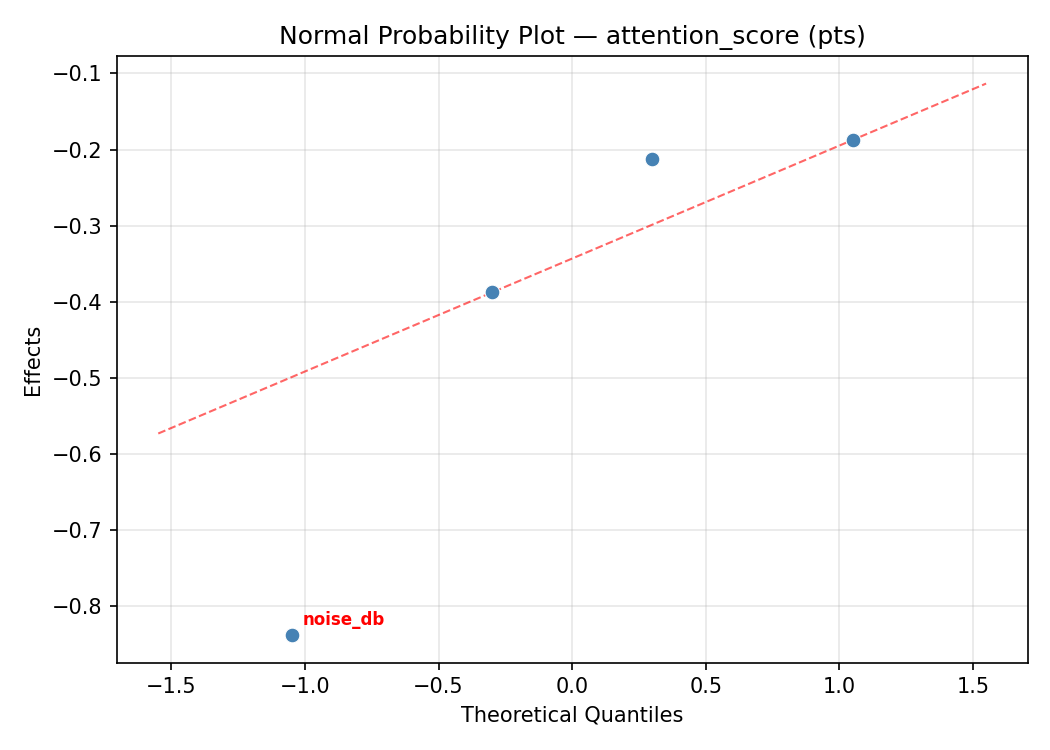
Normal Probability Plot of Effects
Half-Normal Plot of Effects
Model Diagnostics
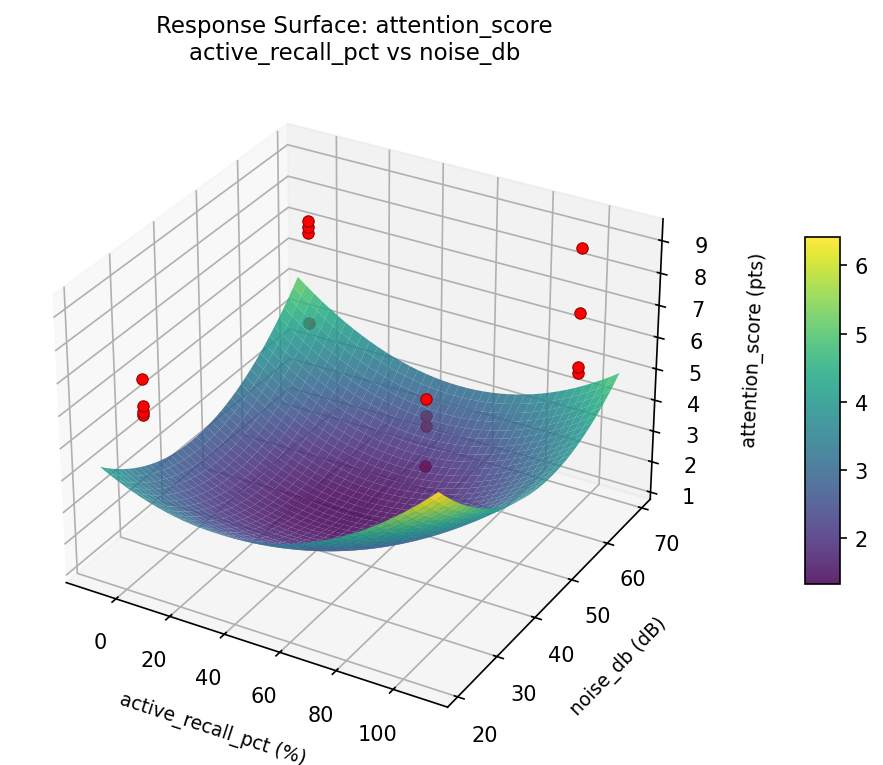
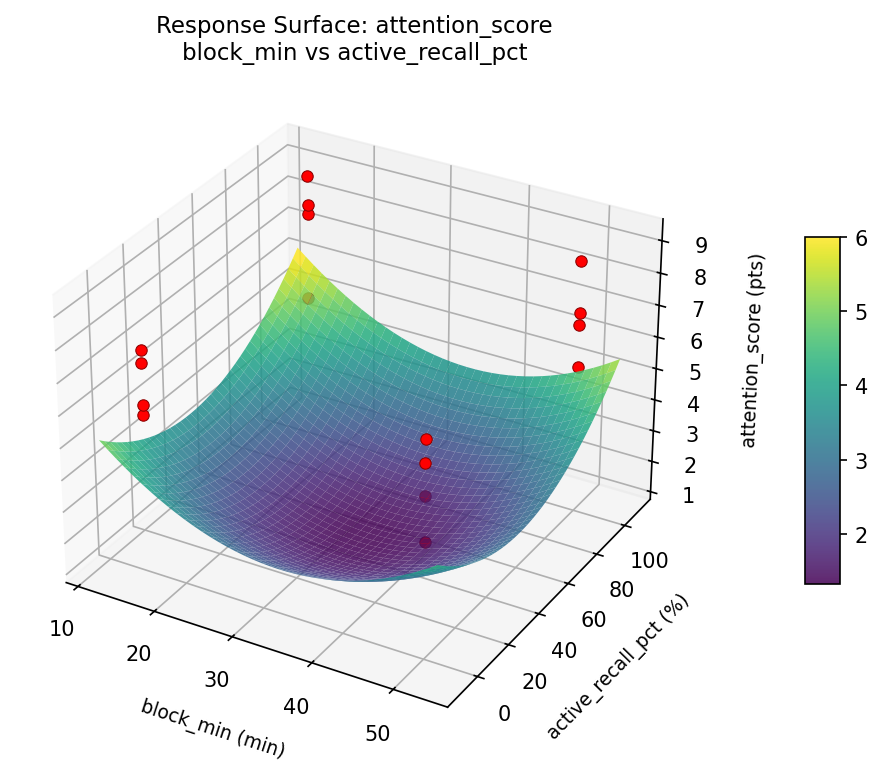
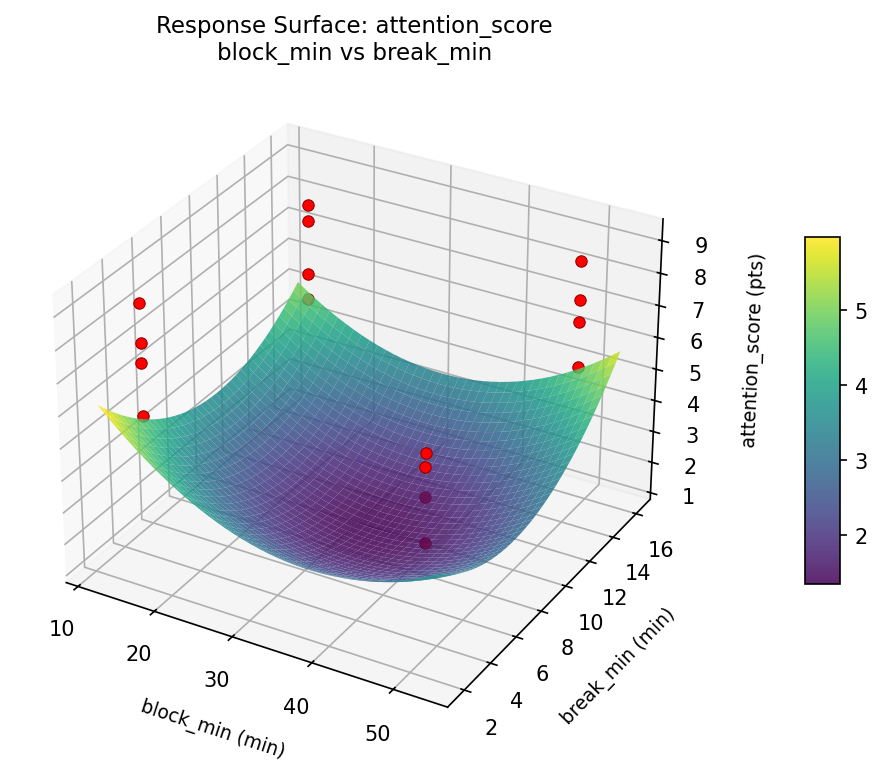
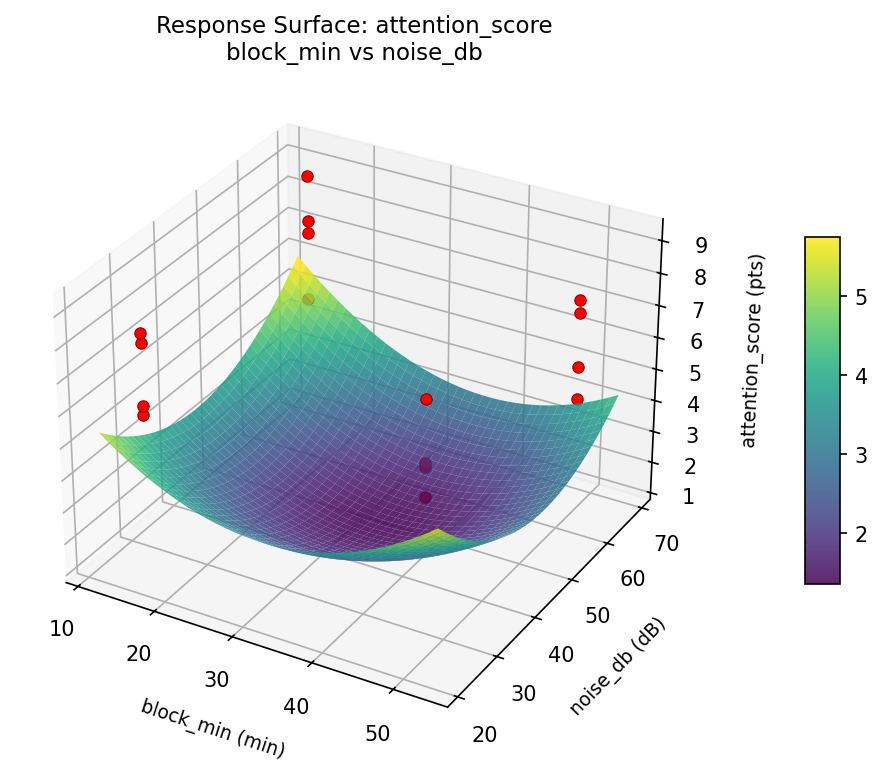
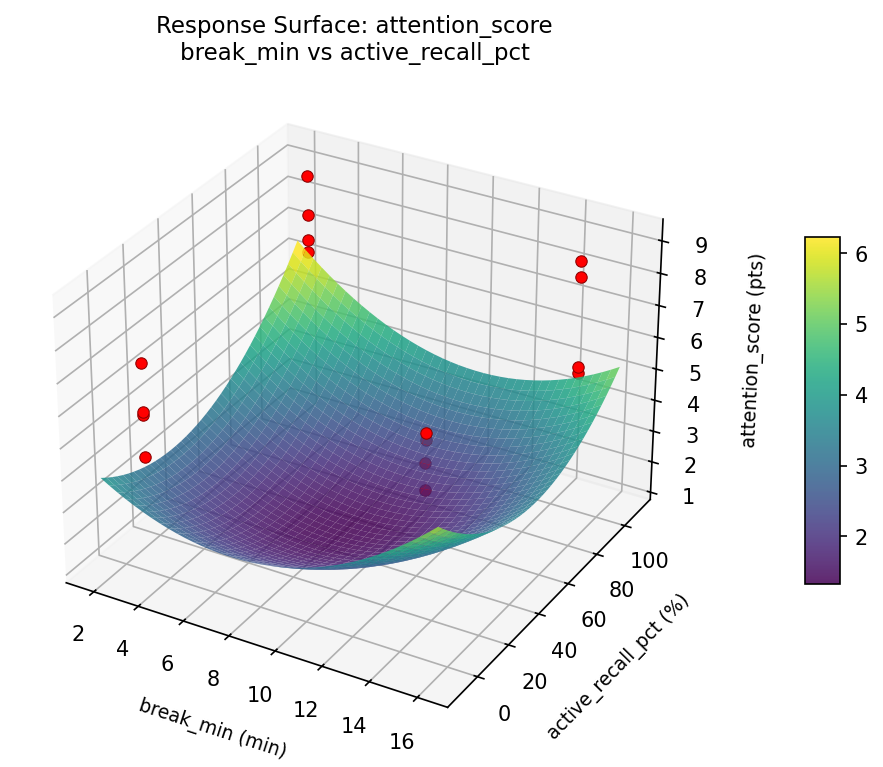
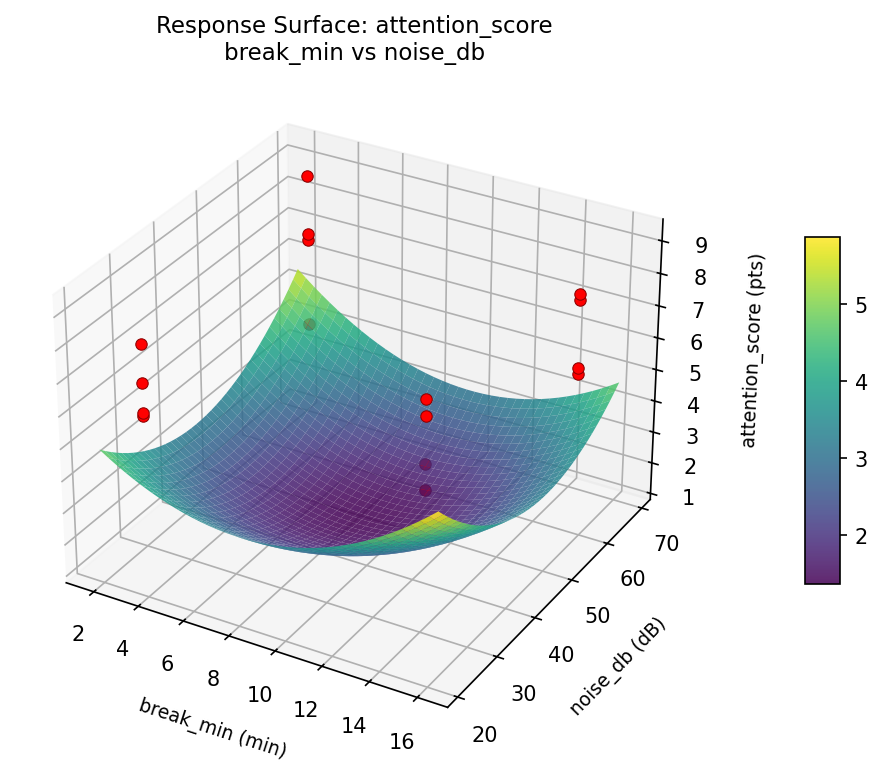
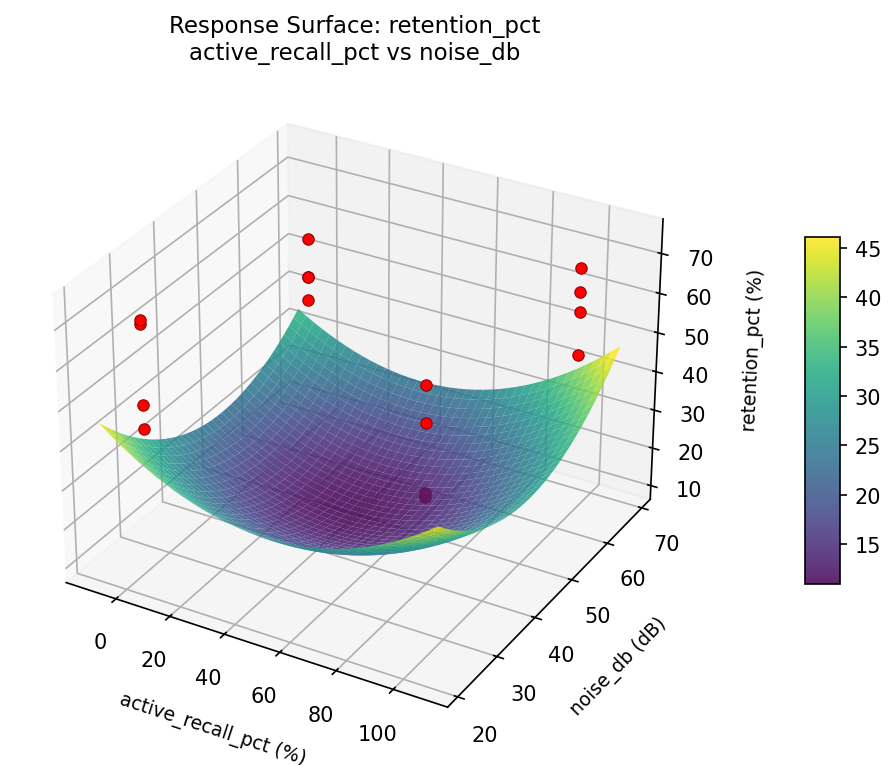
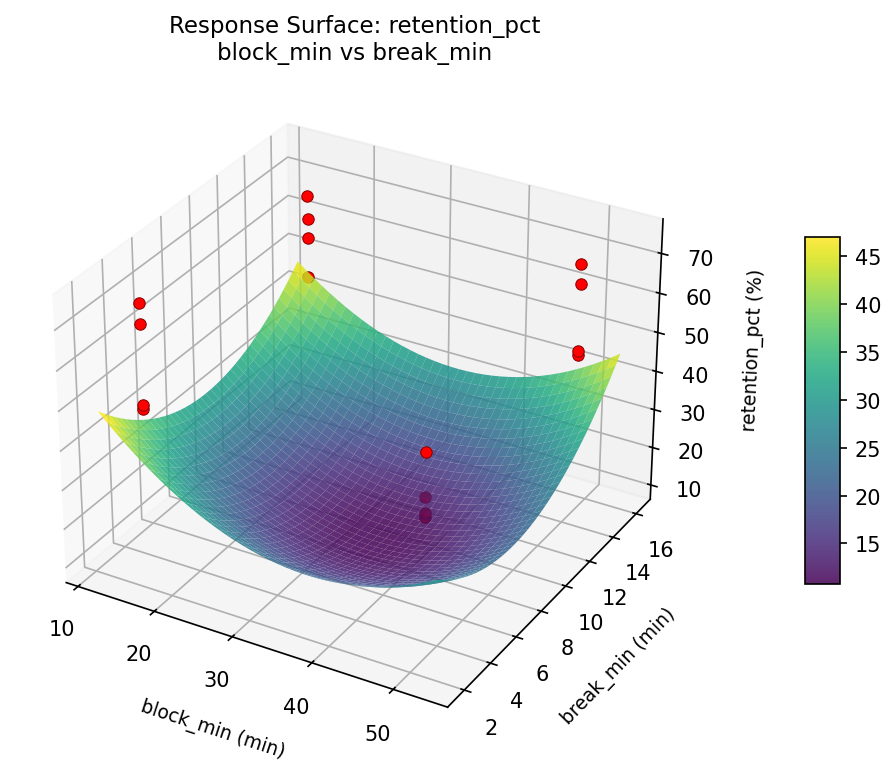
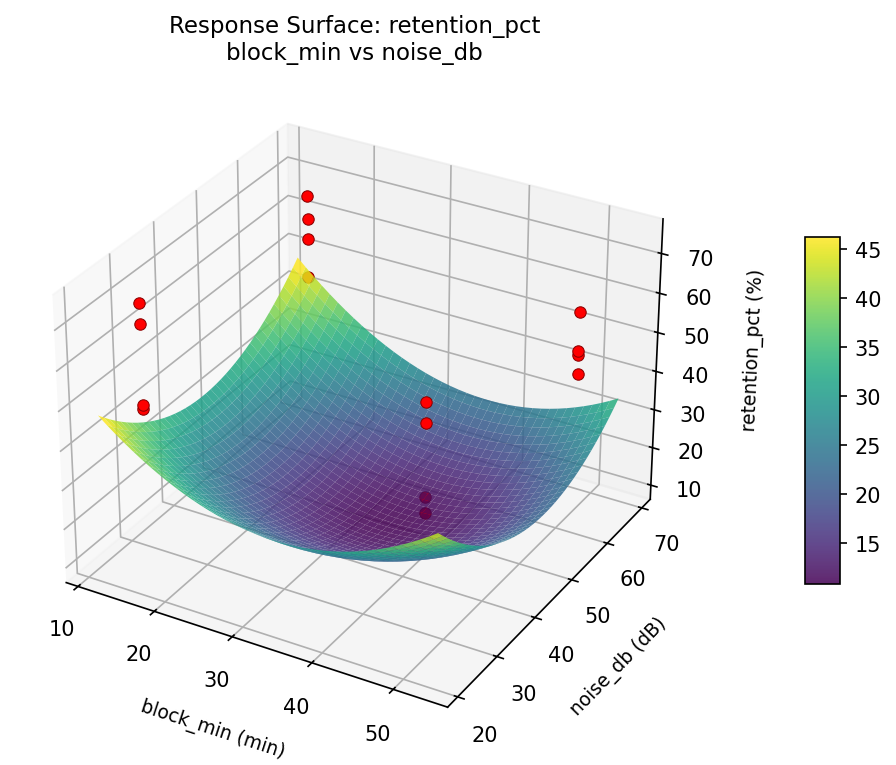
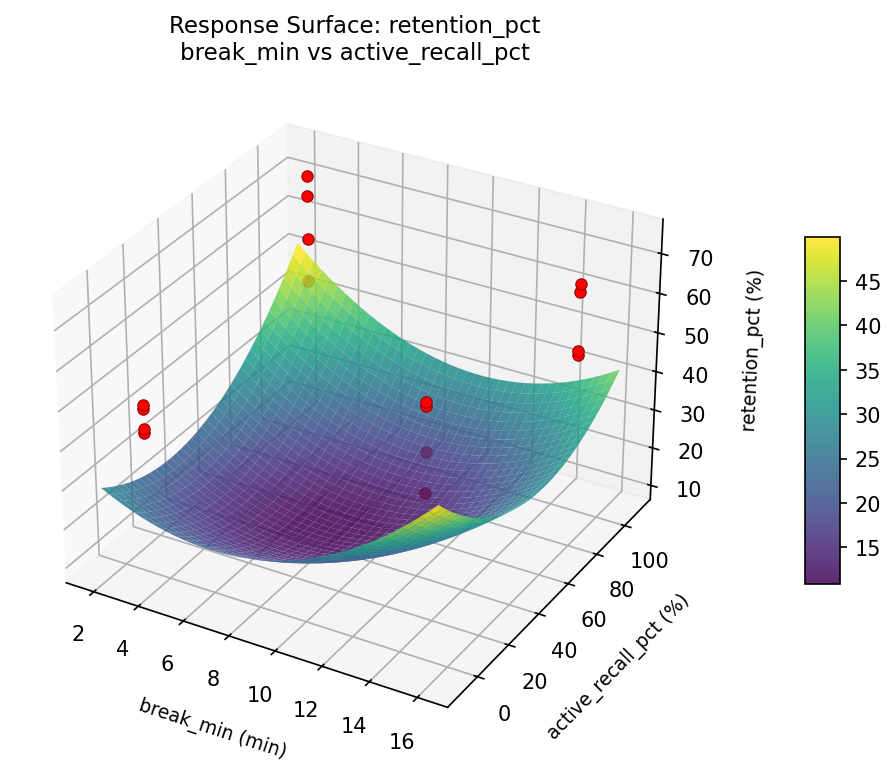
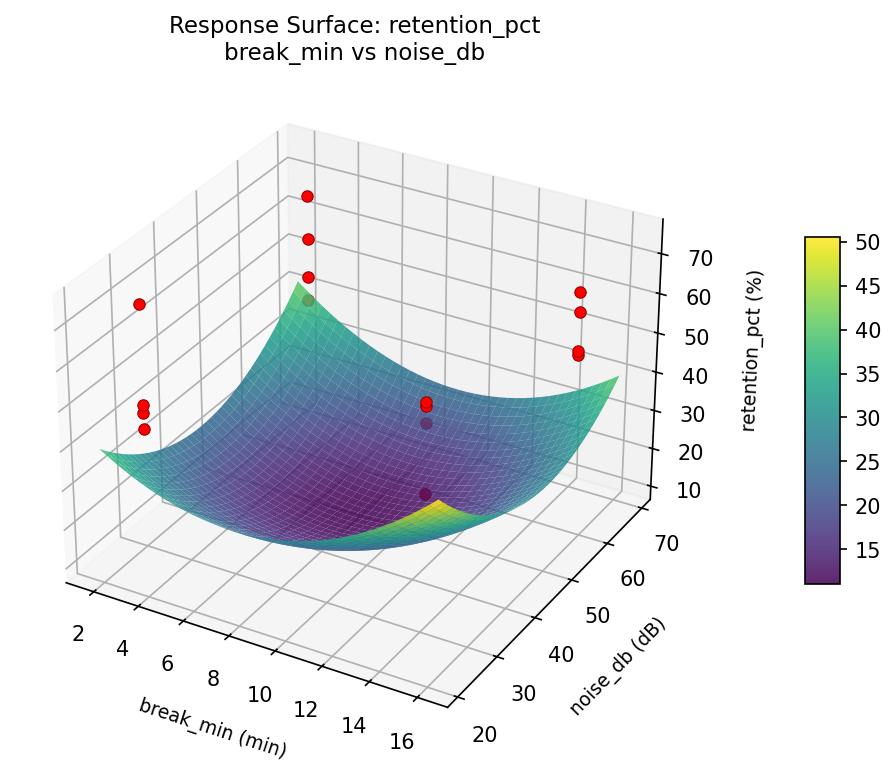
Response Surface Plots
3D surfaces fitted with quadratic RSM. Red dots are observed data points.
attention score active recall pct vs noise db
attention score block min vs active recall pct
attention score block min vs break min
attention score block min vs noise db
attention score break min vs active recall pct
attention score break min vs noise db
retention pct active recall pct vs noise db
retention pct block min vs active recall pct

retention pct block min vs break min
retention pct block min vs noise db
retention pct break min vs active recall pct
retention pct break min vs noise db
Multi-Objective Optimization
When responses compete, Derringer–Suich desirability finds the best compromise.
Each response is scaled to a 0–1 desirability, then combined via a weighted geometric mean.
Overall Desirability
D = 0.8807
Per-Response Desirability
| Response | Weight | Desirability | Predicted | Dir |
|---|
retention_pct |
1.5 |
|
69.00 0.8125 69.00 % |
↑ |
attention_score |
1.5 |
|
9.10 0.9545 9.10 pts |
↑ |
Recommended Settings
| Factor | Value |
|---|
block_min | 50 min |
break_min | 15 min |
active_recall_pct | 100 % |
noise_db | 25 dB |
Source: from observed run #4
Trade-off Summary
Sacrifice = how much worse than single-objective best.
| Response | Predicted | Best Observed | Sacrifice |
|---|
attention_score | 9.10 | 9.10 | +0.00 |
Top 3 Runs by Desirability
| Run | D | Factor Settings |
|---|
| #5 | 0.8304 | block_min=15, break_min=3, active_recall_pct=0, noise_db=25 |
| #10 | 0.7830 | block_min=50, break_min=15, active_recall_pct=0, noise_db=25 |
Model Quality
| Response | R² | Type |
|---|
attention_score | 0.3351 | linear |
Full Multi-Objective Output
============================================================
MULTI-OBJECTIVE OPTIMIZATION
Method: Derringer-Suich Desirability Function
============================================================
Overall desirability: D = 0.8807
Response Weight Desirability Predicted Direction
---------------------------------------------------------------------
retention_pct 1.5 0.8125 69.00 % ↑
attention_score 1.5 0.9545 9.10 pts ↑
Recommended settings:
block_min = 50 min
break_min = 15 min
active_recall_pct = 100 %
noise_db = 25 dB
(from observed run #4)
Trade-off summary:
retention_pct: 69.00 (best observed: 74.00, sacrifice: +5.00)
attention_score: 9.10 (best observed: 9.10, sacrifice: +0.00)
Model quality:
retention_pct: R² = 0.3756 (linear)
attention_score: R² = 0.3351 (linear)
Top 3 observed runs by overall desirability:
1. Run #4 (D=0.8807): block_min=50, break_min=15, active_recall_pct=100, noise_db=25
2. Run #5 (D=0.8304): block_min=15, break_min=3, active_recall_pct=0, noise_db=25
3. Run #10 (D=0.7830): block_min=50, break_min=15, active_recall_pct=0, noise_db=25
Full Analysis Output
=== Main Effects: retention_pct ===
Factor Effect Std Error % Contribution
--------------------------------------------------------------
noise_db 7.0000 2.7109 43.1%
break_min 6.0000 2.7109 36.9%
block_min 2.7500 2.7109 16.9%
active_recall_pct 0.5000 2.7109 3.1%
=== ANOVA Table: retention_pct ===
Source DF SS MS F p-value
-----------------------------------------------------------------------------
block_min 1 30.2500 30.2500 0.167 0.6996
break_min 1 144.0000 144.0000 0.796 0.4132
active_recall_pct 1 1.0000 1.0000 0.006 0.9436
noise_db 1 196.0000 196.0000 1.083 0.3457
block_min*break_min 1 16.0000 16.0000 0.088 0.7782
block_min*active_recall_pct 1 81.0000 81.0000 0.448 0.5331
block_min*noise_db 1 16.0000 16.0000 0.088 0.7782
break_min*active_recall_pct 1 132.2500 132.2500 0.731 0.4316
break_min*noise_db 1 2.2500 2.2500 0.012 0.9156
active_recall_pct*noise_db 1 240.2500 240.2500 1.328 0.3013
Error 5 904.7500 180.9500
Total 15 1763.7500 117.5833
=== Interaction Effects: retention_pct ===
Factor A Factor B Interaction % Contribution
------------------------------------------------------------------------
active_recall_pct noise_db 7.7500 34.1%
break_min active_recall_pct 5.7500 25.3%
block_min active_recall_pct -4.5000 19.8%
block_min break_min -2.0000 8.8%
block_min noise_db 2.0000 8.8%
break_min noise_db -0.7500 3.3%
=== Summary Statistics: retention_pct ===
block_min:
Level N Mean Std Min Max
------------------------------------------------------------
15 8 54.7500 12.8035 42.0000 74.0000
50 8 57.5000 9.1496 47.0000 69.0000
break_min:
Level N Mean Std Min Max
------------------------------------------------------------
15 8 53.1250 9.7018 42.0000 69.0000
3 8 59.1250 11.7161 43.0000 74.0000
active_recall_pct:
Level N Mean Std Min Max
------------------------------------------------------------
0 8 55.8750 10.5619 43.0000 70.0000
100 8 56.3750 11.8435 42.0000 74.0000
noise_db:
Level N Mean Std Min Max
------------------------------------------------------------
25 8 52.6250 8.8630 42.0000 70.0000
65 8 59.6250 12.0586 43.0000 74.0000
=== Main Effects: attention_score ===
Factor Effect Std Error % Contribution
--------------------------------------------------------------
active_recall_pct 0.9875 0.3343 42.0%
block_min 0.6875 0.3343 29.3%
break_min 0.6625 0.3343 28.2%
noise_db 0.0125 0.3343 0.5%
=== ANOVA Table: attention_score ===
Source DF SS MS F p-value
-----------------------------------------------------------------------------
block_min 1 1.8906 1.8906 1.692 0.2501
break_min 1 1.7556 1.7556 1.571 0.2655
active_recall_pct 1 3.9006 3.9006 3.490 0.1207
noise_db 1 0.0006 0.0006 0.001 0.9820
block_min*break_min 1 0.2256 0.2256 0.202 0.6720
block_min*active_recall_pct 1 0.1056 0.1056 0.095 0.7709
block_min*noise_db 1 3.1506 3.1506 2.819 0.1540
break_min*active_recall_pct 1 0.5256 0.5256 0.470 0.5233
break_min*noise_db 1 0.5256 0.5256 0.470 0.5233
active_recall_pct*noise_db 1 9.1506 9.1506 8.188 0.0353
Error 5 5.5881 1.1176
Total 15 26.8194 1.7880
=== Interaction Effects: attention_score ===
Factor A Factor B Interaction % Contribution
------------------------------------------------------------------------
active_recall_pct noise_db 1.5125 42.9%
block_min noise_db -0.8875 25.2%
break_min active_recall_pct 0.3625 10.3%
break_min noise_db -0.3625 10.3%
block_min break_min -0.2375 6.7%
block_min active_recall_pct -0.1625 4.6%
=== Summary Statistics: attention_score ===
block_min:
Level N Mean Std Min Max
------------------------------------------------------------
15 8 6.5000 1.4283 4.4000 8.7000
50 8 7.1875 1.2334 5.2000 9.1000
break_min:
Level N Mean Std Min Max
------------------------------------------------------------
15 8 6.5125 1.4055 4.4000 8.7000
3 8 7.1750 1.2669 5.2000 9.1000
active_recall_pct:
Level N Mean Std Min Max
------------------------------------------------------------
0 8 6.3500 1.1032 5.2000 8.2000
100 8 7.3375 1.4342 4.4000 9.1000
noise_db:
Level N Mean Std Min Max
------------------------------------------------------------
25 8 6.8375 1.2282 4.4000 8.2000
65 8 6.8500 1.5241 5.2000 9.1000
Optimization Recommendations
=== Optimization: retention_pct ===
Direction: maximize
Best observed run: #5
block_min = 15
break_min = 3
active_recall_pct = 100
noise_db = 25
Value: 74.0
RSM Model (linear, R² = 0.0557, Adj R² = -0.2877):
Coefficients:
intercept +56.1250
block_min +1.5000
break_min -0.2500
active_recall_pct +0.8750
noise_db -1.7500
RSM Model (quadratic, R² = 0.5086, Adj R² = -6.3714):
Coefficients:
intercept +11.2250
block_min +1.5000
break_min -0.2500
active_recall_pct +0.8750
noise_db -1.7500
block_min*break_min -3.1250
block_min*active_recall_pct -1.7500
block_min*noise_db +0.8750
break_min*active_recall_pct +1.7500
break_min*noise_db +2.8750
active_recall_pct*noise_db -5.0000
block_min^2 +11.2250
break_min^2 +11.2250
active_recall_pct^2 +11.2250
noise_db^2 +11.2250
Curvature analysis:
block_min coef=+11.2250 convex (has a minimum)
break_min coef=+11.2250 convex (has a minimum)
active_recall_pct coef=+11.2250 convex (has a minimum)
noise_db coef=+11.2250 convex (has a minimum)
Notable interactions:
active_recall_pct*noise_db coef=-5.0000 (antagonistic)
block_min*break_min coef=-3.1250 (antagonistic)
break_min*noise_db coef=+2.8750 (synergistic)
block_min*active_recall_pct coef=-1.7500 (antagonistic)
break_min*active_recall_pct coef=+1.7500 (synergistic)
block_min*noise_db coef=+0.8750 (synergistic)
Predicted optimum (from linear model, at observed points):
block_min = 50
break_min = 3
active_recall_pct = 100
noise_db = 25
Predicted value: 60.5000
Surface optimum (via L-BFGS-B, linear model):
block_min = 50
break_min = 3
active_recall_pct = 100
noise_db = 25
Predicted value: 60.5000
Model quality: Weak fit — consider adding center points or using a different design.
Factor importance:
1. noise_db (effect: -3.5, contribution: 40.0%)
2. block_min (effect: 3.0, contribution: 34.3%)
3. active_recall_pct (effect: 1.8, contribution: 20.0%)
4. break_min (effect: 0.5, contribution: 5.7%)
=== Optimization: attention_score ===
Direction: maximize
Best observed run: #4
block_min = 50
break_min = 3
active_recall_pct = 0
noise_db = 25
Value: 9.1
RSM Model (linear, R² = 0.1082, Adj R² = -0.2161):
Coefficients:
intercept +6.8438
block_min +0.0313
break_min -0.2313
active_recall_pct +0.1313
noise_db -0.3313
RSM Model (quadratic, R² = 0.5424, Adj R² = -5.8643):
Coefficients:
intercept +1.3688
block_min +0.0312
break_min -0.2313
active_recall_pct +0.1313
noise_db -0.3313
block_min*break_min -0.4688
block_min*active_recall_pct -0.1312
block_min*noise_db -0.1938
break_min*active_recall_pct +0.3312
break_min*noise_db +0.2188
active_recall_pct*noise_db -0.5438
block_min^2 +1.3688
break_min^2 +1.3688
active_recall_pct^2 +1.3688
noise_db^2 +1.3688
Curvature analysis:
block_min coef=+1.3688 convex (has a minimum)
break_min coef=+1.3688 convex (has a minimum)
active_recall_pct coef=+1.3688 convex (has a minimum)
noise_db coef=+1.3688 convex (has a minimum)
Notable interactions:
active_recall_pct*noise_db coef=-0.5438 (antagonistic)
block_min*break_min coef=-0.4688 (antagonistic)
break_min*active_recall_pct coef=+0.3312 (synergistic)
Predicted optimum (from linear model, at observed points):
block_min = 50
break_min = 3
active_recall_pct = 100
noise_db = 25
Predicted value: 7.5688
Surface optimum (via L-BFGS-B, linear model):
block_min = 50
break_min = 3
active_recall_pct = 100
noise_db = 25
Predicted value: 7.5688
Model quality: Weak fit — consider adding center points or using a different design.
Factor importance:
1. noise_db (effect: -0.7, contribution: 45.7%)
2. break_min (effect: 0.5, contribution: 31.9%)
3. active_recall_pct (effect: 0.3, contribution: 18.1%)
4. block_min (effect: 0.1, contribution: 4.3%)