Summary
This experiment investigates home insulation optimization. Full factorial of attic R-value, wall R-value, window U-factor, and air sealing effort to minimize heating cost and maximize comfort.
The design varies 4 factors: attic r (R-value), ranging from 19 to 49, wall r (R-value), ranging from 11 to 21, window u (U-factor), ranging from 0.25 to 0.65, and air seal ach (ACH50), ranging from 2 to 8. The goal is to optimize 2 responses: annual heat cost (USD) (minimize) and comfort score (pts) (maximize). Fixed conditions held constant across all runs include climate zone = 5A, house sqft = 2000.
A full factorial design was used to explore all 16 possible combinations of the 4 factors at two levels. This guarantees that every main effect and interaction can be estimated independently, at the cost of a larger experiment (16 runs).
Quadratic response surface models were fitted to capture potential curvature and factor interactions. The RSM contour plots below visualize how pairs of factors jointly affect each response.
Key Findings
For annual heat cost, the most influential factors were window u (37.7%), wall r (28.3%), air seal ach (22.7%). The best observed value was 687.0 (at attic r = 49, wall r = 11, window u = 0.65).
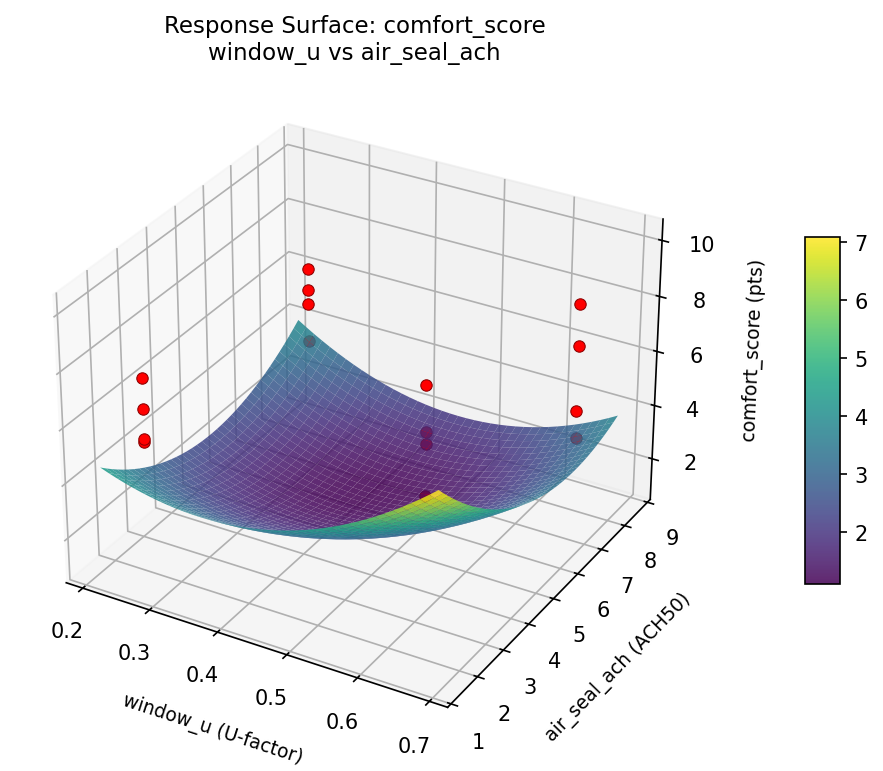
For comfort score, the most influential factors were window u (40.4%), wall r (32.8%), attic r (18.8%). The best observed value was 10.1 (at attic r = 49, wall r = 11, window u = 0.65).
Recommended Next Steps
- Consider whether any fixed factors should be varied in a future study.
Experimental Setup
Factors
| Factor | Low | High | Unit |
|---|
attic_r | 19 | 49 | R-value |
wall_r | 11 | 21 | R-value |
window_u | 0.25 | 0.65 | U-factor |
air_seal_ach | 2 | 8 | ACH50 |
Fixed: climate_zone = 5A, house_sqft = 2000
Responses
| Response | Direction | Unit |
|---|
annual_heat_cost | ↓ minimize | USD |
comfort_score | ↑ maximize | pts |
Configuration
{
"metadata": {
"name": "Home Insulation Optimization",
"description": "Full factorial of attic R-value, wall R-value, window U-factor, and air sealing effort to minimize heating cost and maximize comfort"
},
"factors": [
{
"name": "attic_r",
"levels": [
"19",
"49"
],
"type": "continuous",
"unit": "R-value"
},
{
"name": "wall_r",
"levels": [
"11",
"21"
],
"type": "continuous",
"unit": "R-value"
},
{
"name": "window_u",
"levels": [
"0.25",
"0.65"
],
"type": "continuous",
"unit": "U-factor"
},
{
"name": "air_seal_ach",
"levels": [
"2",
"8"
],
"type": "continuous",
"unit": "ACH50"
}
],
"fixed_factors": {
"climate_zone": "5A",
"house_sqft": "2000"
},
"responses": [
{
"name": "annual_heat_cost",
"optimize": "minimize",
"unit": "USD"
},
{
"name": "comfort_score",
"optimize": "maximize",
"unit": "pts"
}
],
"settings": {
"operation": "full_factorial",
"test_script": "use_cases/129_home_insulation/sim.sh"
}
}
Experimental Matrix
The Full Factorial Design produces 16 runs. Each row is one experiment with specific factor settings.
| Run | attic_r | wall_r | window_u | air_seal_ach |
|---|
| 1 | 19 | 21 | 0.65 | 8 |
| 2 | 49 | 11 | 0.25 | 8 |
| 3 | 19 | 21 | 0.25 | 8 |
| 4 | 19 | 21 | 0.65 | 2 |
| 5 | 49 | 21 | 0.65 | 2 |
| 6 | 49 | 11 | 0.65 | 2 |
| 7 | 49 | 21 | 0.25 | 2 |
| 8 | 49 | 11 | 0.25 | 2 |
| 9 | 19 | 11 | 0.25 | 8 |
| 10 | 19 | 11 | 0.65 | 2 |
| 11 | 49 | 21 | 0.25 | 8 |
| 12 | 49 | 21 | 0.65 | 8 |
| 13 | 19 | 21 | 0.25 | 2 |
| 14 | 49 | 11 | 0.65 | 8 |
| 15 | 19 | 11 | 0.25 | 2 |
| 16 | 19 | 11 | 0.65 | 8 |
Step-by-Step Workflow
1
Preview the design
$ doe info --config use_cases/129_home_insulation/config.json
2
Generate the runner script
$ doe generate --config use_cases/129_home_insulation/config.json \
--output use_cases/129_home_insulation/results/run.sh --seed 42
3
Execute the experiments
$ bash use_cases/129_home_insulation/results/run.sh
4
Analyze results
$ doe analyze --config use_cases/129_home_insulation/config.json
5
Get optimization recommendations
$ doe optimize --config use_cases/129_home_insulation/config.json
6
Multi-objective optimization
With 2 competing responses, use --multi to find the best compromise via Derringer–Suich desirability.
$ doe optimize --config use_cases/129_home_insulation/config.json --multi
7
Generate the HTML report
$ doe report --config use_cases/129_home_insulation/config.json \
--output use_cases/129_home_insulation/results/report.html
Features Exercised
| Feature | Value |
|---|
| Design type | full_factorial |
| Factor types | continuous (all 4) |
| Arg style | double-dash |
| Responses | 2 (annual_heat_cost ↓, comfort_score ↑) |
| Total runs | 16 |
Analysis Results
Generated from actual experiment runs using the DOE Helper Tool.
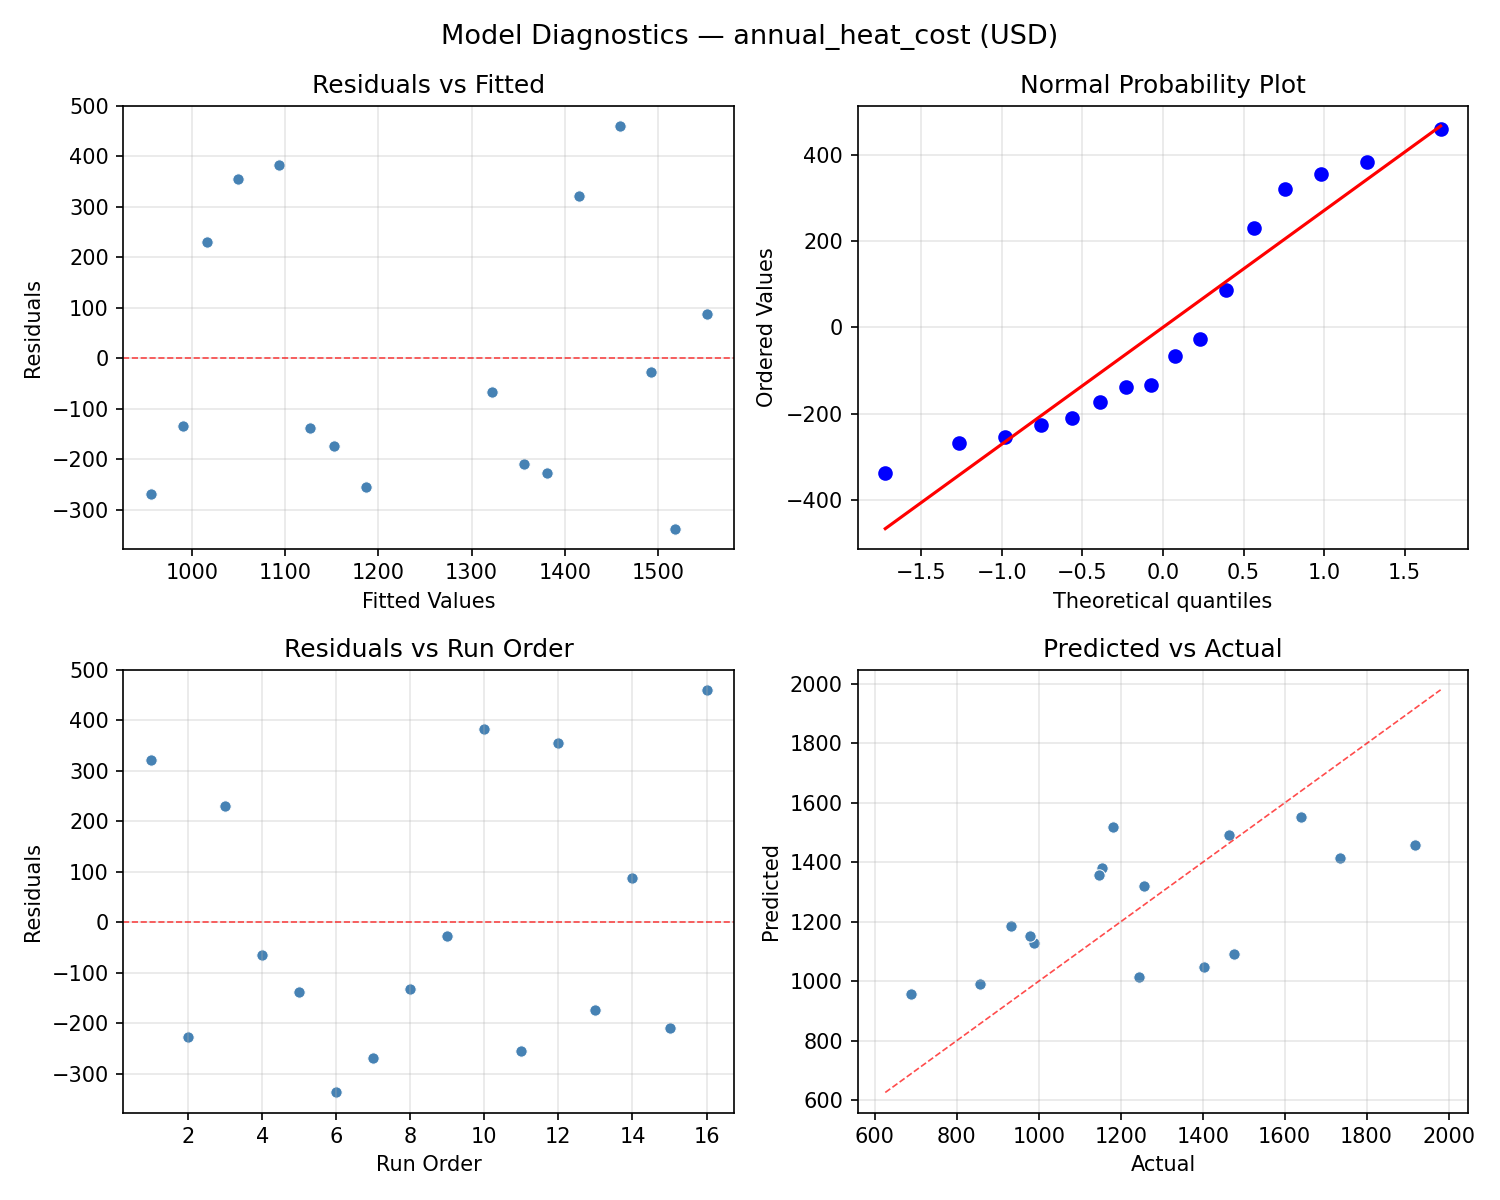
Response: annual_heat_cost
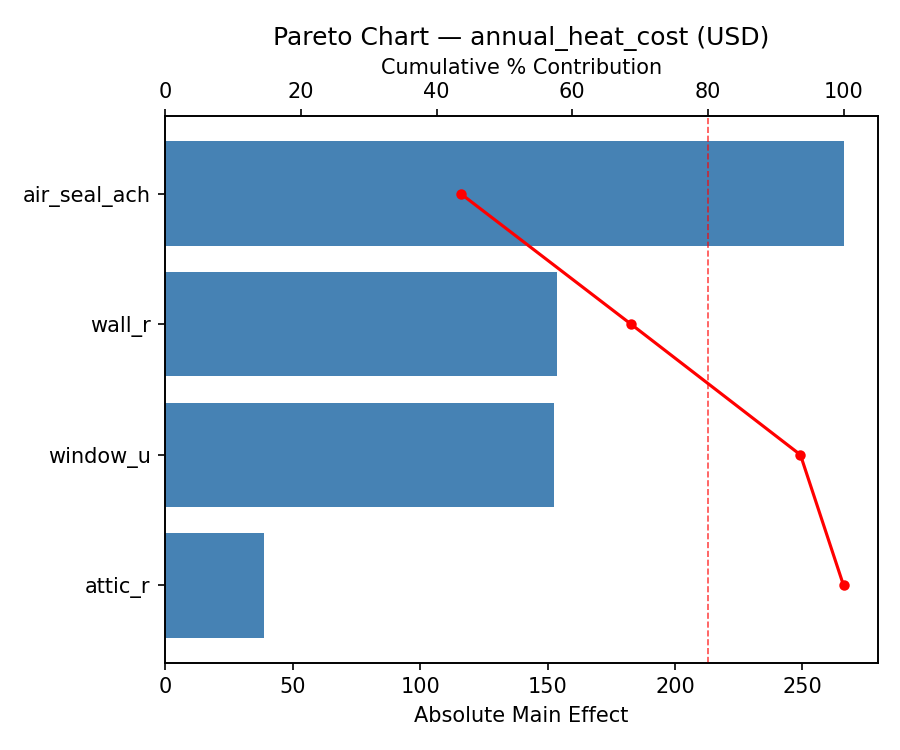
Top factors: window_u (37.7%), wall_r (28.3%), air_seal_ach (22.7%).
ANOVA
| Source | DF | SS | MS | F | p-value |
|---|
| Source | DF | SS | MS | F | p-value |
| attic_r | 1 | 27307.5625 | 27307.5625 | 0.138 | 0.7257 |
| wall_r | 1 | 170362.5625 | 170362.5625 | 0.860 | 0.3963 |
| window_u | 1 | 303876.5625 | 303876.5625 | 1.534 | 0.2705 |
| air_seal_ach | 1 | 110058.0625 | 110058.0625 | 0.556 | 0.4896 |
| attic_r*wall_r | 1 | 1072.5625 | 1072.5625 | 0.005 | 0.9442 |
| attic_r*window_u | 1 | 16320.0625 | 16320.0625 | 0.082 | 0.7856 |
| attic_r*air_seal_ach | 1 | 189.0625 | 189.0625 | 0.001 | 0.9766 |
| wall_r*window_u | 1 | 15562.5625 | 15562.5625 | 0.079 | 0.7905 |
| wall_r*air_seal_ach | 1 | 46764.0625 | 46764.0625 | 0.236 | 0.6476 |
| window_u*air_seal_ach | 1 | 12712.5625 | 12712.5625 | 0.064 | 0.8101 |
| Error | 5 | 990563.3125 | 198112.6625 | | |
| Total | 15 | 1694788.9375 | 112985.9292 | | |
Pareto Chart
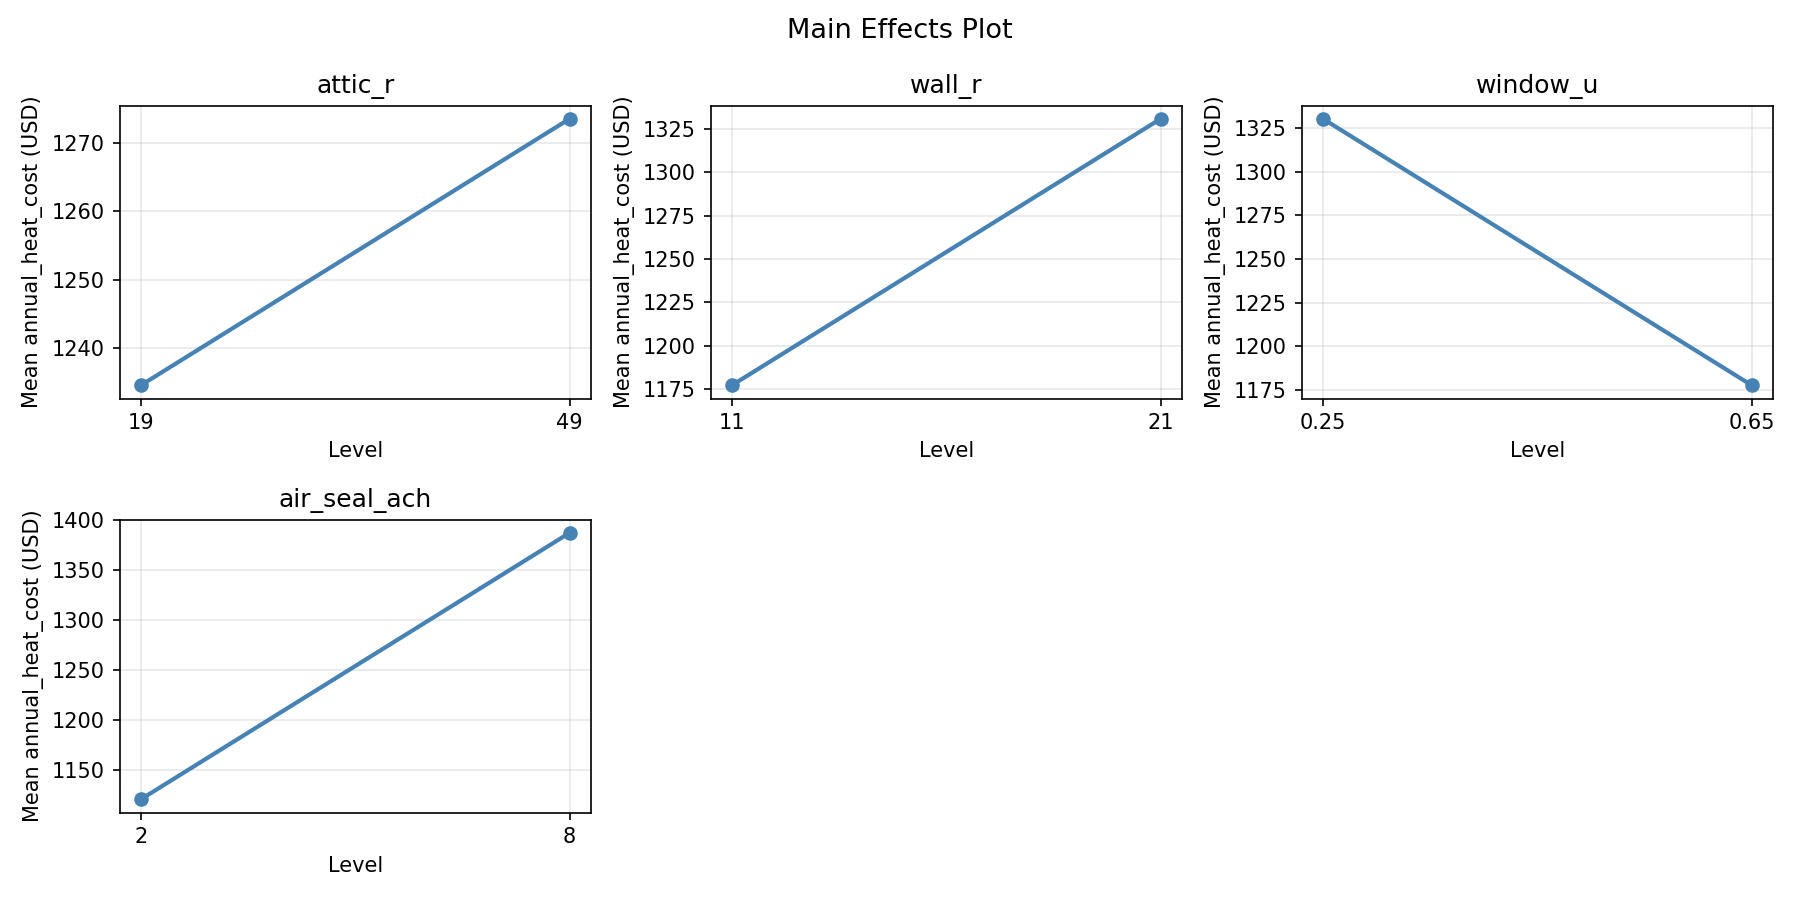
Main Effects Plot
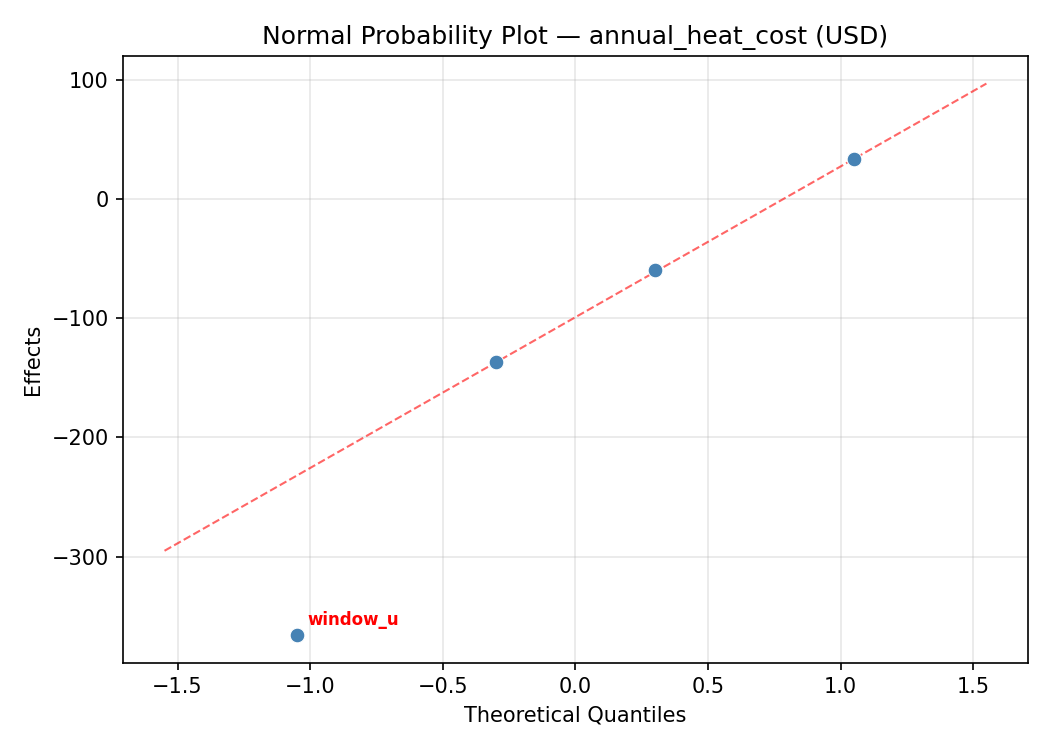
Normal Probability Plot of Effects
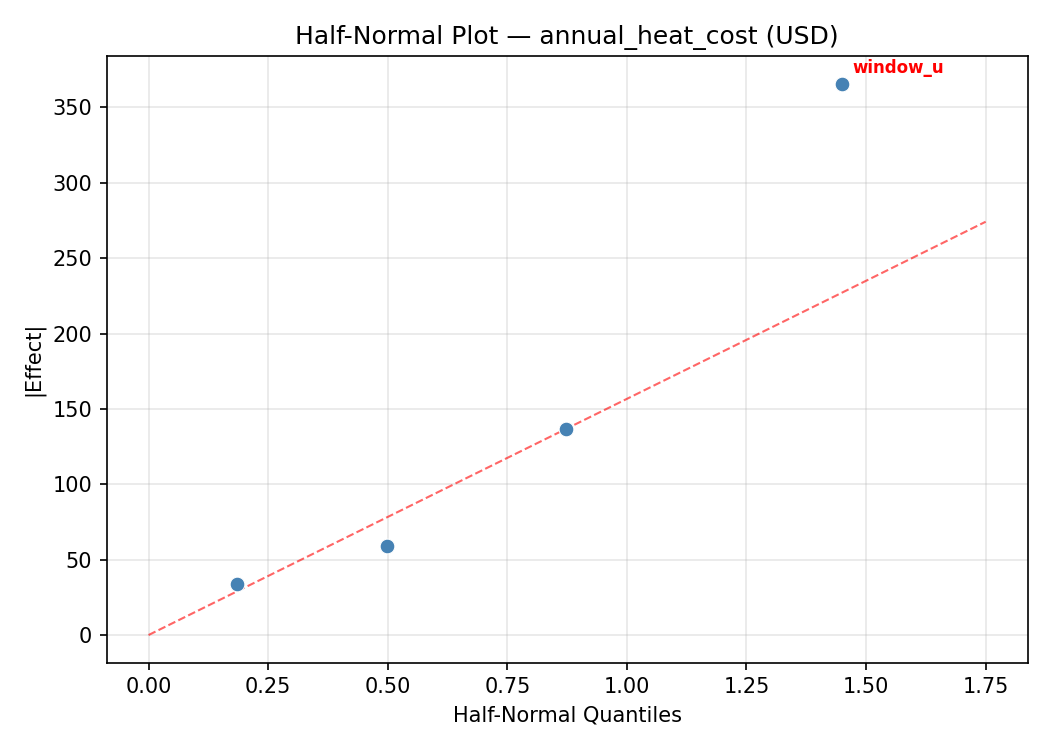
Half-Normal Plot of Effects
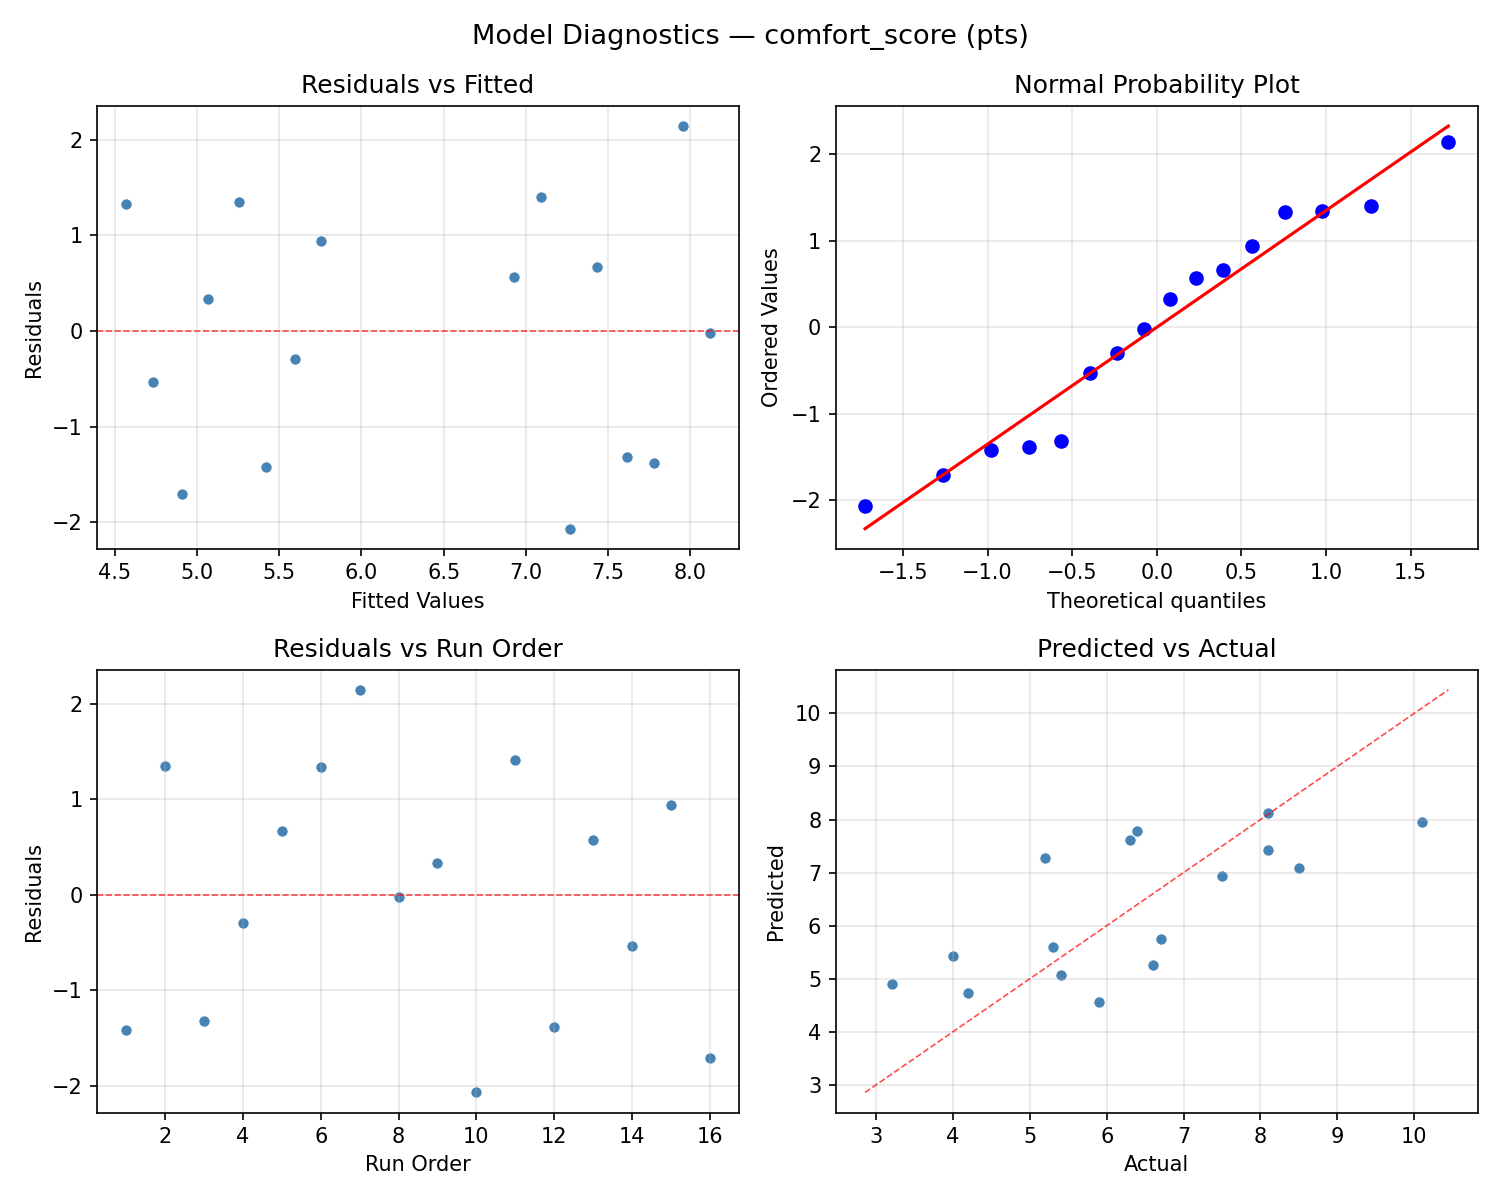
Model Diagnostics
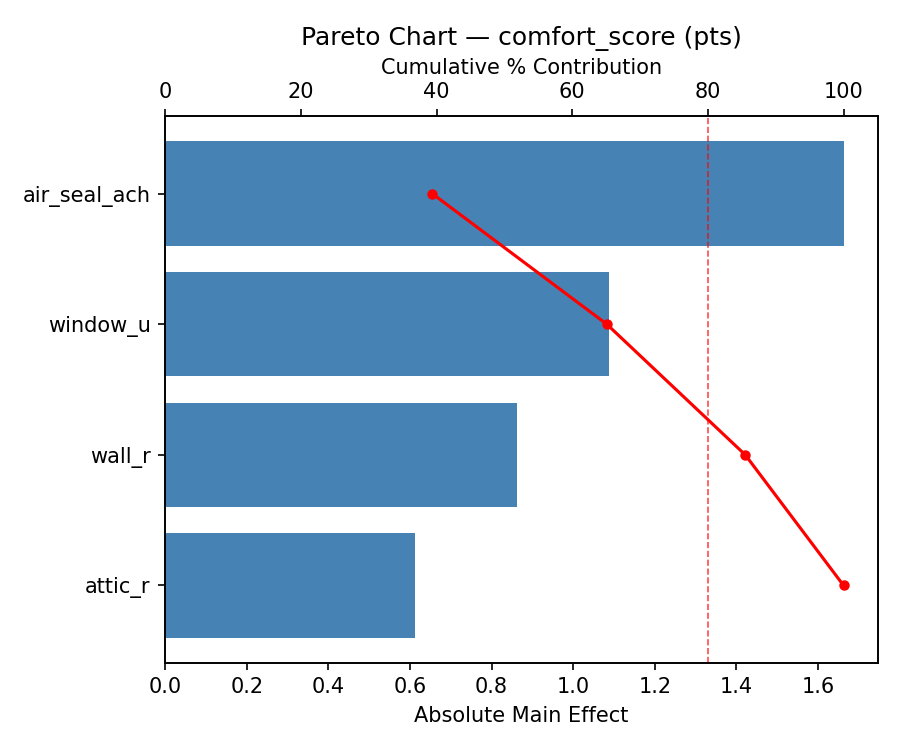
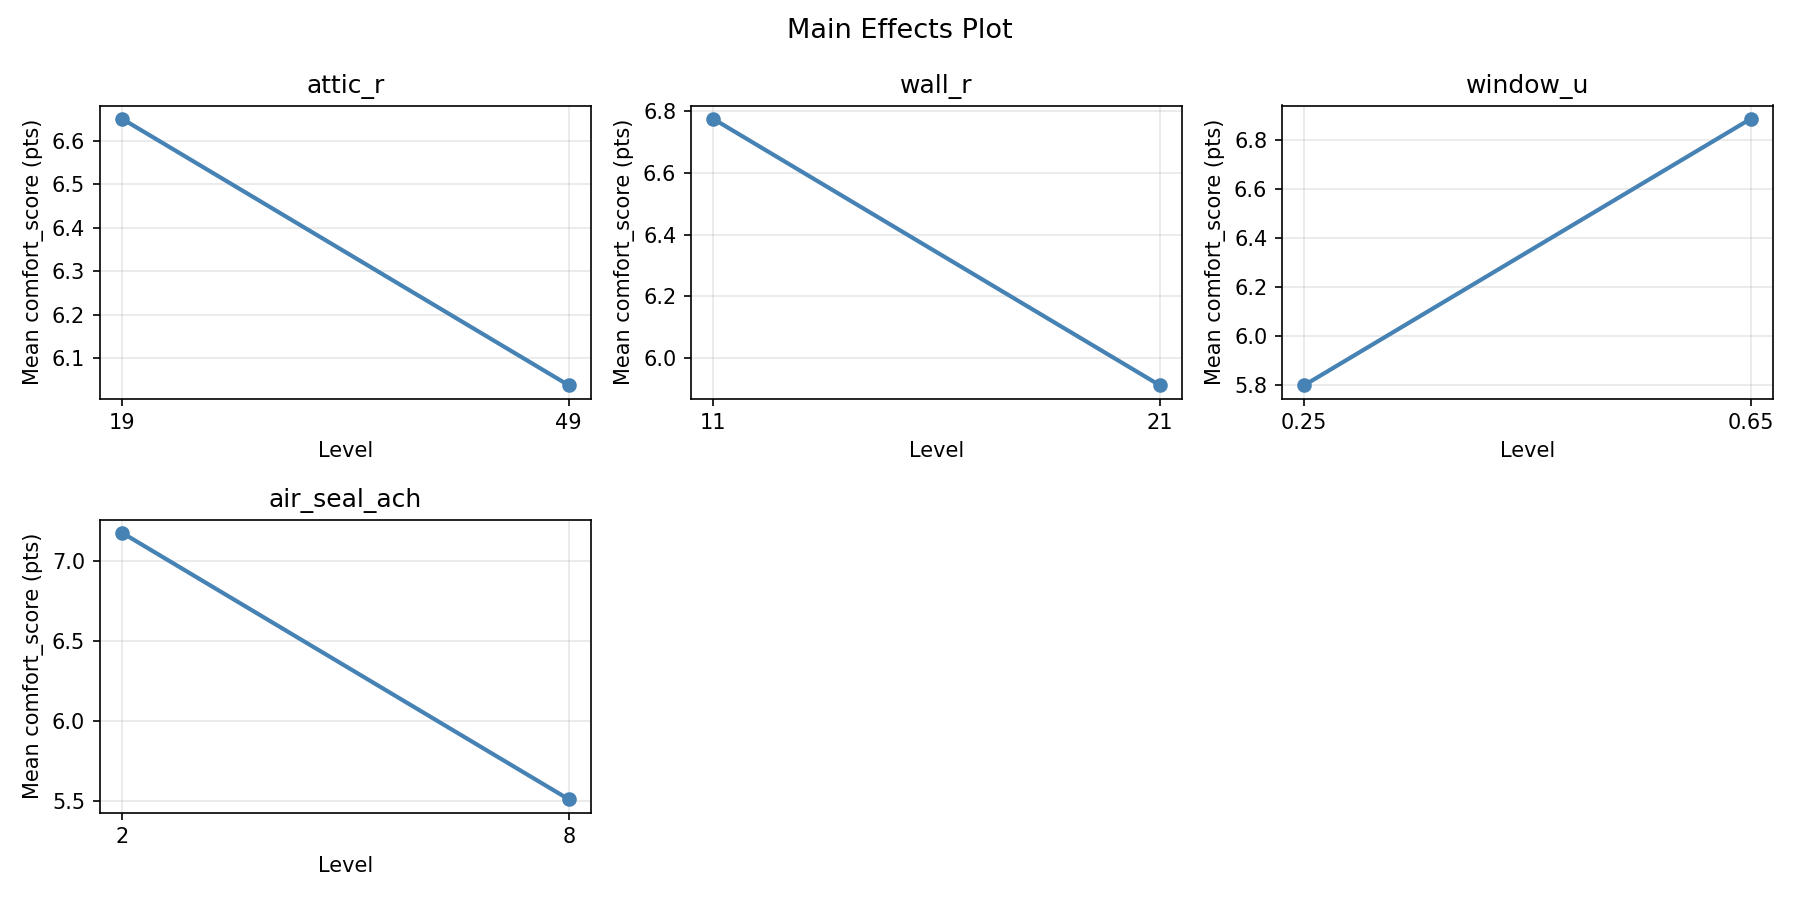
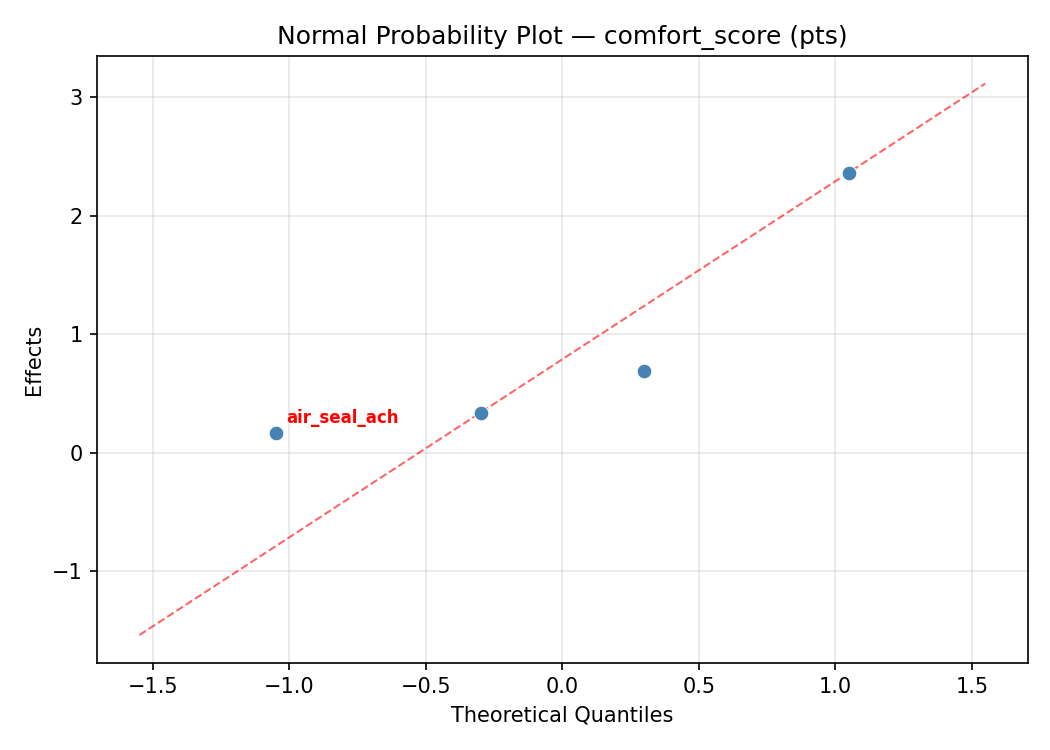
Response: comfort_score
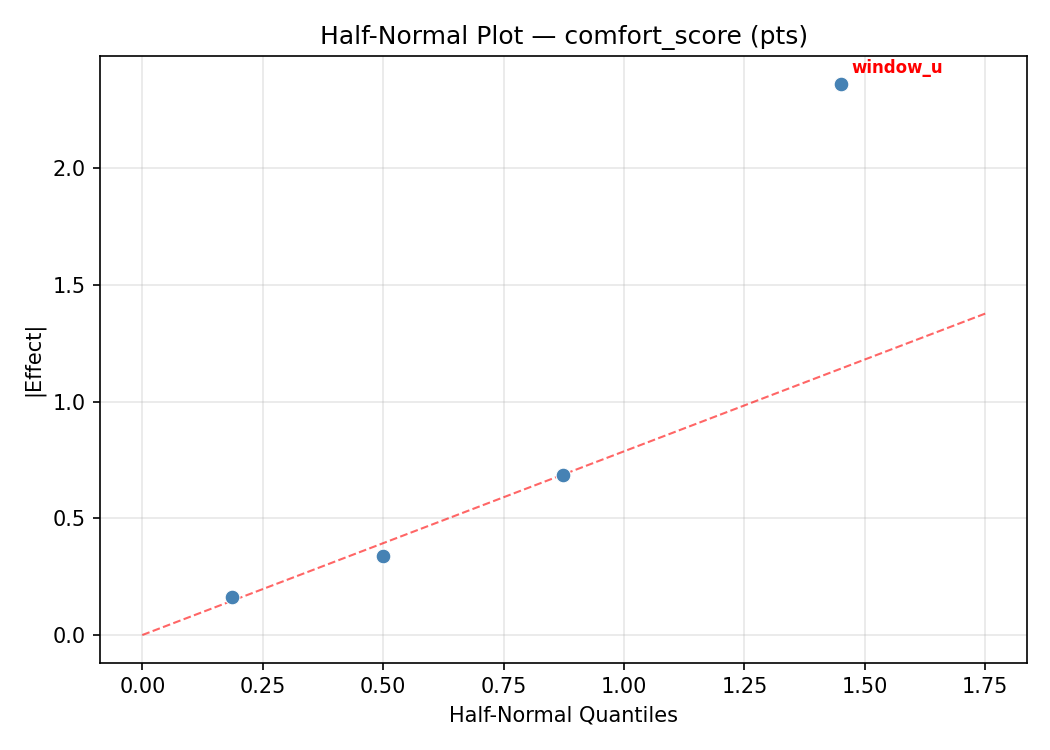
Top factors: window_u (40.4%), wall_r (32.8%), attic_r (18.8%).
ANOVA
| Source | DF | SS | MS | F | p-value |
|---|
| Source | DF | SS | MS | F | p-value |
| attic_r | 1 | 2.1756 | 2.1756 | 0.398 | 0.5556 |
| wall_r | 1 | 6.6306 | 6.6306 | 1.214 | 0.3207 |
| window_u | 1 | 10.0806 | 10.0806 | 1.846 | 0.2323 |
| air_seal_ach | 1 | 0.3906 | 0.3906 | 0.072 | 0.7998 |
| attic_r*wall_r | 1 | 0.0756 | 0.0756 | 0.014 | 0.9109 |
| attic_r*window_u | 1 | 0.2256 | 0.2256 | 0.041 | 0.8469 |
| attic_r*air_seal_ach | 1 | 0.1806 | 0.1806 | 0.033 | 0.8628 |
| wall_r*window_u | 1 | 0.2256 | 0.2256 | 0.041 | 0.8469 |
| wall_r*air_seal_ach | 1 | 2.1756 | 2.1756 | 0.398 | 0.5556 |
| window_u*air_seal_ach | 1 | 0.4556 | 0.4556 | 0.083 | 0.7843 |
| Error | 5 | 27.3031 | 5.4606 | | |
| Total | 15 | 49.9194 | 3.3280 | | |
Pareto Chart
Main Effects Plot
Normal Probability Plot of Effects
Half-Normal Plot of Effects
Model Diagnostics
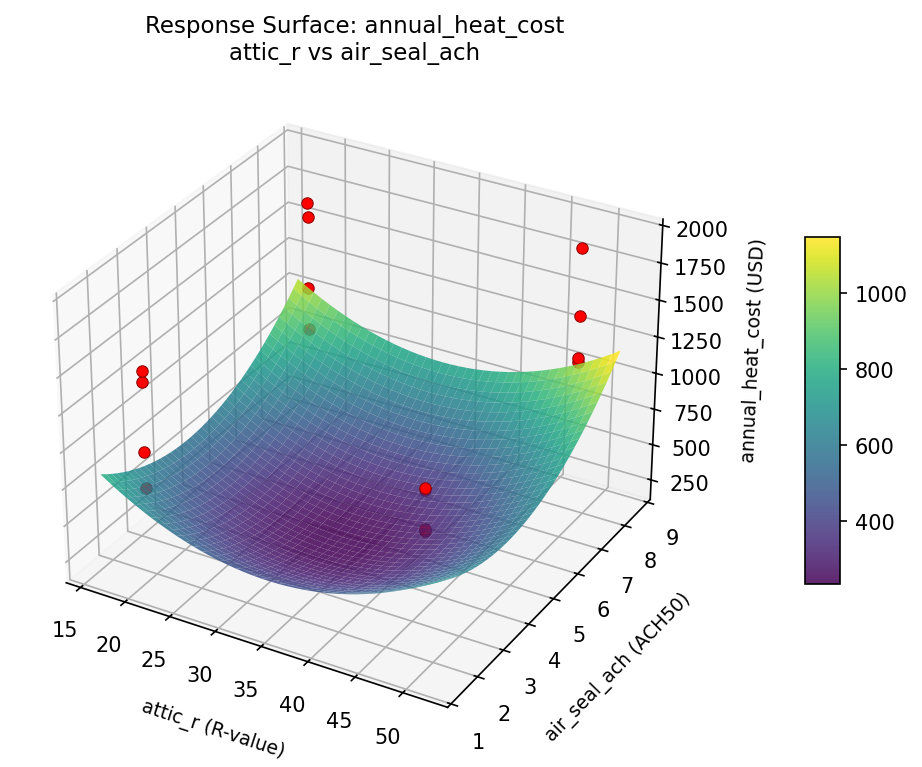
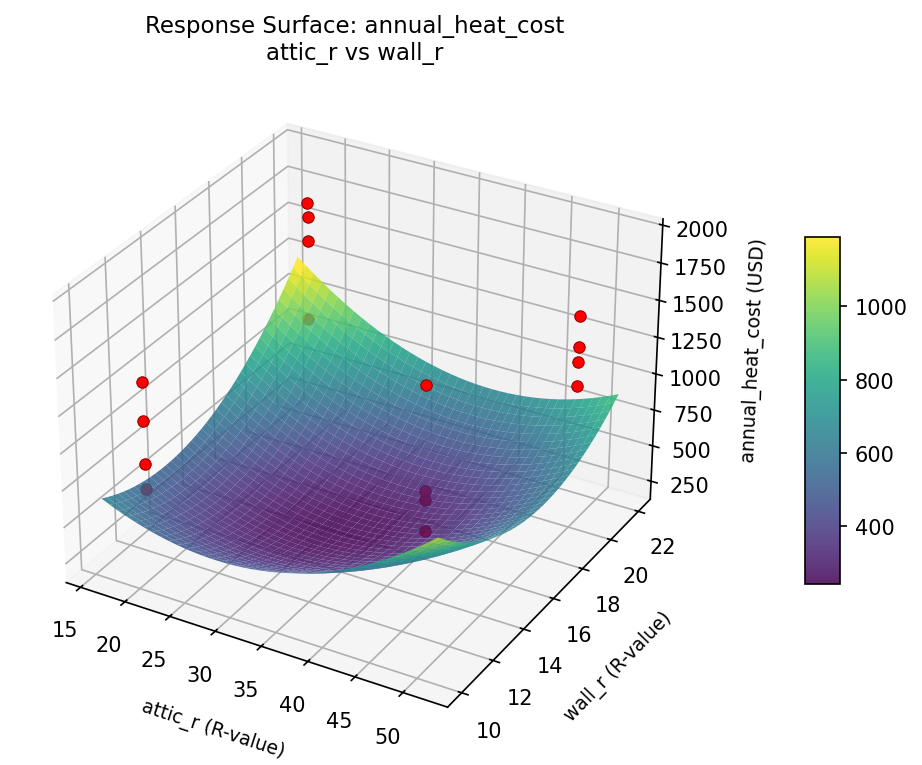
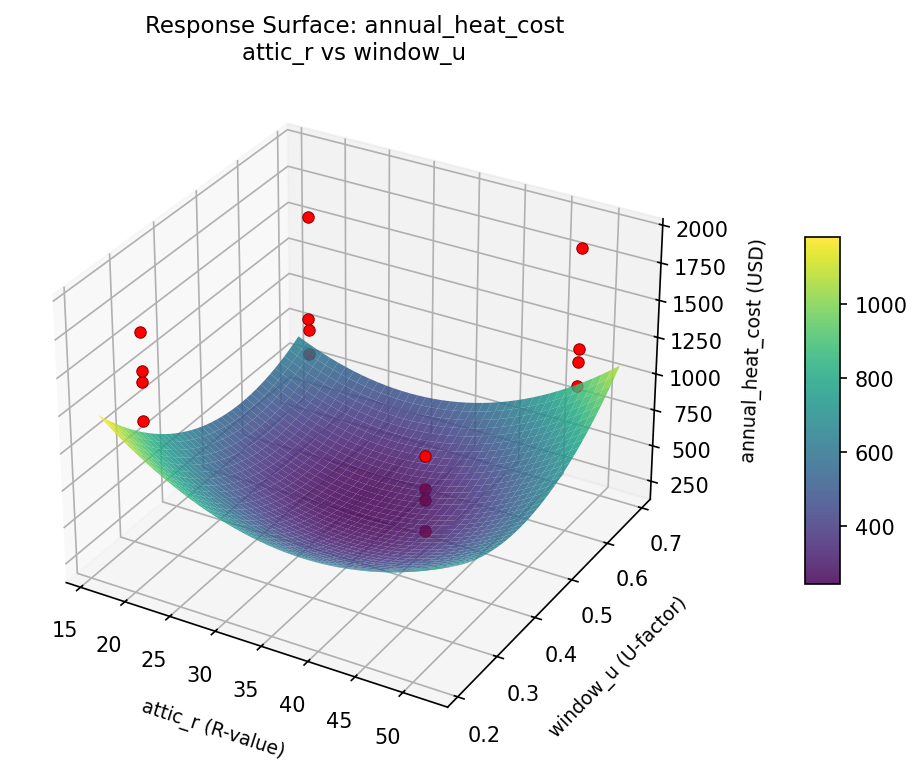
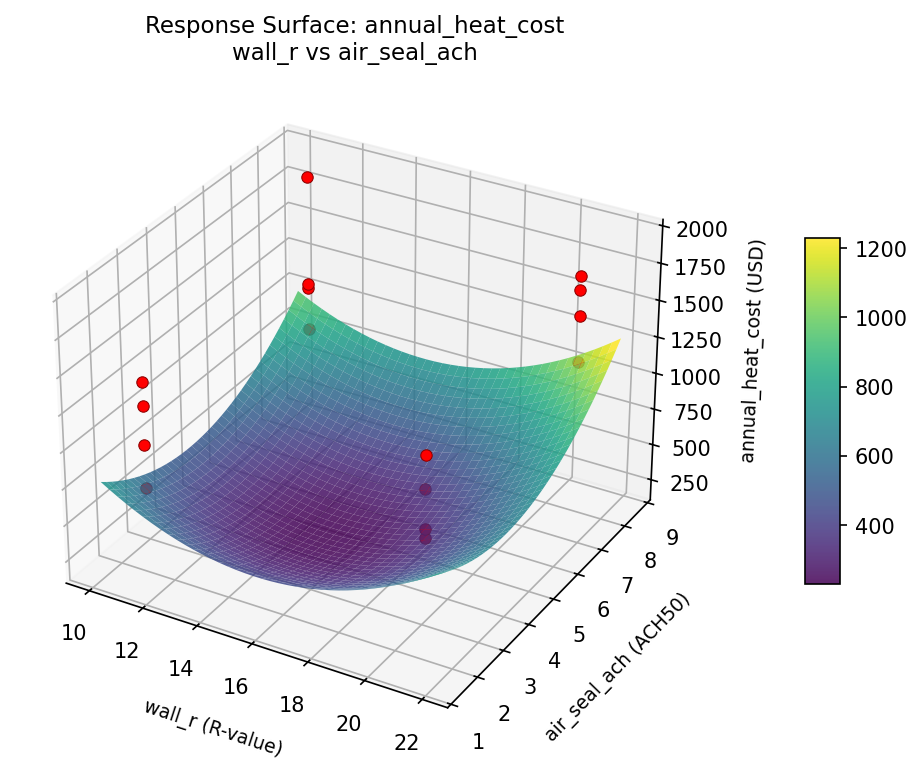
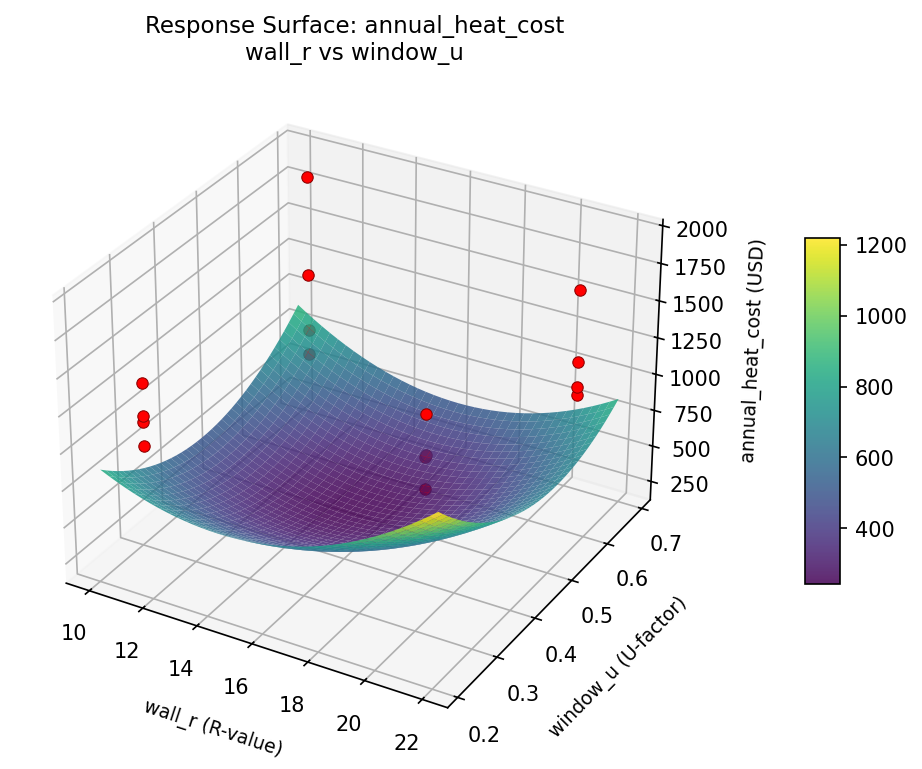
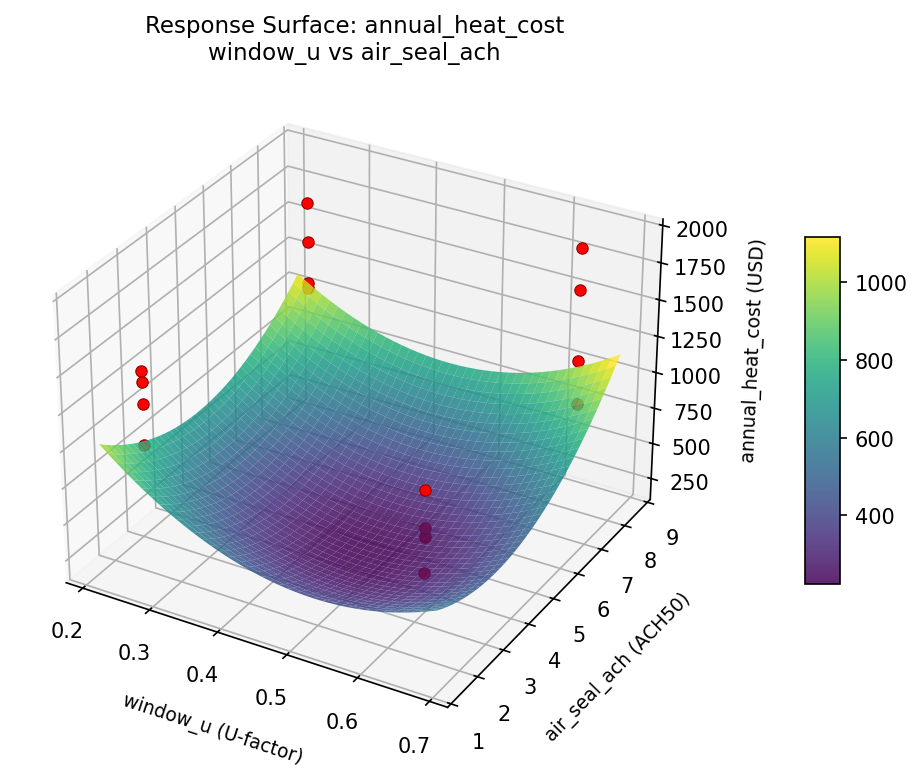
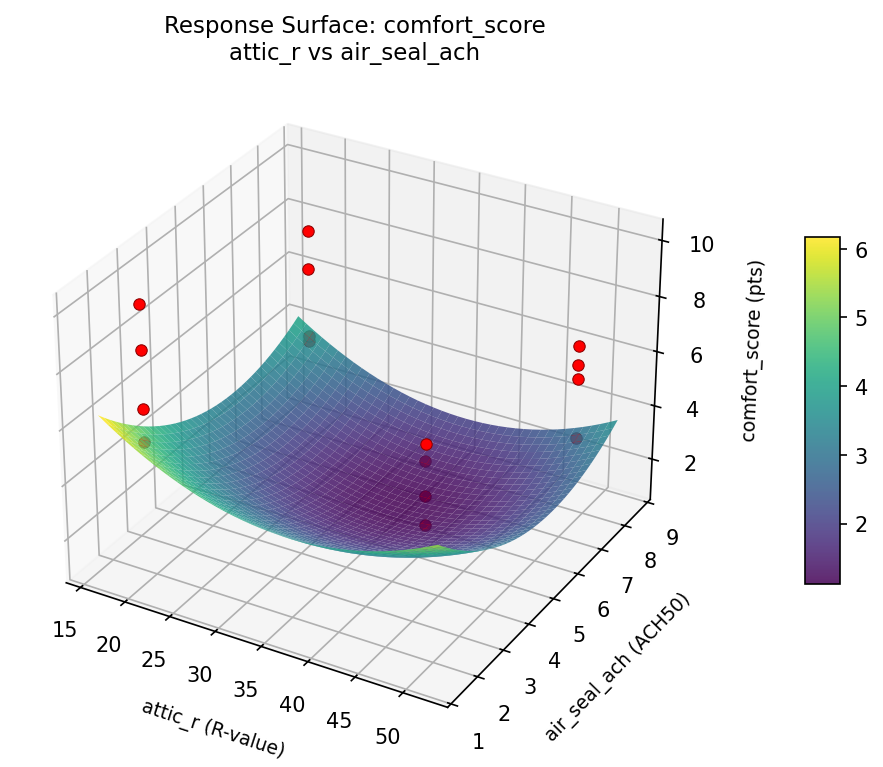
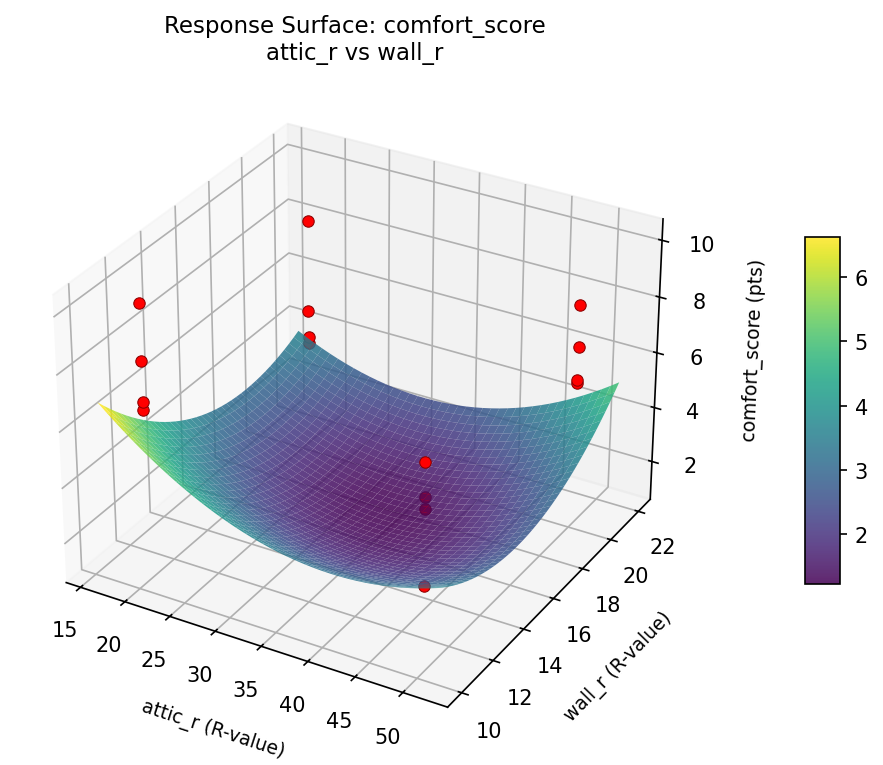
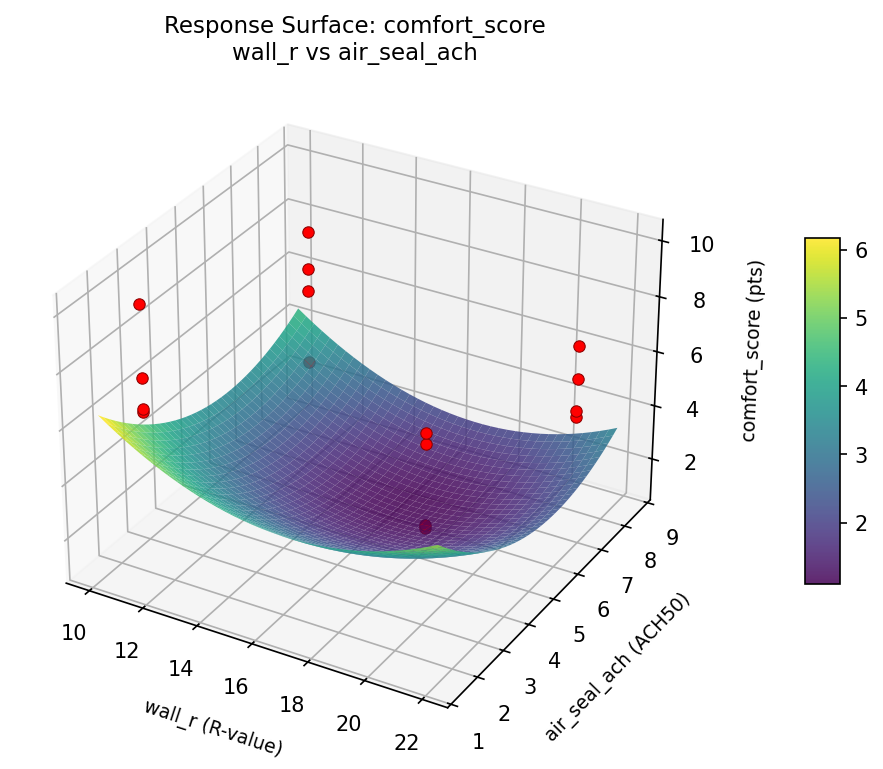
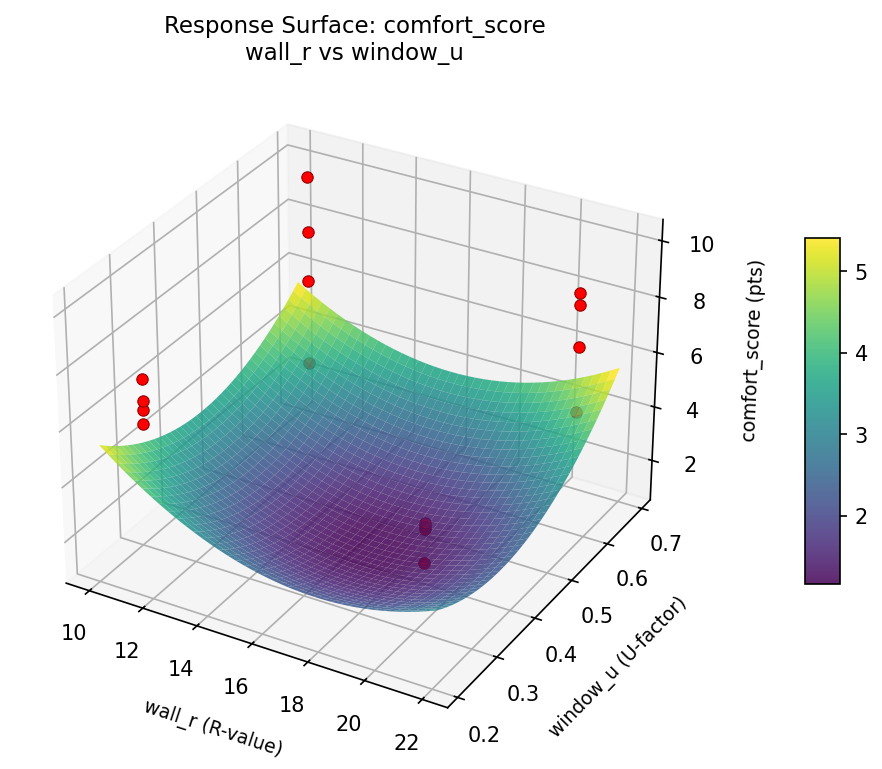
Response Surface Plots
3D surfaces fitted with quadratic RSM. Red dots are observed data points.
annual heat cost attic r vs air seal ach
annual heat cost attic r vs wall r
annual heat cost attic r vs window u
annual heat cost wall r vs air seal ach
annual heat cost wall r vs window u
annual heat cost window u vs air seal ach
comfort score attic r vs air seal ach
comfort score attic r vs wall r
comfort score attic r vs window u

comfort score wall r vs air seal ach
comfort score wall r vs window u
comfort score window u vs air seal ach
Multi-Objective Optimization
When responses compete, Derringer–Suich desirability finds the best compromise.
Each response is scaled to a 0–1 desirability, then combined via a weighted geometric mean.
Overall Desirability
D = 0.9545
Per-Response Desirability
| Response | Weight | Desirability | Predicted | Dir |
|---|
annual_heat_cost |
1.0 |
|
687.00 0.9545 687.00 USD |
↓ |
comfort_score |
1.5 |
|
10.10 0.9545 10.10 pts |
↑ |
Recommended Settings
| Factor | Value |
|---|
attic_r | 49 R-value |
wall_r | 11 R-value |
window_u | 0.65 U-factor |
air_seal_ach | 8 ACH50 |
Source: from observed run #7
Trade-off Summary
Sacrifice = how much worse than single-objective best.
| Response | Predicted | Best Observed | Sacrifice |
|---|
comfort_score | 10.10 | 10.10 | +0.00 |
Top 3 Runs by Desirability
| Run | D | Factor Settings |
|---|
| #11 | 0.7556 | attic_r=19, wall_r=11, window_u=0.65, air_seal_ach=8 |
| #8 | 0.7433 | attic_r=49, wall_r=21, window_u=0.25, air_seal_ach=8 |
Model Quality
| Response | R² | Type |
|---|
comfort_score | 0.2413 | linear |
Full Multi-Objective Output
============================================================
MULTI-OBJECTIVE OPTIMIZATION
Method: Derringer-Suich Desirability Function
============================================================
Overall desirability: D = 0.9545
Response Weight Desirability Predicted Direction
---------------------------------------------------------------------
annual_heat_cost 1.0 0.9545 687.00 USD ↓
comfort_score 1.5 0.9545 10.10 pts ↑
Recommended settings:
attic_r = 49 R-value
wall_r = 11 R-value
window_u = 0.65 U-factor
air_seal_ach = 8 ACH50
(from observed run #7)
Trade-off summary:
annual_heat_cost: 687.00 (best observed: 687.00, sacrifice: +0.00)
comfort_score: 10.10 (best observed: 10.10, sacrifice: +0.00)
Model quality:
annual_heat_cost: R² = 0.2709 (linear)
comfort_score: R² = 0.2413 (linear)
Top 3 observed runs by overall desirability:
1. Run #7 (D=0.9545): attic_r=49, wall_r=11, window_u=0.65, air_seal_ach=8
2. Run #11 (D=0.7556): attic_r=19, wall_r=11, window_u=0.65, air_seal_ach=8
3. Run #8 (D=0.7433): attic_r=49, wall_r=21, window_u=0.25, air_seal_ach=8
Full Analysis Output
=== Main Effects: annual_heat_cost ===
Factor Effect Std Error % Contribution
--------------------------------------------------------------
window_u 275.6250 84.0334 37.7%
wall_r -206.3750 84.0334 28.3%
air_seal_ach -165.8750 84.0334 22.7%
attic_r 82.6250 84.0334 11.3%
=== ANOVA Table: annual_heat_cost ===
Source DF SS MS F p-value
-----------------------------------------------------------------------------
attic_r 1 27307.5625 27307.5625 0.138 0.7257
wall_r 1 170362.5625 170362.5625 0.860 0.3963
window_u 1 303876.5625 303876.5625 1.534 0.2705
air_seal_ach 1 110058.0625 110058.0625 0.556 0.4896
attic_r*wall_r 1 1072.5625 1072.5625 0.005 0.9442
attic_r*window_u 1 16320.0625 16320.0625 0.082 0.7856
attic_r*air_seal_ach 1 189.0625 189.0625 0.001 0.9766
wall_r*window_u 1 15562.5625 15562.5625 0.079 0.7905
wall_r*air_seal_ach 1 46764.0625 46764.0625 0.236 0.6476
window_u*air_seal_ach 1 12712.5625 12712.5625 0.064 0.8101
Error 5 990563.3125 198112.6625
Total 15 1694788.9375 112985.9292
=== Interaction Effects: annual_heat_cost ===
Factor A Factor B Interaction % Contribution
------------------------------------------------------------------------
wall_r air_seal_ach 108.1250 34.4%
attic_r window_u -63.8750 20.3%
wall_r window_u -62.3750 19.9%
window_u air_seal_ach -56.3750 18.0%
attic_r wall_r -16.3750 5.2%
attic_r air_seal_ach -6.8750 2.2%
=== Summary Statistics: annual_heat_cost ===
attic_r:
Level N Mean Std Min Max
------------------------------------------------------------
19 8 1212.7500 362.3738 857.0000 1919.0000
49 8 1295.3750 326.9508 687.0000 1736.0000
wall_r:
Level N Mean Std Min Max
------------------------------------------------------------
11 8 1357.2500 362.8682 857.0000 1919.0000
21 8 1150.8750 293.4311 687.0000 1639.0000
window_u:
Level N Mean Std Min Max
------------------------------------------------------------
0.25 8 1116.2500 333.1151 687.0000 1736.0000
0.65 8 1391.8750 296.2028 989.0000 1919.0000
air_seal_ach:
Level N Mean Std Min Max
------------------------------------------------------------
2 8 1337.0000 444.6517 687.0000 1919.0000
8 8 1171.1250 169.3369 932.0000 1476.0000
=== Main Effects: comfort_score ===
Factor Effect Std Error % Contribution
--------------------------------------------------------------
window_u -1.5875 0.4561 40.4%
wall_r 1.2875 0.4561 32.8%
attic_r -0.7375 0.4561 18.8%
air_seal_ach 0.3125 0.4561 8.0%
=== ANOVA Table: comfort_score ===
Source DF SS MS F p-value
-----------------------------------------------------------------------------
attic_r 1 2.1756 2.1756 0.398 0.5556
wall_r 1 6.6306 6.6306 1.214 0.3207
window_u 1 10.0806 10.0806 1.846 0.2323
air_seal_ach 1 0.3906 0.3906 0.072 0.7998
attic_r*wall_r 1 0.0756 0.0756 0.014 0.9109
attic_r*window_u 1 0.2256 0.2256 0.041 0.8469
attic_r*air_seal_ach 1 0.1806 0.1806 0.033 0.8628
wall_r*window_u 1 0.2256 0.2256 0.041 0.8469
wall_r*air_seal_ach 1 2.1756 2.1756 0.398 0.5556
window_u*air_seal_ach 1 0.4556 0.4556 0.083 0.7843
Error 5 27.3031 5.4606
Total 15 49.9194 3.3280
=== Interaction Effects: comfort_score ===
Factor A Factor B Interaction % Contribution
------------------------------------------------------------------------
wall_r air_seal_ach -0.7375 38.8%
window_u air_seal_ach 0.3375 17.8%
attic_r window_u 0.2375 12.5%
wall_r window_u -0.2375 12.5%
attic_r air_seal_ach -0.2125 11.2%
attic_r wall_r -0.1375 7.2%
=== Summary Statistics: comfort_score ===
attic_r:
Level N Mean Std Min Max
------------------------------------------------------------
19 8 6.7125 1.7884 3.2000 8.5000
49 8 5.9750 1.9032 4.0000 10.1000
wall_r:
Level N Mean Std Min Max
------------------------------------------------------------
11 8 5.7000 1.6423 3.2000 8.1000
21 8 6.9875 1.8673 4.2000 10.1000
window_u:
Level N Mean Std Min Max
------------------------------------------------------------
0.25 8 7.1375 1.8477 4.0000 10.1000
0.65 8 5.5500 1.5090 3.2000 8.1000
air_seal_ach:
Level N Mean Std Min Max
------------------------------------------------------------
2 8 6.1875 2.4186 3.2000 10.1000
8 8 6.5000 1.1071 5.2000 8.5000
Optimization Recommendations
=== Optimization: annual_heat_cost ===
Direction: minimize
Best observed run: #7
attic_r = 49
wall_r = 11
window_u = 0.65
air_seal_ach = 8
Value: 687.0
RSM Model (linear, R² = 0.0349, Adj R² = -0.3160):
Coefficients:
intercept +1254.0625
attic_r -29.3125
wall_r +47.5625
window_u +22.6875
air_seal_ach -7.9375
RSM Model (quadratic, R² = 0.4240, Adj R² = -7.6405):
Coefficients:
intercept +250.8125
attic_r -29.3125
wall_r +47.5625
window_u +22.6875
air_seal_ach -7.9375
attic_r*wall_r -28.3125
attic_r*window_u +124.5625
attic_r*air_seal_ach -21.0625
wall_r*window_u +25.1875
wall_r*air_seal_ach +154.3125
window_u*air_seal_ach -1.0625
attic_r^2 +250.8125
wall_r^2 +250.8125
window_u^2 +250.8125
air_seal_ach^2 +250.8125
Curvature analysis:
wall_r coef=+250.8125 convex (has a minimum)
window_u coef=+250.8125 convex (has a minimum)
air_seal_ach coef=+250.8125 convex (has a minimum)
attic_r coef=+250.8125 convex (has a minimum)
Notable interactions:
wall_r*air_seal_ach coef=+154.3125 (synergistic)
attic_r*window_u coef=+124.5625 (synergistic)
attic_r*wall_r coef=-28.3125 (antagonistic)
wall_r*window_u coef=+25.1875 (synergistic)
attic_r*air_seal_ach coef=-21.0625 (antagonistic)
window_u*air_seal_ach coef=-1.0625 (antagonistic)
Predicted optimum (from linear model, at observed points):
attic_r = 19
wall_r = 21
window_u = 0.65
air_seal_ach = 2
Predicted value: 1361.5625
Surface optimum (via L-BFGS-B, linear model):
attic_r = 49
wall_r = 11
window_u = 0.25
air_seal_ach = 8
Predicted value: 1146.5625
Model quality: Weak fit — consider adding center points or using a different design.
Factor importance:
1. wall_r (effect: 95.1, contribution: 44.2%)
2. attic_r (effect: -58.6, contribution: 27.3%)
3. window_u (effect: 45.4, contribution: 21.1%)
4. air_seal_ach (effect: -15.9, contribution: 7.4%)
=== Optimization: comfort_score ===
Direction: maximize
Best observed run: #7
attic_r = 49
wall_r = 11
window_u = 0.65
air_seal_ach = 8
Value: 10.1
RSM Model (linear, R² = 0.0568, Adj R² = -0.2861):
Coefficients:
intercept +6.3438
attic_r +0.2687
wall_r -0.2438
window_u +0.1313
air_seal_ach +0.1687
RSM Model (quadratic, R² = 0.4707, Adj R² = -6.9397):
Coefficients:
intercept +1.2688
attic_r +0.2687
wall_r -0.2437
window_u +0.1312
air_seal_ach +0.1688
attic_r*wall_r +0.1063
attic_r*window_u -0.7438
attic_r*air_seal_ach +0.2438
wall_r*window_u -0.4313
wall_r*air_seal_ach -0.6937
window_u*air_seal_ach +0.0062
attic_r^2 +1.2688
wall_r^2 +1.2688
window_u^2 +1.2688
air_seal_ach^2 +1.2688
Curvature analysis:
attic_r coef=+1.2688 convex (has a minimum)
window_u coef=+1.2688 convex (has a minimum)
air_seal_ach coef=+1.2688 convex (has a minimum)
wall_r coef=+1.2688 convex (has a minimum)
Notable interactions:
attic_r*window_u coef=-0.7438 (antagonistic)
wall_r*air_seal_ach coef=-0.6937 (antagonistic)
wall_r*window_u coef=-0.4313 (antagonistic)
Predicted optimum (from linear model, at observed points):
attic_r = 49
wall_r = 11
window_u = 0.65
air_seal_ach = 8
Predicted value: 7.1563
Surface optimum (via L-BFGS-B, linear model):
attic_r = 49
wall_r = 11
window_u = 0.65
air_seal_ach = 8
Predicted value: 7.1563
Model quality: Weak fit — consider adding center points or using a different design.
Factor importance:
1. attic_r (effect: 0.5, contribution: 33.1%)
2. wall_r (effect: -0.5, contribution: 30.0%)
3. air_seal_ach (effect: 0.3, contribution: 20.8%)
4. window_u (effect: 0.3, contribution: 16.2%)