Summary
This experiment investigates water heater efficiency. Plackett-Burman screening of thermostat setting, tank insulation, pipe insulation, recirculation timer, and inlet temperature for energy savings and hot water availability.
The design varies 5 factors: thermostat c (C), ranging from 48 to 65, tank r value (R-value), ranging from 6 to 18, pipe insulation (bool), ranging from 0 to 1, recirc timer (bool), ranging from 0 to 1, and inlet temp c (C), ranging from 5 to 20. The goal is to optimize 2 responses: monthly kwh (kWh) (minimize) and availability pct (%) (maximize). Fixed conditions held constant across all runs include tank size L = 200, household size = 4.
A Plackett-Burman screening design was used to efficiently test 5 factors in only 8 runs. This design assumes interactions are negligible and focuses on identifying the most influential main effects.
Key Findings
For monthly kwh, the most influential factors were inlet temp c (37.1%), pipe insulation (28.7%), tank r value (24.5%). The best observed value was 290.0 (at thermostat c = 48, tank r value = 18, pipe insulation = 0).
For availability pct, the most influential factors were recirc timer (44.1%), tank r value (26.9%), pipe insulation (16.1%). The best observed value was 100.0 (at thermostat c = 48, tank r value = 6, pipe insulation = 1).
Recommended Next Steps
- Follow up with a response surface design (CCD or Box-Behnken) on the top 3–4 factors to model curvature and find the true optimum.
- Consider whether any fixed factors should be varied in a future study.
- The screening results can guide factor reduction — drop factors contributing less than 5% and re-run with a smaller, more focused design.
Experimental Setup
Factors
| Factor | Low | High | Unit |
|---|
thermostat_c | 48 | 65 | C |
tank_r_value | 6 | 18 | R-value |
pipe_insulation | 0 | 1 | bool |
recirc_timer | 0 | 1 | bool |
inlet_temp_c | 5 | 20 | C |
Fixed: tank_size_L = 200, household_size = 4
Responses
| Response | Direction | Unit |
|---|
monthly_kwh | ↓ minimize | kWh |
availability_pct | ↑ maximize | % |
Configuration
{
"metadata": {
"name": "Water Heater Efficiency",
"description": "Plackett-Burman screening of thermostat setting, tank insulation, pipe insulation, recirculation timer, and inlet temperature for energy savings and hot water availability"
},
"factors": [
{
"name": "thermostat_c",
"levels": [
"48",
"65"
],
"type": "continuous",
"unit": "C"
},
{
"name": "tank_r_value",
"levels": [
"6",
"18"
],
"type": "continuous",
"unit": "R-value"
},
{
"name": "pipe_insulation",
"levels": [
"0",
"1"
],
"type": "continuous",
"unit": "bool"
},
{
"name": "recirc_timer",
"levels": [
"0",
"1"
],
"type": "continuous",
"unit": "bool"
},
{
"name": "inlet_temp_c",
"levels": [
"5",
"20"
],
"type": "continuous",
"unit": "C"
}
],
"fixed_factors": {
"tank_size_L": "200",
"household_size": "4"
},
"responses": [
{
"name": "monthly_kwh",
"optimize": "minimize",
"unit": "kWh"
},
{
"name": "availability_pct",
"optimize": "maximize",
"unit": "%"
}
],
"settings": {
"operation": "plackett_burman",
"test_script": "use_cases/132_water_heater_efficiency/sim.sh"
}
}
Experimental Matrix
The Plackett-Burman Design produces 8 runs. Each row is one experiment with specific factor settings.
| Run | thermostat_c | tank_r_value | pipe_insulation | recirc_timer | inlet_temp_c |
|---|
| 1 | 65 | 18 | 1 | 0 | 5 |
| 2 | 48 | 6 | 1 | 1 | 5 |
| 3 | 48 | 18 | 0 | 1 | 5 |
| 4 | 65 | 18 | 1 | 1 | 20 |
| 5 | 48 | 18 | 0 | 0 | 20 |
| 6 | 65 | 6 | 0 | 1 | 20 |
| 7 | 48 | 6 | 1 | 0 | 20 |
| 8 | 65 | 6 | 0 | 0 | 5 |
Step-by-Step Workflow
1
Preview the design
$ doe info --config use_cases/132_water_heater_efficiency/config.json
2
Generate the runner script
$ doe generate --config use_cases/132_water_heater_efficiency/config.json \
--output use_cases/132_water_heater_efficiency/results/run.sh --seed 42
3
Execute the experiments
$ bash use_cases/132_water_heater_efficiency/results/run.sh
4
Analyze results
$ doe analyze --config use_cases/132_water_heater_efficiency/config.json
5
Get optimization recommendations
$ doe optimize --config use_cases/132_water_heater_efficiency/config.json
6
Multi-objective optimization
With 2 competing responses, use --multi to find the best compromise via Derringer–Suich desirability.
$ doe optimize --config use_cases/132_water_heater_efficiency/config.json --multi
7
Generate the HTML report
$ doe report --config use_cases/132_water_heater_efficiency/config.json \
--output use_cases/132_water_heater_efficiency/results/report.html
Features Exercised
| Feature | Value |
|---|
| Design type | plackett_burman |
| Factor types | continuous (all 5) |
| Arg style | double-dash |
| Responses | 2 (monthly_kwh ↓, availability_pct ↑) |
| Total runs | 8 |
Analysis Results
Generated from actual experiment runs using the DOE Helper Tool.
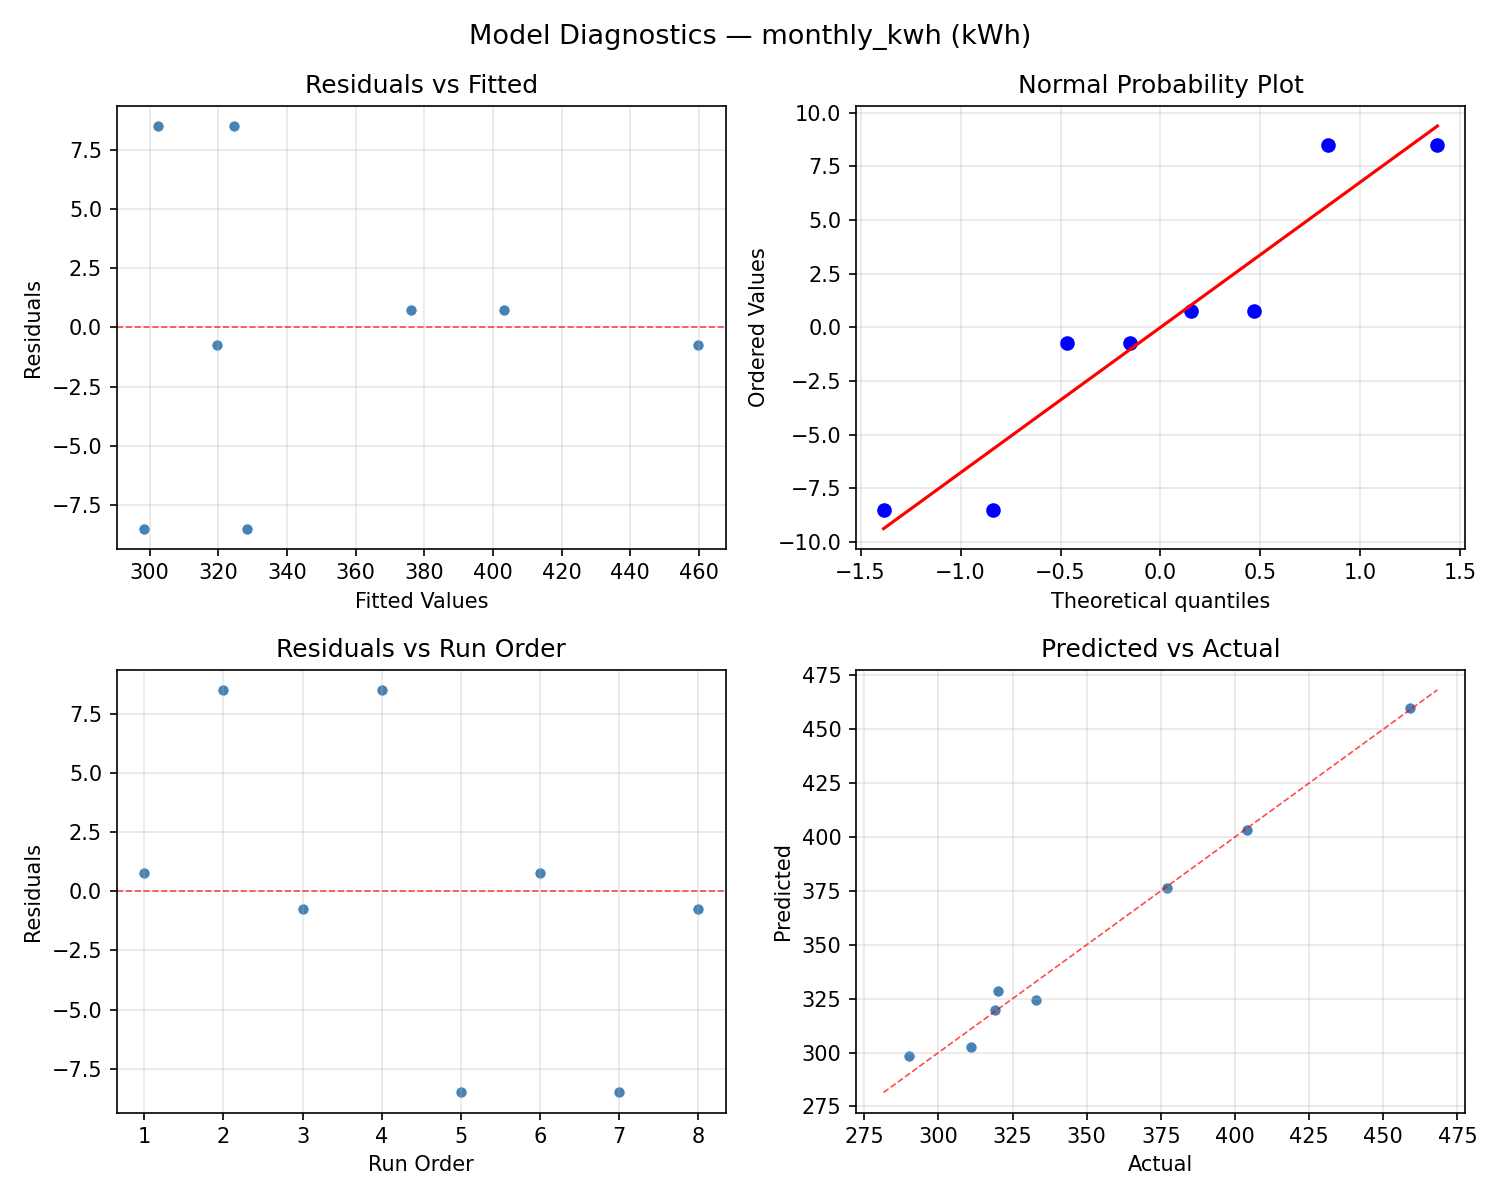
Response: monthly_kwh
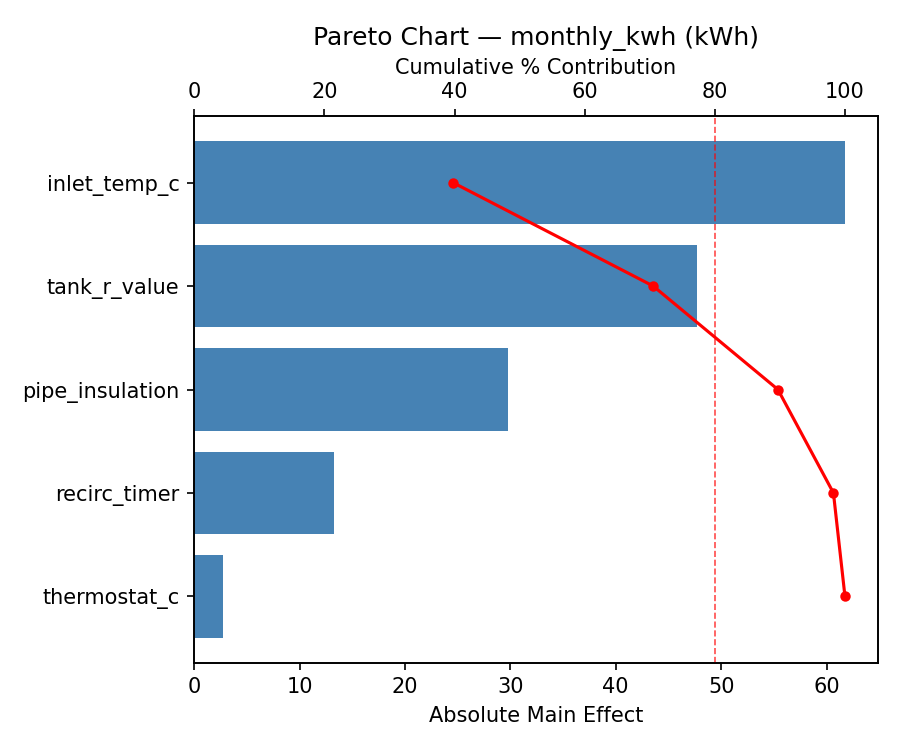
Top factors: inlet_temp_c (37.1%), pipe_insulation (28.7%), tank_r_value (24.5%).
ANOVA
| Source | DF | SS | MS | F | p-value |
|---|
| Source | DF | SS | MS | F | p-value |
| thermostat_c | 1 | 378.1250 | 378.1250 | 0.076 | 0.7940 |
| tank_r_value | 1 | 3321.1250 | 3321.1250 | 0.667 | 0.4513 |
| pipe_insulation | 1 | 4560.1250 | 4560.1250 | 0.915 | 0.3826 |
| recirc_timer | 1 | 10.1250 | 10.1250 | 0.002 | 0.9658 |
| inlet_temp_c | 1 | 7626.1250 | 7626.1250 | 1.531 | 0.2709 |
| thermostat_c*tank_r_value | 1 | 4560.1250 | 4560.1250 | 0.915 | 0.3826 |
| thermostat_c*pipe_insulation | 1 | 3321.1250 | 3321.1250 | 0.667 | 0.4513 |
| thermostat_c*recirc_timer | 1 | 7626.1250 | 7626.1250 | 1.531 | 0.2709 |
| thermostat_c*inlet_temp_c | 1 | 10.1250 | 10.1250 | 0.002 | 0.9658 |
| tank_r_value*pipe_insulation | 1 | 378.1250 | 378.1250 | 0.076 | 0.7940 |
| tank_r_value*recirc_timer | 1 | 5050.1250 | 5050.1250 | 1.014 | 0.3602 |
| tank_r_value*inlet_temp_c | 1 | 1830.1250 | 1830.1250 | 0.367 | 0.5709 |
| pipe_insulation*recirc_timer | 1 | 1830.1250 | 1830.1250 | 0.367 | 0.5709 |
| pipe_insulation*inlet_temp_c | 1 | 5050.1250 | 5050.1250 | 1.014 | 0.3602 |
| recirc_timer*inlet_temp_c | 1 | 378.1250 | 378.1250 | 0.076 | 0.7940 |
| Error | (Lenth | PSE) | 5 | 24908.4375 | 4981.6875 |
| Total | 7 | 22775.8750 | 3253.6964 | | |
Pareto Chart
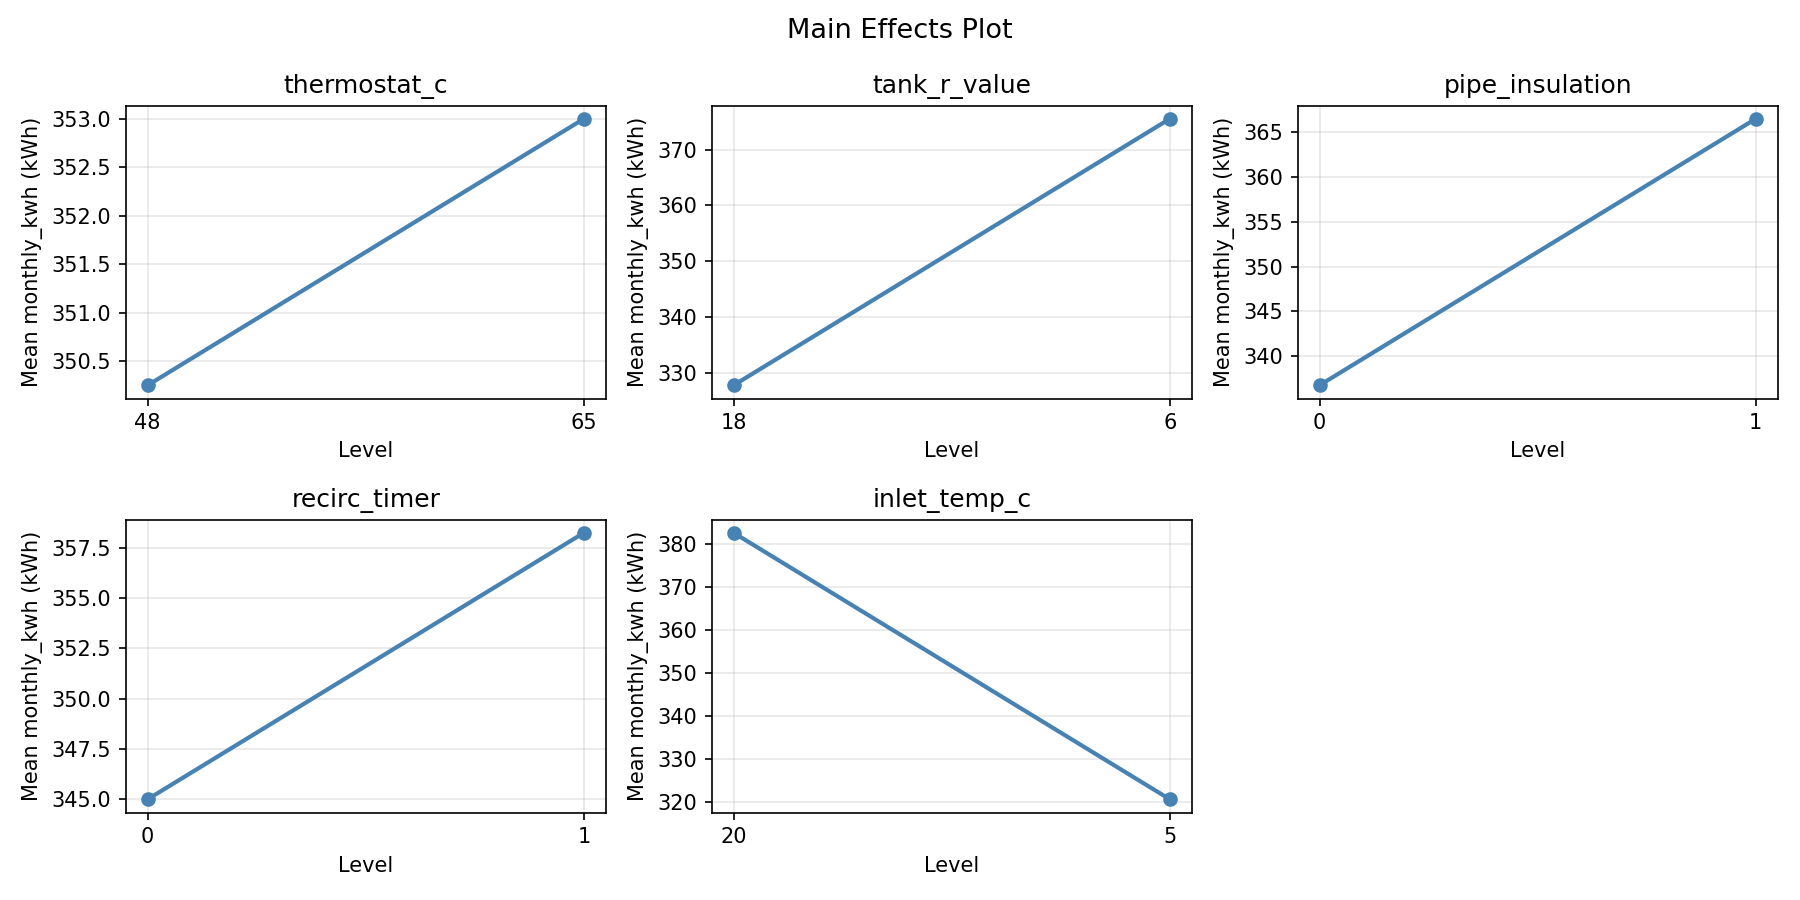
Main Effects Plot
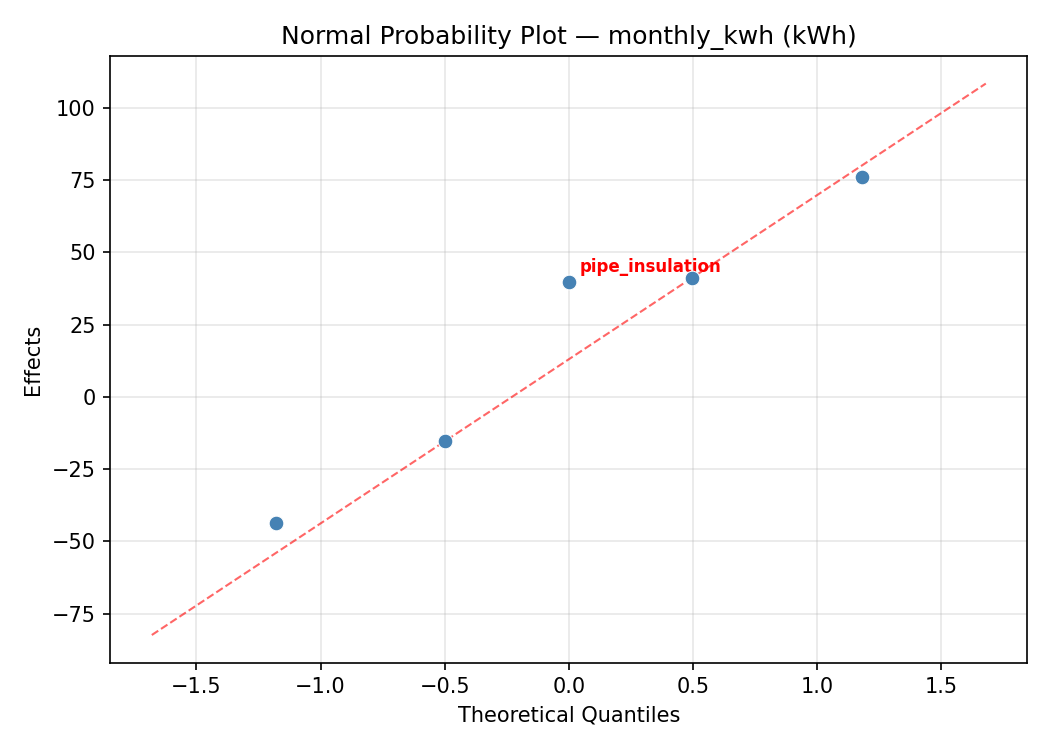
Normal Probability Plot of Effects
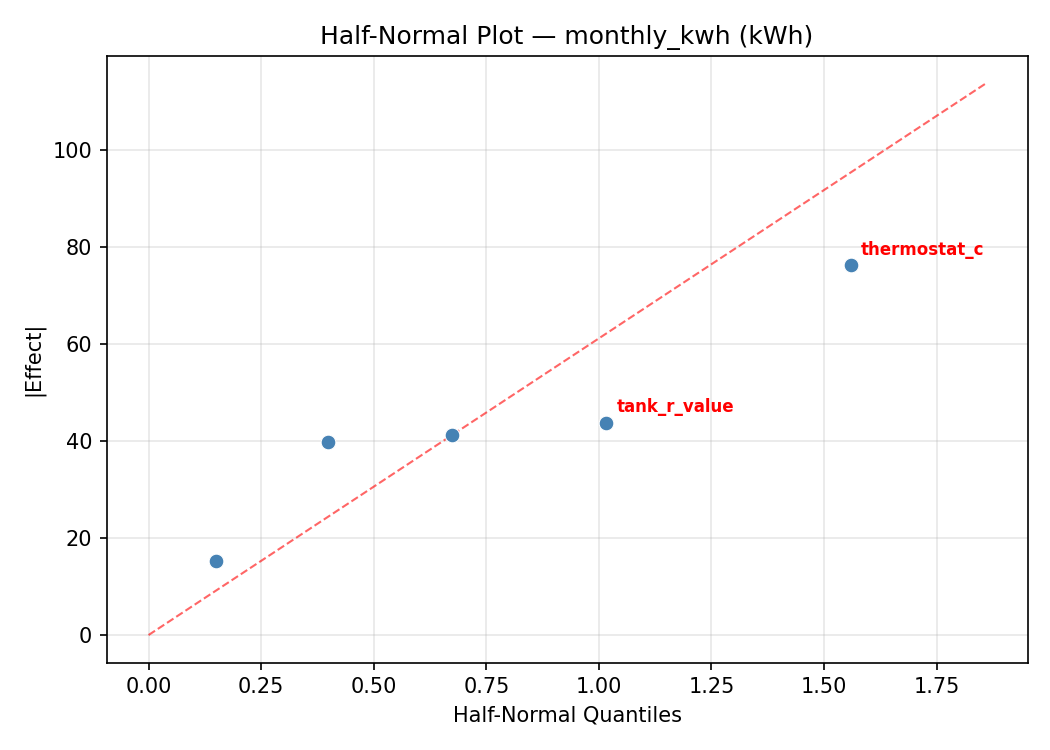
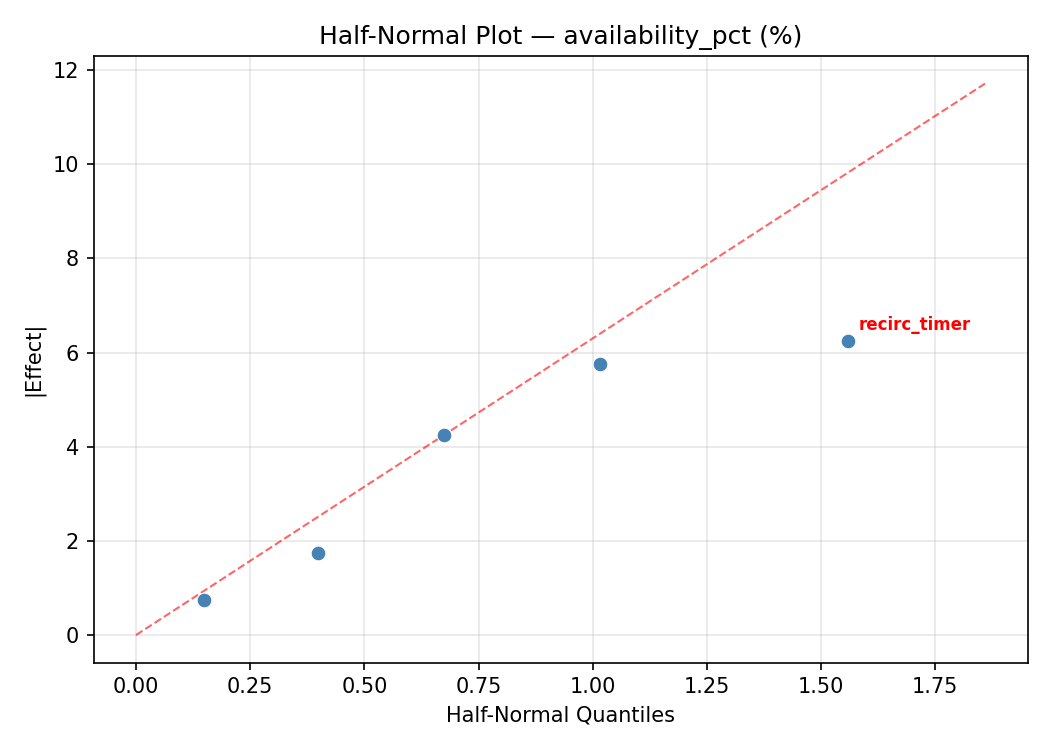
Half-Normal Plot of Effects
Model Diagnostics
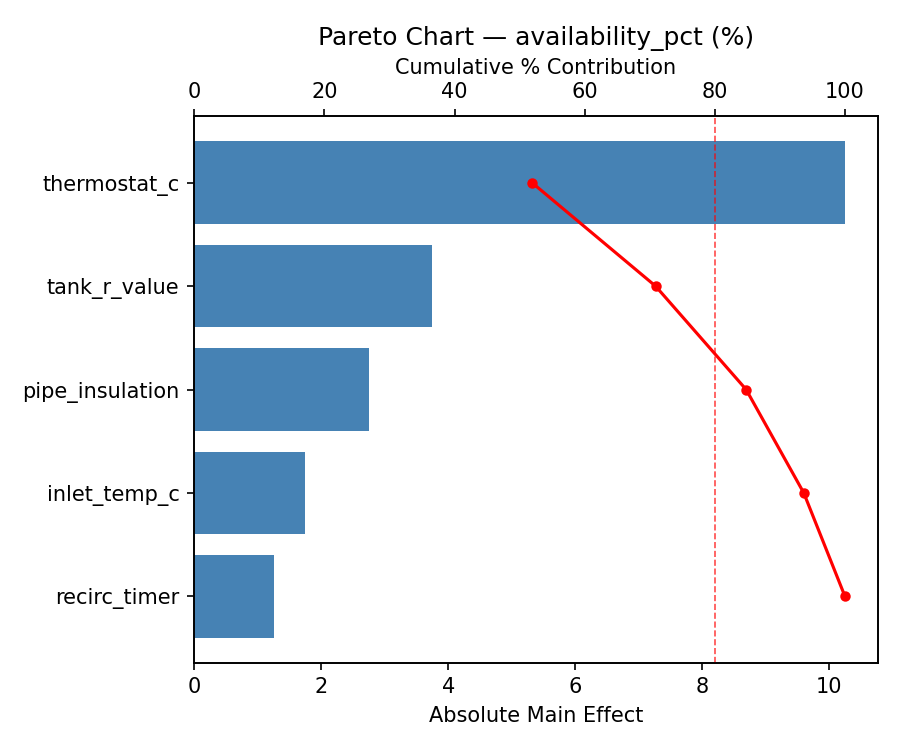
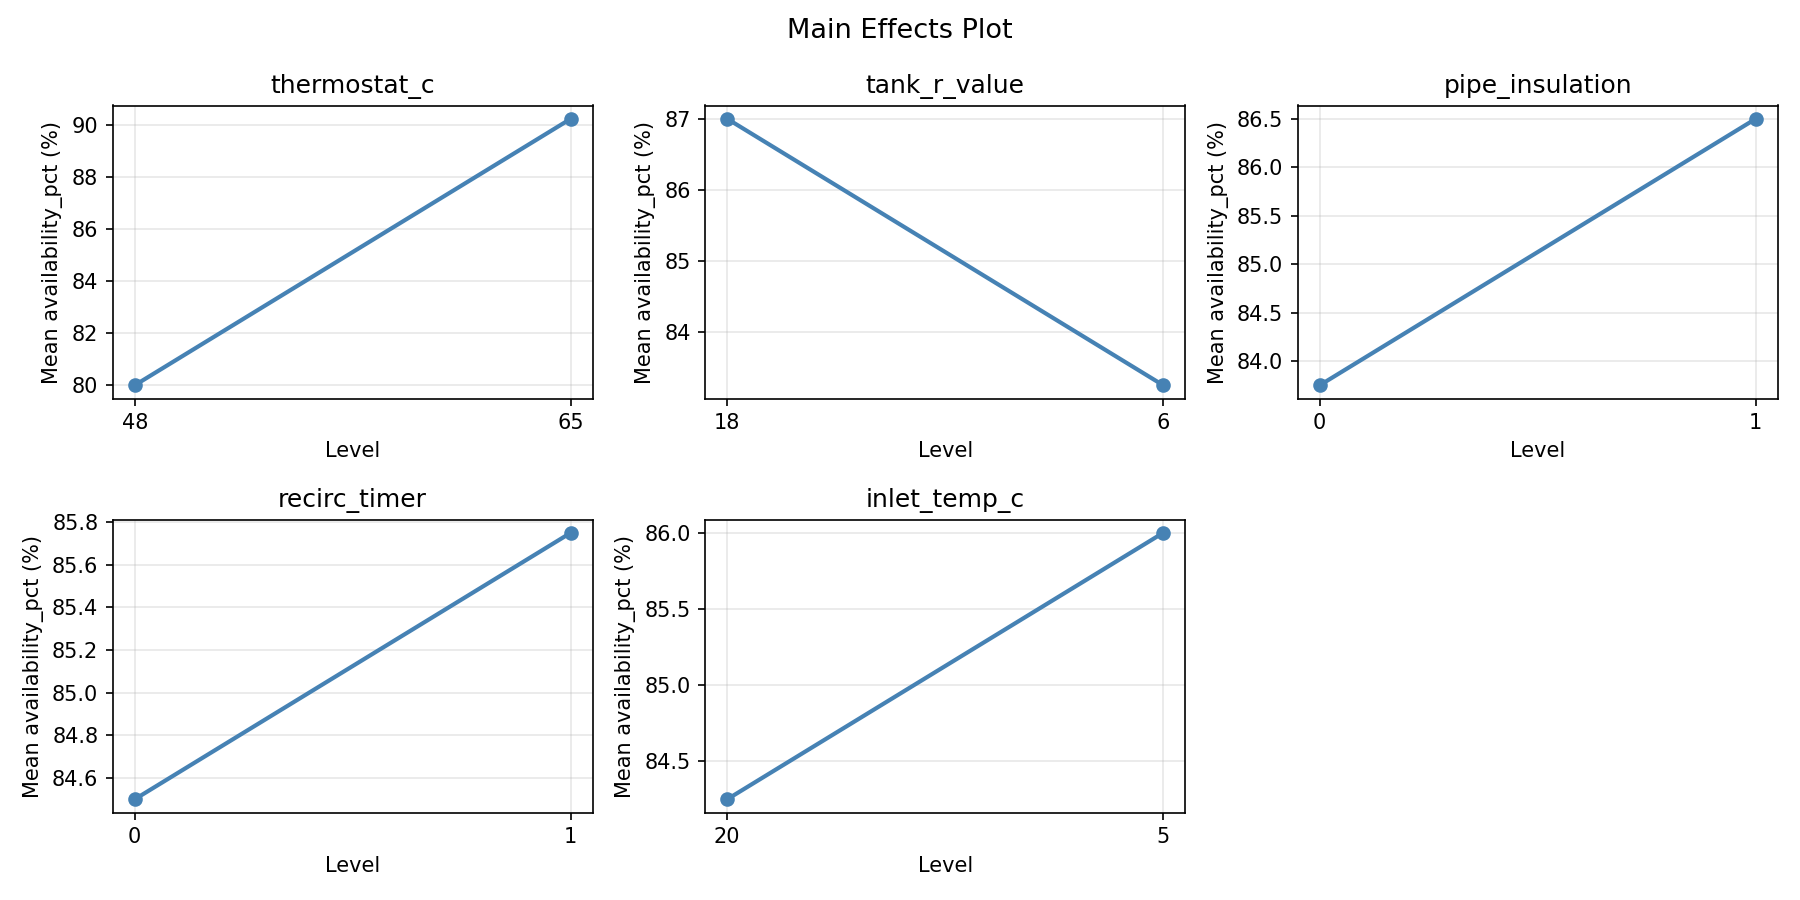
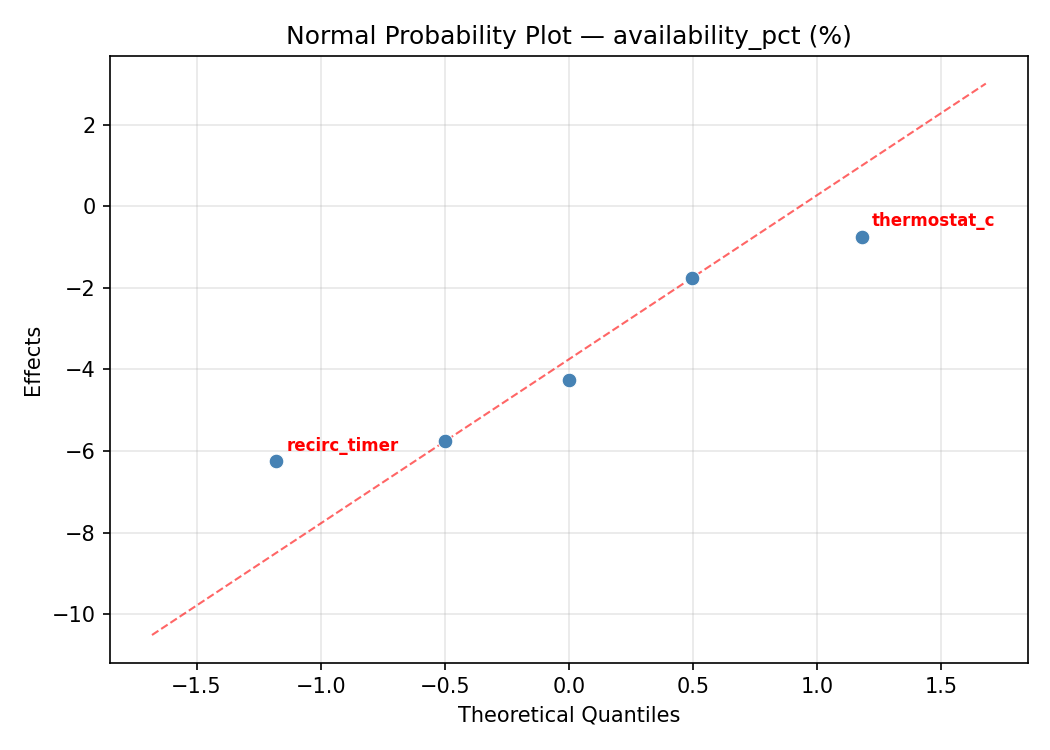
Response: availability_pct
Top factors: recirc_timer (44.1%), tank_r_value (26.9%), pipe_insulation (16.1%).
ANOVA
| Source | DF | SS | MS | F | p-value |
|---|
| Source | DF | SS | MS | F | p-value |
| thermostat_c | 1 | 3.1250 | 3.1250 | 0.138 | 0.7257 |
| tank_r_value | 1 | 78.1250 | 78.1250 | 3.444 | 0.1227 |
| pipe_insulation | 1 | 28.1250 | 28.1250 | 1.240 | 0.3162 |
| recirc_timer | 1 | 210.1250 | 210.1250 | 9.262 | 0.0286 |
| inlet_temp_c | 1 | 6.1250 | 6.1250 | 0.270 | 0.6255 |
| thermostat_c*tank_r_value | 1 | 28.1250 | 28.1250 | 1.240 | 0.3162 |
| thermostat_c*pipe_insulation | 1 | 78.1250 | 78.1250 | 3.444 | 0.1227 |
| thermostat_c*recirc_timer | 1 | 6.1250 | 6.1250 | 0.270 | 0.6255 |
| thermostat_c*inlet_temp_c | 1 | 210.1250 | 210.1250 | 9.262 | 0.0286 |
| tank_r_value*pipe_insulation | 1 | 3.1250 | 3.1250 | 0.138 | 0.7257 |
| tank_r_value*recirc_timer | 1 | 78.1250 | 78.1250 | 3.444 | 0.1227 |
| tank_r_value*inlet_temp_c | 1 | 15.1250 | 15.1250 | 0.667 | 0.4513 |
| pipe_insulation*recirc_timer | 1 | 15.1250 | 15.1250 | 0.667 | 0.4513 |
| pipe_insulation*inlet_temp_c | 1 | 78.1250 | 78.1250 | 3.444 | 0.1227 |
| recirc_timer*inlet_temp_c | 1 | 3.1250 | 3.1250 | 0.138 | 0.7257 |
| Error | (Lenth | PSE) | 5 | 113.4375 | 22.6875 |
| Total | 7 | 418.8750 | 59.8393 | | |
Pareto Chart
Main Effects Plot
Normal Probability Plot of Effects
Half-Normal Plot of Effects
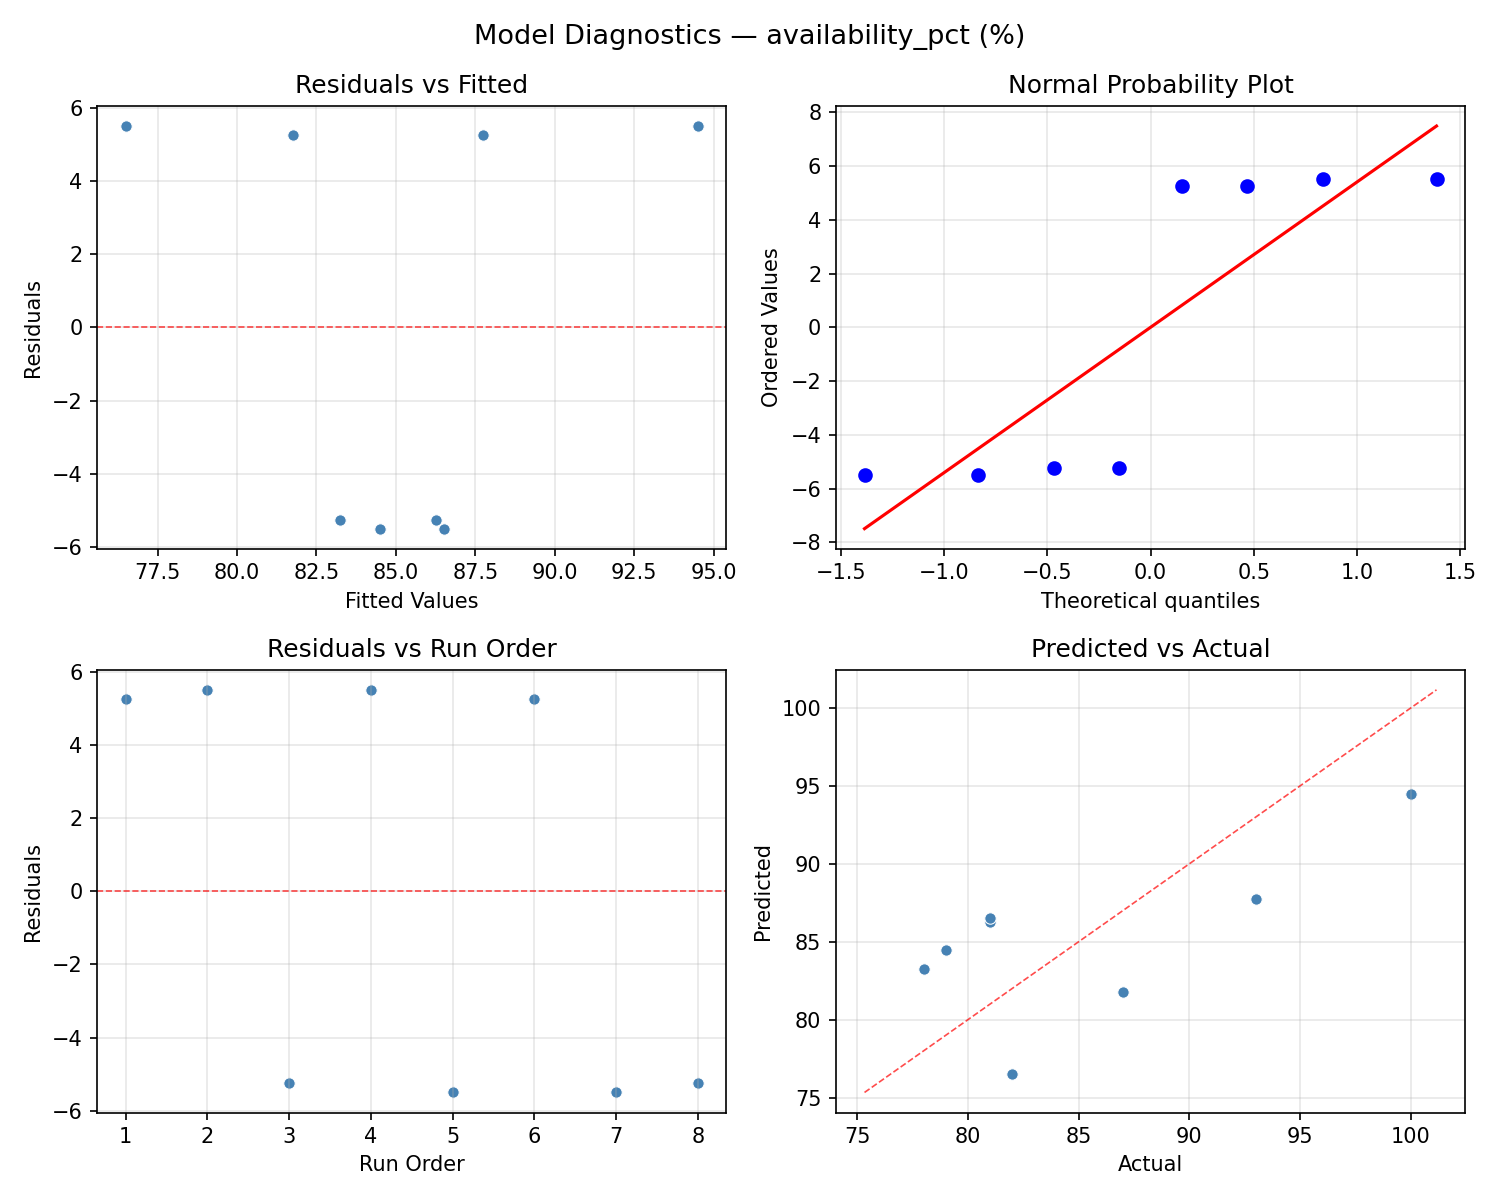
Model Diagnostics
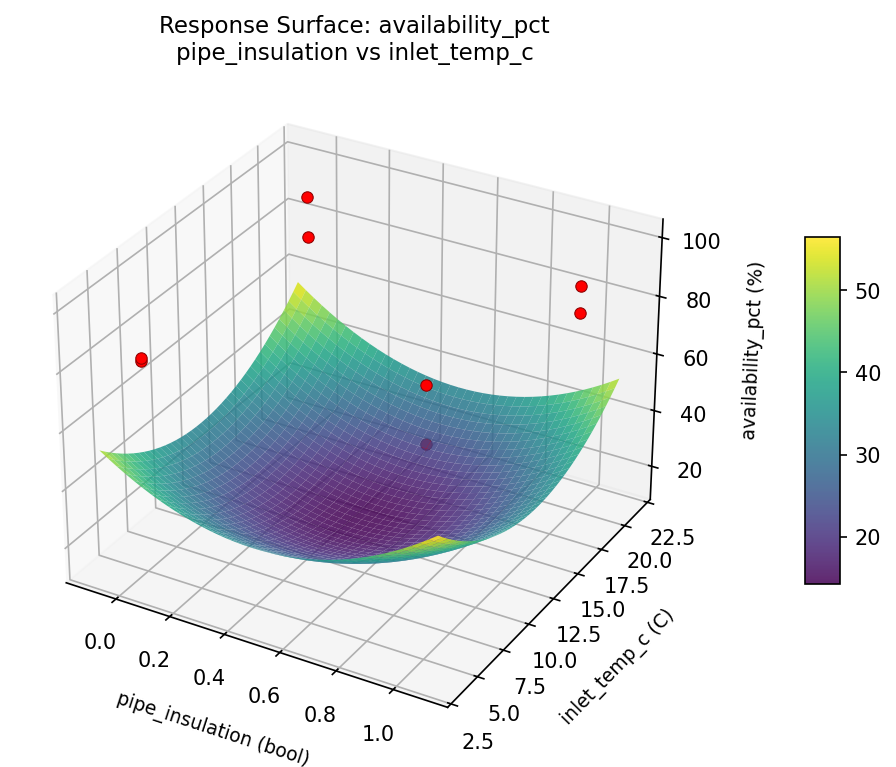
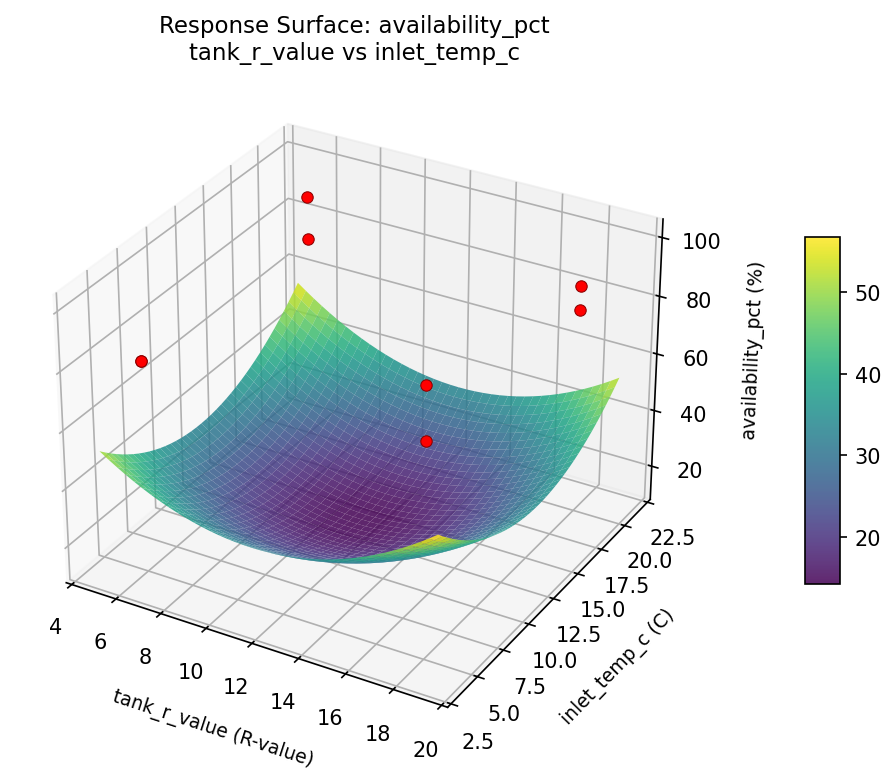
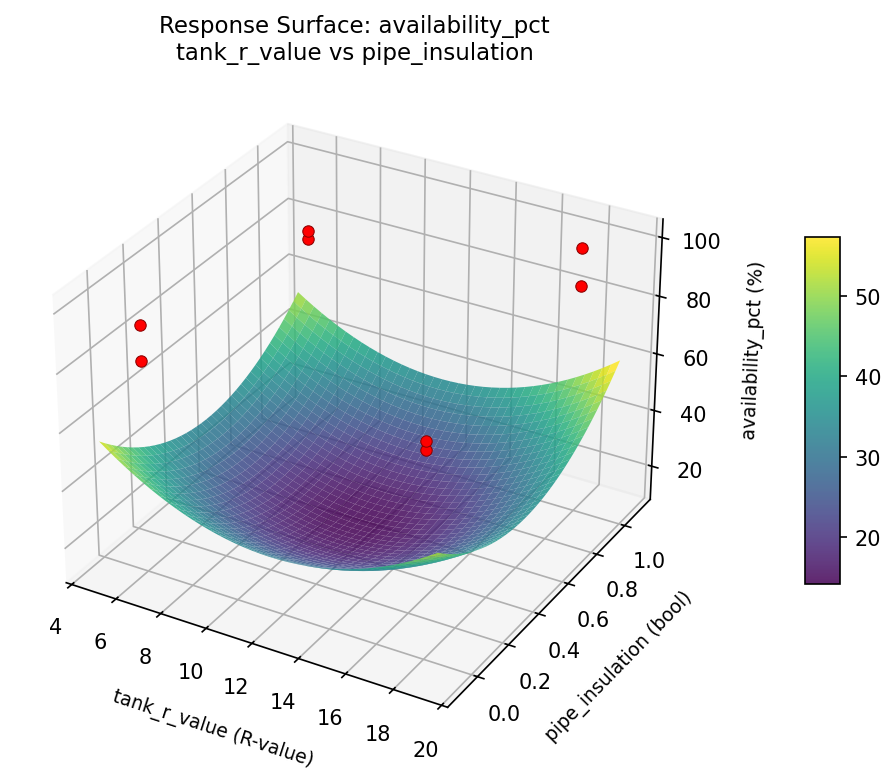
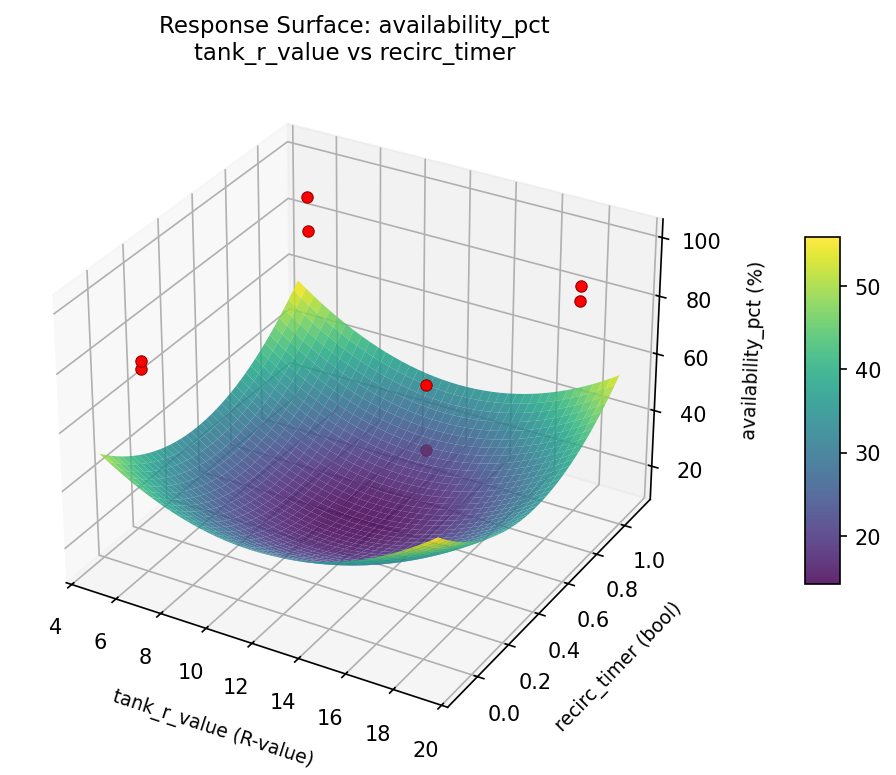
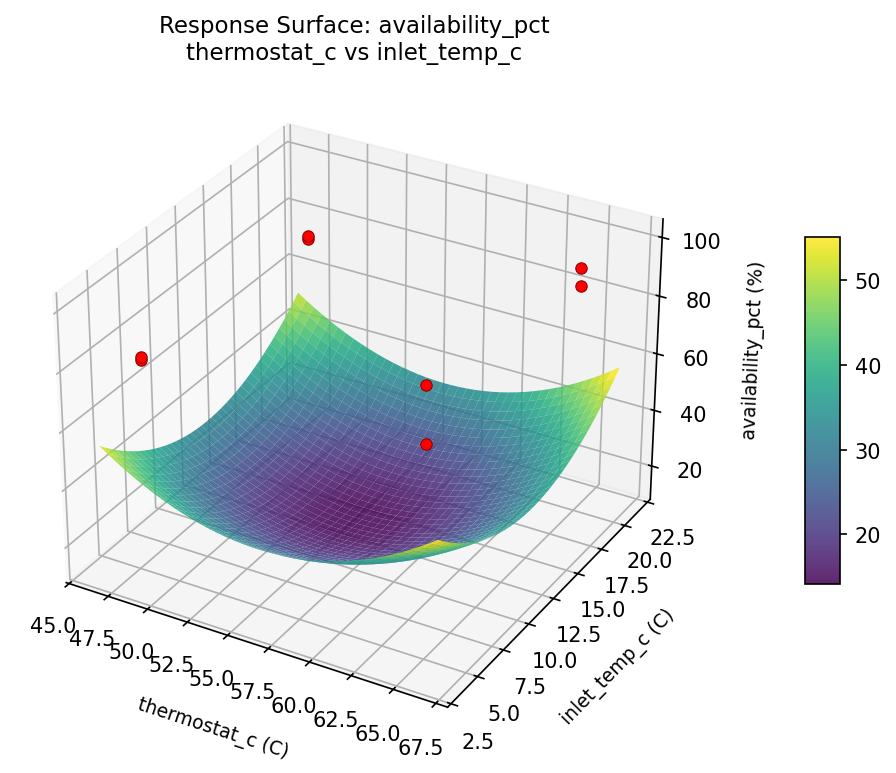
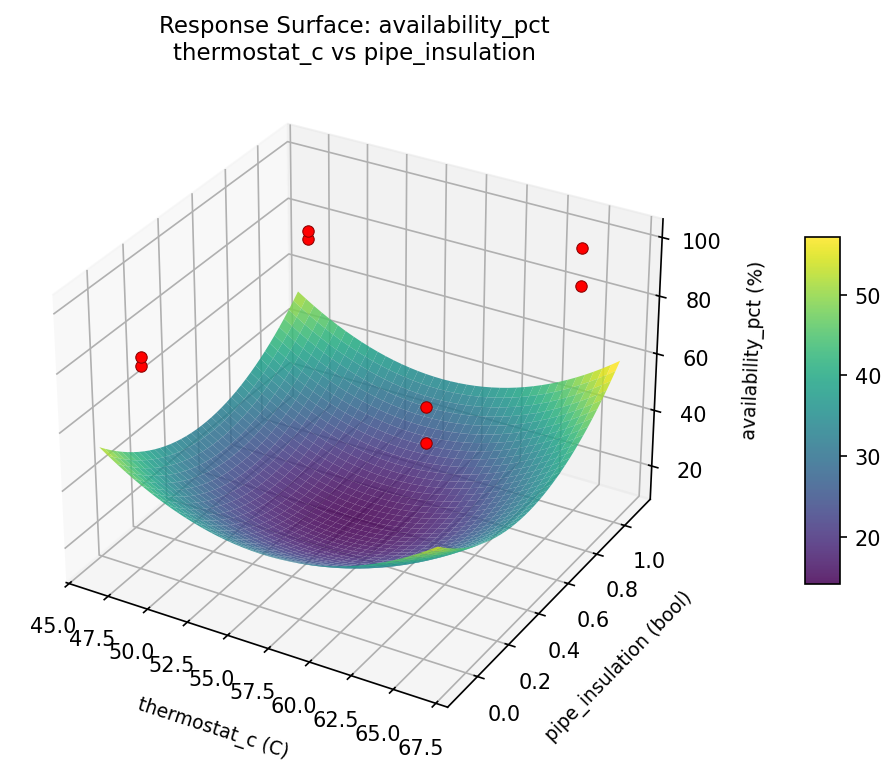
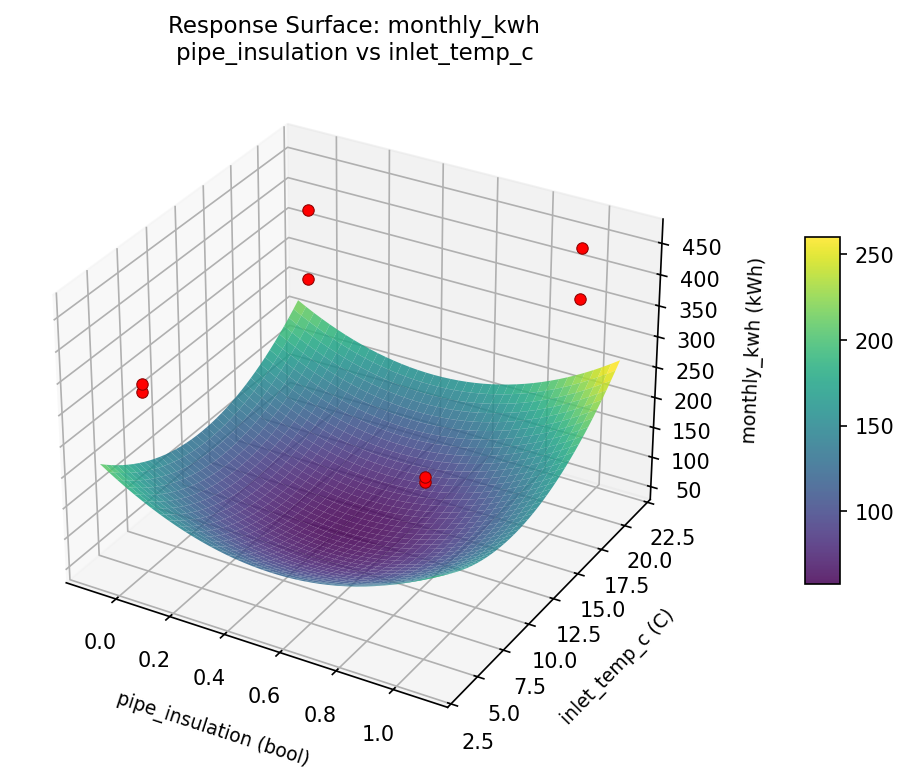
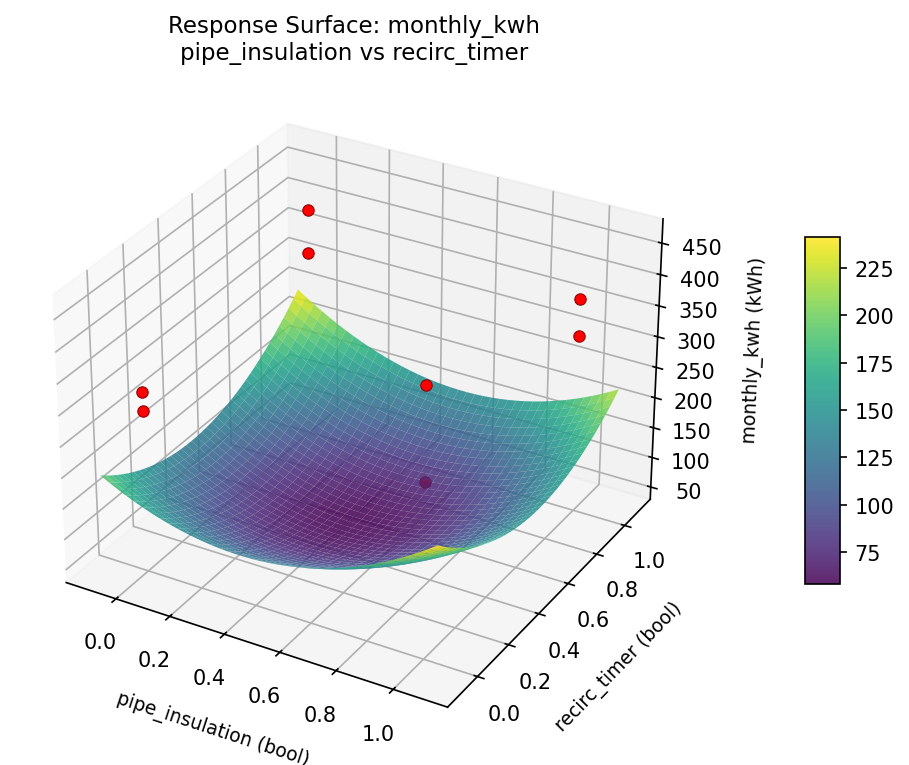
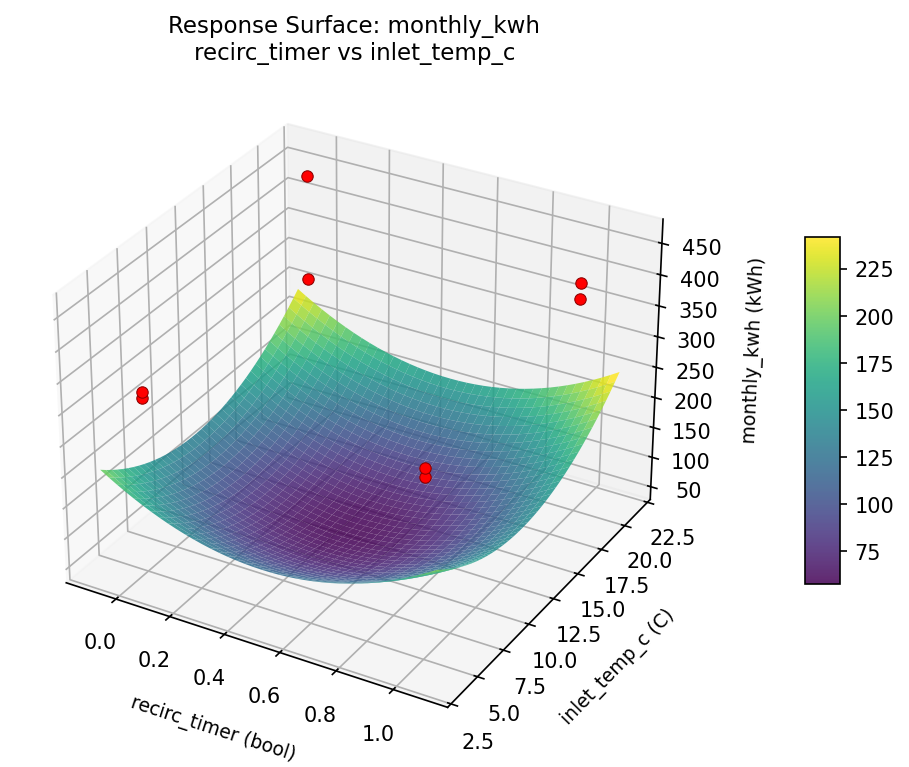
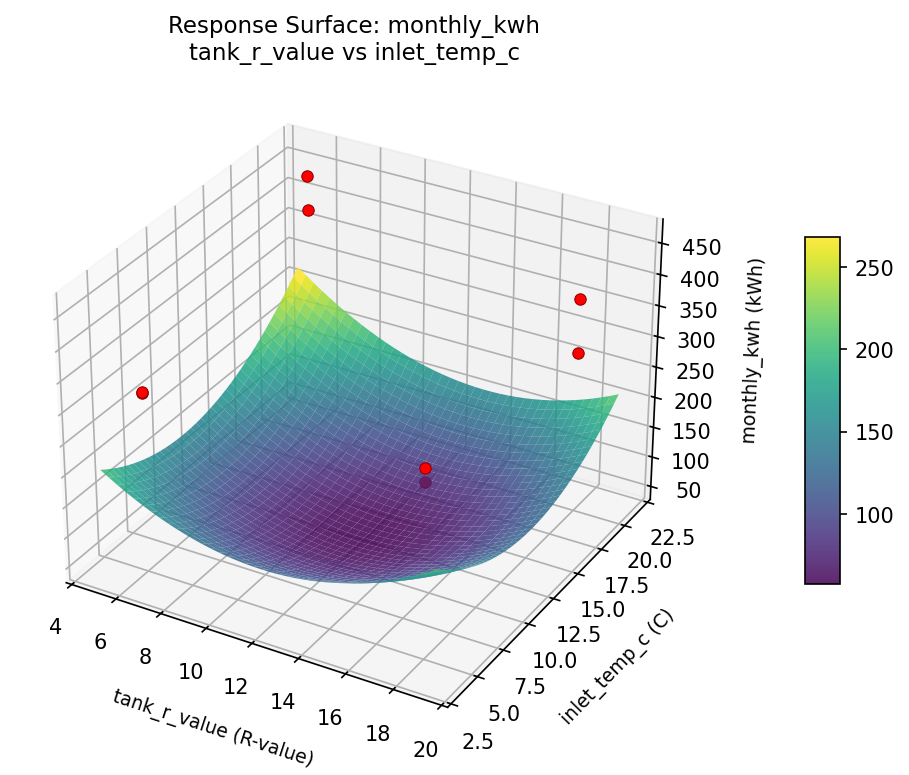
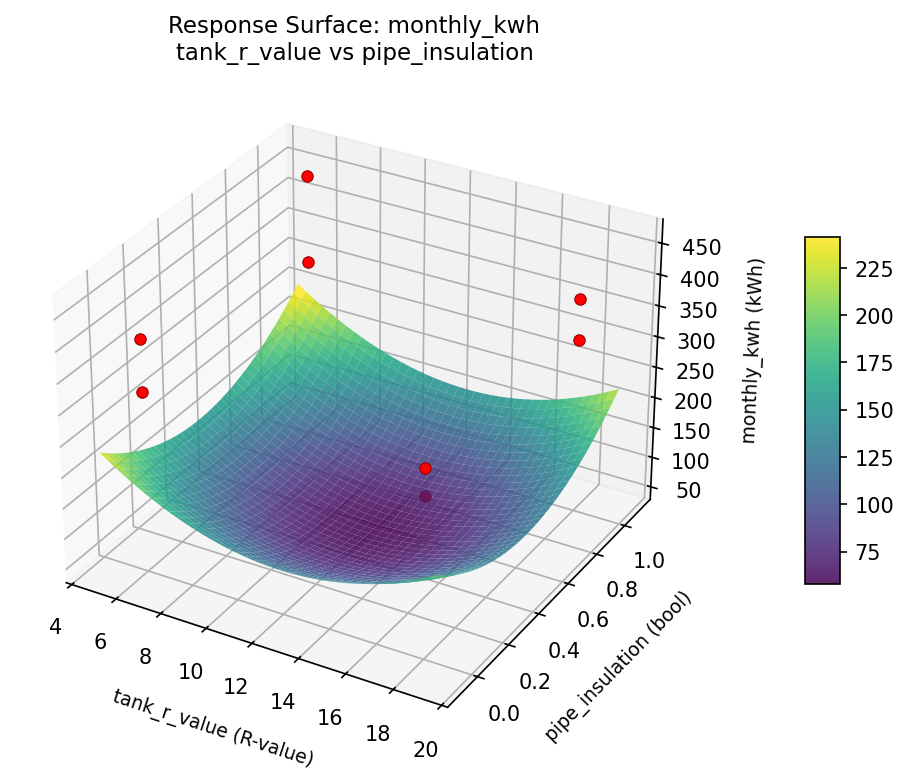
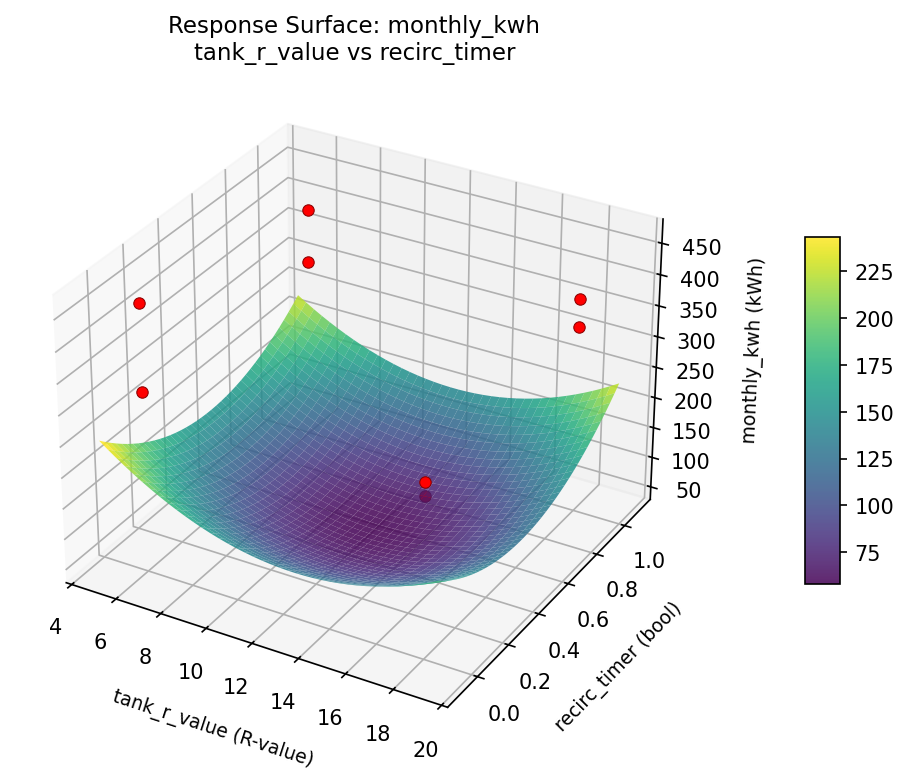
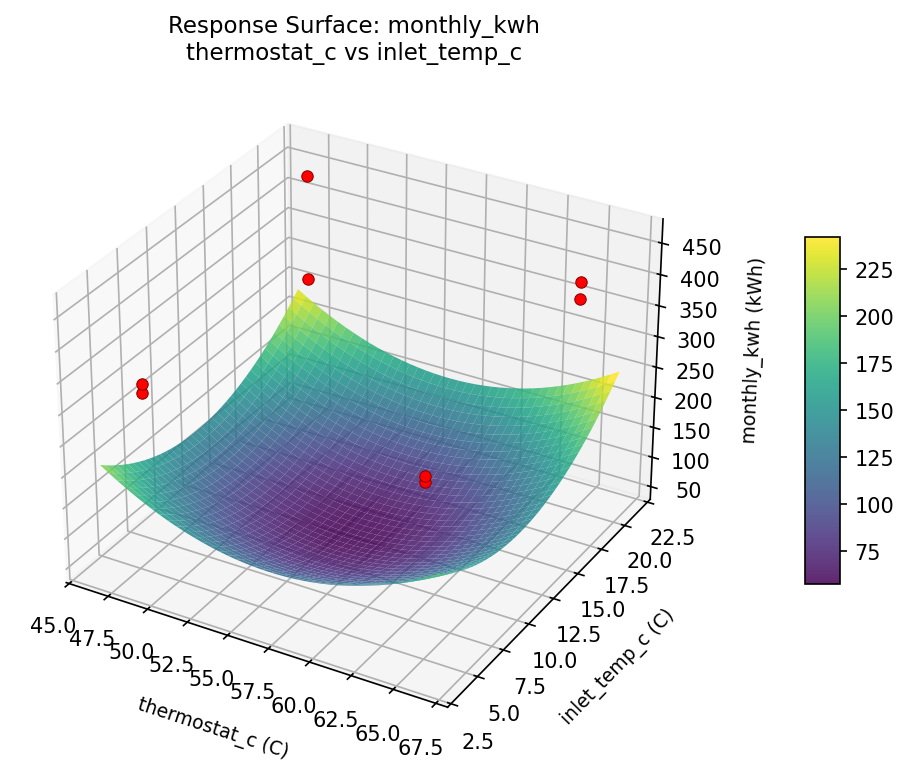
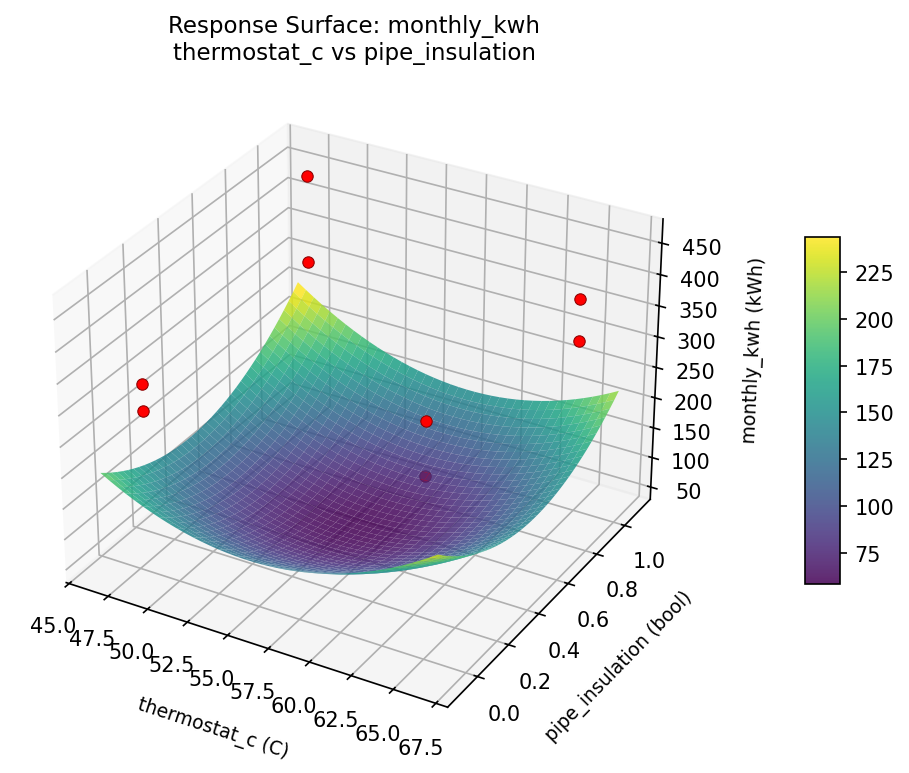
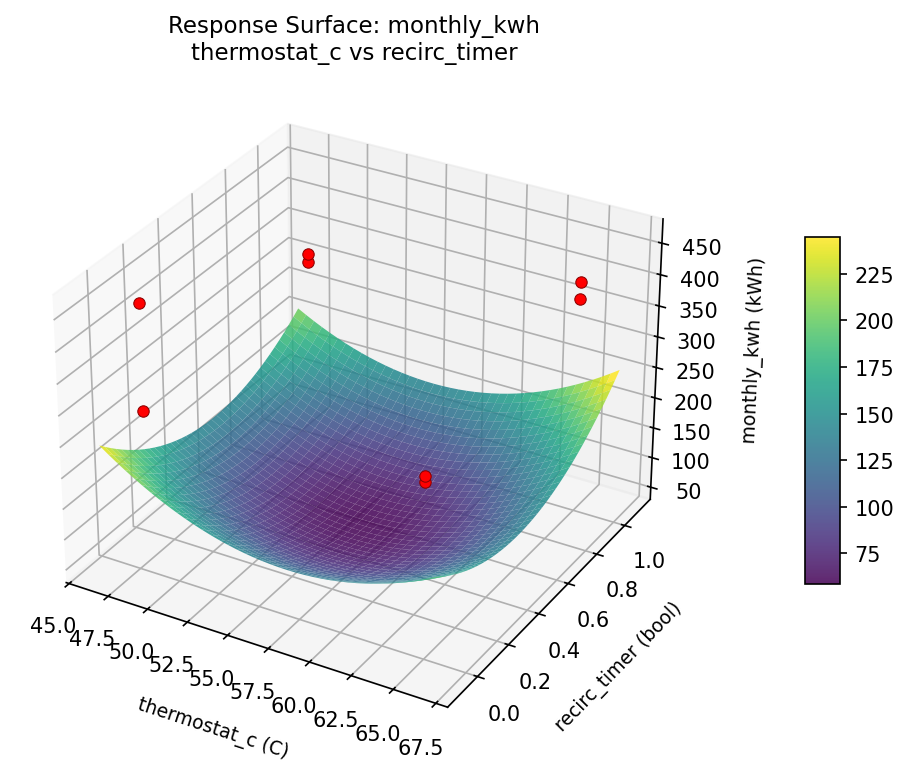
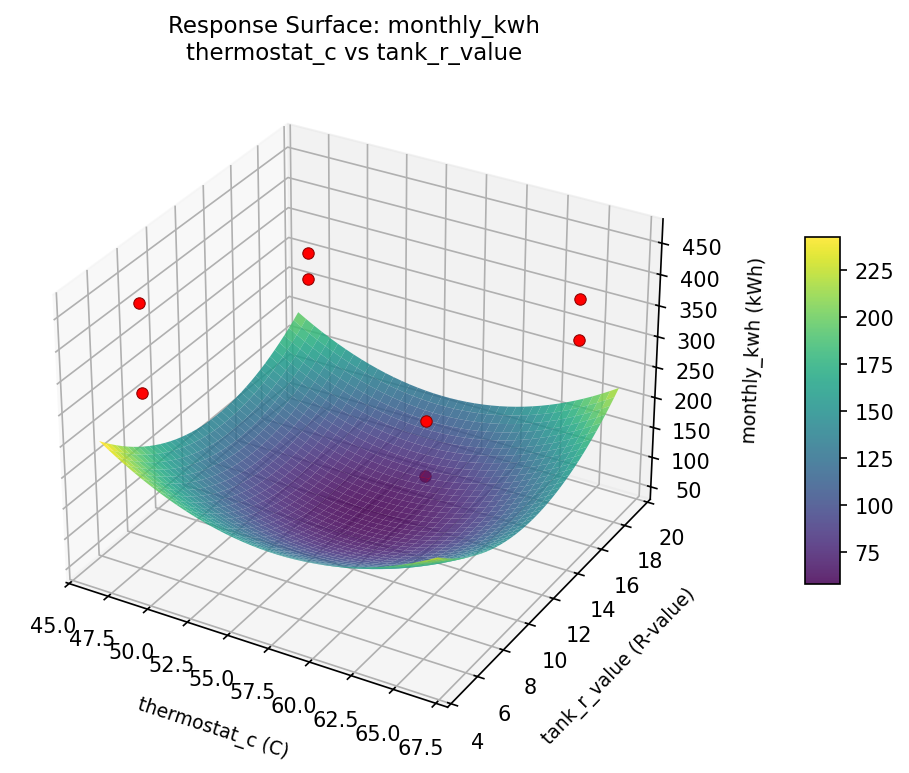
Response Surface Plots
3D surfaces fitted with quadratic RSM. Red dots are observed data points.
availability pct pipe insulation vs inlet temp c
availability pct pipe insulation vs recirc timer

availability pct recirc timer vs inlet temp c

availability pct tank r value vs inlet temp c
availability pct tank r value vs pipe insulation
availability pct tank r value vs recirc timer
availability pct thermostat c vs inlet temp c
availability pct thermostat c vs pipe insulation
availability pct thermostat c vs recirc timer

availability pct thermostat c vs tank r value

monthly kwh pipe insulation vs inlet temp c
monthly kwh pipe insulation vs recirc timer
monthly kwh recirc timer vs inlet temp c
monthly kwh tank r value vs inlet temp c
monthly kwh tank r value vs pipe insulation
monthly kwh tank r value vs recirc timer
monthly kwh thermostat c vs inlet temp c
monthly kwh thermostat c vs pipe insulation
monthly kwh thermostat c vs recirc timer
monthly kwh thermostat c vs tank r value
Multi-Objective Optimization
When responses compete, Derringer–Suich desirability finds the best compromise.
Each response is scaled to a 0–1 desirability, then combined via a weighted geometric mean.
Overall Desirability
D = 0.9076
Per-Response Desirability
| Response | Weight | Desirability | Predicted | Dir |
|---|
monthly_kwh |
1.0 |
|
311.00 0.8416 311.00 kWh |
↓ |
availability_pct |
1.5 |
|
100.00 0.9545 100.00 % |
↑ |
Recommended Settings
| Factor | Value |
|---|
thermostat_c | 48 C |
tank_r_value | 6 R-value |
pipe_insulation | 1 bool |
recirc_timer | 1 bool |
inlet_temp_c | 5 C |
Source: from observed run #4
Trade-off Summary
Sacrifice = how much worse than single-objective best.
| Response | Predicted | Best Observed | Sacrifice |
|---|
availability_pct | 100.00 | 100.00 | +0.00 |
Top 3 Runs by Desirability
| Run | D | Factor Settings |
|---|
| #6 | 0.5094 | thermostat_c=48, tank_r_value=6, pipe_insulation=1, recirc_timer=0, inlet_temp_c=20 |
| #1 | 0.4438 | thermostat_c=48, tank_r_value=18, pipe_insulation=0, recirc_timer=0, inlet_temp_c=20 |
Model Quality
| Response | R² | Type |
|---|
availability_pct | 0.8633 | linear |
Full Multi-Objective Output
============================================================
MULTI-OBJECTIVE OPTIMIZATION
Method: Derringer-Suich Desirability Function
============================================================
Overall desirability: D = 0.9076
Response Weight Desirability Predicted Direction
---------------------------------------------------------------------
monthly_kwh 1.0 0.8416 311.00 kWh ↓
availability_pct 1.5 0.9545 100.00 % ↑
Recommended settings:
thermostat_c = 48 C
tank_r_value = 6 R-value
pipe_insulation = 1 bool
recirc_timer = 1 bool
inlet_temp_c = 5 C
(from observed run #4)
Trade-off summary:
monthly_kwh: 311.00 (best observed: 290.00, sacrifice: +21.00)
availability_pct: 100.00 (best observed: 100.00, sacrifice: +0.00)
Model quality:
monthly_kwh: R² = 0.7427 (linear)
availability_pct: R² = 0.8633 (linear)
Top 3 observed runs by overall desirability:
1. Run #4 (D=0.9076): thermostat_c=48, tank_r_value=6, pipe_insulation=1, recirc_timer=1, inlet_temp_c=5
2. Run #6 (D=0.5094): thermostat_c=48, tank_r_value=6, pipe_insulation=1, recirc_timer=0, inlet_temp_c=20
3. Run #1 (D=0.4438): thermostat_c=48, tank_r_value=18, pipe_insulation=0, recirc_timer=0, inlet_temp_c=20
Full Analysis Output
=== Main Effects: monthly_kwh ===
Factor Effect Std Error % Contribution
--------------------------------------------------------------
inlet_temp_c -61.7500 20.1671 37.1%
pipe_insulation -47.7500 20.1671 28.7%
tank_r_value 40.7500 20.1671 24.5%
thermostat_c -13.7500 20.1671 8.3%
recirc_timer -2.2500 20.1671 1.4%
=== ANOVA Table: monthly_kwh ===
Source DF SS MS F p-value
-----------------------------------------------------------------------------
thermostat_c 1 378.1250 378.1250 0.076 0.7940
tank_r_value 1 3321.1250 3321.1250 0.667 0.4513
pipe_insulation 1 4560.1250 4560.1250 0.915 0.3826
recirc_timer 1 10.1250 10.1250 0.002 0.9658
inlet_temp_c 1 7626.1250 7626.1250 1.531 0.2709
thermostat_c*tank_r_value 1 4560.1250 4560.1250 0.915 0.3826
thermostat_c*pipe_insulation 1 3321.1250 3321.1250 0.667 0.4513
thermostat_c*recirc_timer 1 7626.1250 7626.1250 1.531 0.2709
thermostat_c*inlet_temp_c 1 10.1250 10.1250 0.002 0.9658
tank_r_value*pipe_insulation 1 378.1250 378.1250 0.076 0.7940
tank_r_value*recirc_timer 1 5050.1250 5050.1250 1.014 0.3602
tank_r_value*inlet_temp_c 1 1830.1250 1830.1250 0.367 0.5709
pipe_insulation*recirc_timer 1 1830.1250 1830.1250 0.367 0.5709
pipe_insulation*inlet_temp_c 1 5050.1250 5050.1250 1.014 0.3602
recirc_timer*inlet_temp_c 1 378.1250 378.1250 0.076 0.7940
Error (Lenth PSE) 5 24908.4375 4981.6875
Total 7 22775.8750 3253.6964
Note: Error estimated using Lenth's pseudo-standard-error (unreplicated design)
=== Interaction Effects: monthly_kwh ===
Factor A Factor B Interaction % Contribution
------------------------------------------------------------------------
thermostat_c recirc_timer 61.7500 18.1%
tank_r_value recirc_timer 50.2500 14.7%
pipe_insulation inlet_temp_c 50.2500 14.7%
thermostat_c tank_r_value 47.7500 14.0%
thermostat_c pipe_insulation -40.7500 12.0%
tank_r_value inlet_temp_c -30.2500 8.9%
pipe_insulation recirc_timer -30.2500 8.9%
tank_r_value pipe_insulation 13.7500 4.0%
recirc_timer inlet_temp_c 13.7500 4.0%
thermostat_c inlet_temp_c 2.2500 0.7%
=== Summary Statistics: monthly_kwh ===
thermostat_c:
Level N Mean Std Min Max
------------------------------------------------------------
48 4 358.5000 38.9230 320.0000 404.0000
65 4 344.7500 77.1422 290.0000 459.0000
tank_r_value:
Level N Mean Std Min Max
------------------------------------------------------------
18 4 331.2500 50.1024 290.0000 404.0000
6 4 372.0000 63.0450 319.0000 459.0000
pipe_insulation:
Level N Mean Std Min Max
------------------------------------------------------------
0 4 375.5000 68.4519 319.0000 459.0000
1 4 327.7500 37.2324 290.0000 377.0000
recirc_timer:
Level N Mean Std Min Max
------------------------------------------------------------
0 4 352.7500 45.0805 311.0000 404.0000
1 4 350.5000 74.5408 290.0000 459.0000
inlet_temp_c:
Level N Mean Std Min Max
------------------------------------------------------------
20 4 382.5000 70.4769 290.0000 459.0000
5 4 320.7500 9.1059 311.0000 333.0000
=== Main Effects: availability_pct ===
Factor Effect Std Error % Contribution
--------------------------------------------------------------
recirc_timer -10.2500 2.7349 44.1%
tank_r_value -6.2500 2.7349 26.9%
pipe_insulation 3.7500 2.7349 16.1%
inlet_temp_c 1.7500 2.7349 7.5%
thermostat_c -1.2500 2.7349 5.4%
=== ANOVA Table: availability_pct ===
Source DF SS MS F p-value
-----------------------------------------------------------------------------
thermostat_c 1 3.1250 3.1250 0.138 0.7257
tank_r_value 1 78.1250 78.1250 3.444 0.1227
pipe_insulation 1 28.1250 28.1250 1.240 0.3162
recirc_timer 1 210.1250 210.1250 9.262 0.0286
inlet_temp_c 1 6.1250 6.1250 0.270 0.6255
thermostat_c*tank_r_value 1 28.1250 28.1250 1.240 0.3162
thermostat_c*pipe_insulation 1 78.1250 78.1250 3.444 0.1227
thermostat_c*recirc_timer 1 6.1250 6.1250 0.270 0.6255
thermostat_c*inlet_temp_c 1 210.1250 210.1250 9.262 0.0286
tank_r_value*pipe_insulation 1 3.1250 3.1250 0.138 0.7257
tank_r_value*recirc_timer 1 78.1250 78.1250 3.444 0.1227
tank_r_value*inlet_temp_c 1 15.1250 15.1250 0.667 0.4513
pipe_insulation*recirc_timer 1 15.1250 15.1250 0.667 0.4513
pipe_insulation*inlet_temp_c 1 78.1250 78.1250 3.444 0.1227
recirc_timer*inlet_temp_c 1 3.1250 3.1250 0.138 0.7257
Error (Lenth PSE) 5 113.4375 22.6875
Total 7 418.8750 59.8393
Note: Error estimated using Lenth's pseudo-standard-error (unreplicated design)
=== Interaction Effects: availability_pct ===
Factor A Factor B Interaction % Contribution
------------------------------------------------------------------------
thermostat_c inlet_temp_c 10.2500 24.1%
thermostat_c pipe_insulation 6.2500 14.7%
tank_r_value recirc_timer 6.2500 14.7%
pipe_insulation inlet_temp_c 6.2500 14.7%
thermostat_c tank_r_value -3.7500 8.8%
tank_r_value inlet_temp_c -2.7500 6.5%
pipe_insulation recirc_timer -2.7500 6.5%
thermostat_c recirc_timer -1.7500 4.1%
tank_r_value pipe_insulation 1.2500 2.9%
recirc_timer inlet_temp_c 1.2500 2.9%
=== Summary Statistics: availability_pct ===
thermostat_c:
Level N Mean Std Min Max
------------------------------------------------------------
48 4 85.7500 5.5000 81.0000 93.0000
65 4 84.5000 10.4083 78.0000 100.0000
tank_r_value:
Level N Mean Std Min Max
------------------------------------------------------------
18 4 88.2500 9.9791 79.0000 100.0000
6 4 82.0000 3.7417 78.0000 87.0000
pipe_insulation:
Level N Mean Std Min Max
------------------------------------------------------------
0 4 83.2500 6.6521 78.0000 93.0000
1 4 87.0000 9.2736 79.0000 100.0000
recirc_timer:
Level N Mean Std Min Max
------------------------------------------------------------
0 4 90.2500 8.1394 81.0000 100.0000
1 4 80.0000 1.8257 78.0000 82.0000
inlet_temp_c:
Level N Mean Std Min Max
------------------------------------------------------------
20 4 84.2500 7.0887 78.0000 93.0000
5 4 86.0000 9.3452 81.0000 100.0000
Optimization Recommendations
=== Optimization: monthly_kwh ===
Direction: minimize
Best observed run: #5
thermostat_c = 48
tank_r_value = 18
pipe_insulation = 0
recirc_timer = 0
inlet_temp_c = 20
Value: 290.0
RSM Model (linear, R² = 0.8298, Adj R² = 0.4042):
Coefficients:
intercept +351.6250
thermostat_c -7.6250
tank_r_value -1.3750
pipe_insulation -16.6250
recirc_timer +41.6250
inlet_temp_c -17.1250
Predicted optimum (from linear model, at observed points):
thermostat_c = 48
tank_r_value = 18
pipe_insulation = 0
recirc_timer = 1
inlet_temp_c = 5
Predicted value: 433.2500
Surface optimum (via L-BFGS-B, linear model):
thermostat_c = 65
tank_r_value = 18
pipe_insulation = 1
recirc_timer = 0
inlet_temp_c = 20
Predicted value: 267.2500
Model quality: Good fit — general trends are captured, some noise remains.
Factor importance:
1. recirc_timer (effect: 83.2, contribution: 49.3%)
2. inlet_temp_c (effect: 34.2, contribution: 20.3%)
3. pipe_insulation (effect: -33.2, contribution: 19.7%)
4. thermostat_c (effect: -15.2, contribution: 9.0%)
5. tank_r_value (effect: 2.8, contribution: 1.6%)
=== Optimization: availability_pct ===
Direction: maximize
Best observed run: #4
thermostat_c = 48
tank_r_value = 6
pipe_insulation = 1
recirc_timer = 0
inlet_temp_c = 20
Value: 100.0
RSM Model (linear, R² = 0.8418, Adj R² = 0.4464):
Coefficients:
intercept +85.1250
thermostat_c -0.8750
tank_r_value -5.1250
pipe_insulation +2.3750
recirc_timer -0.1250
inlet_temp_c +3.3750
Predicted optimum (from linear model, at observed points):
thermostat_c = 48
tank_r_value = 6
pipe_insulation = 1
recirc_timer = 0
inlet_temp_c = 20
Predicted value: 97.0000
Surface optimum (via L-BFGS-B, linear model):
thermostat_c = 48
tank_r_value = 6
pipe_insulation = 1
recirc_timer = 0
inlet_temp_c = 20
Predicted value: 97.0000
Model quality: Good fit — general trends are captured, some noise remains.
Factor importance:
1. tank_r_value (effect: 10.2, contribution: 43.2%)
2. inlet_temp_c (effect: -6.8, contribution: 28.4%)
3. pipe_insulation (effect: 4.8, contribution: 20.0%)
4. thermostat_c (effect: -1.8, contribution: 7.4%)
5. recirc_timer (effect: -0.2, contribution: 1.1%)