Summary
This experiment investigates podcast recording quality. Full factorial of mic distance, gain level, room treatment, and noise gate threshold to maximize voice clarity and minimize background noise.
The design varies 4 factors: mic dist cm (cm), ranging from 5 to 30, gain db (dB), ranging from 20 to 50, treatment pct (%), ranging from 0 to 80, and gate db (dB), ranging from -60 to -30. The goal is to optimize 2 responses: clarity score (pts) (maximize) and noise floor db (dB) (minimize). Fixed conditions held constant across all runs include mic type = large_diaphragm_condenser, sample rate = 48000.
A full factorial design was used to explore all 16 possible combinations of the 4 factors at two levels. This guarantees that every main effect and interaction can be estimated independently, at the cost of a larger experiment (16 runs).
Quadratic response surface models were fitted to capture potential curvature and factor interactions. The RSM contour plots below visualize how pairs of factors jointly affect each response.
Key Findings
For clarity score, the most influential factors were treatment pct (70.0%), mic dist cm (20.0%), gain db (10.0%). The best observed value was 8.0 (at mic dist cm = 5, gain db = 50, treatment pct = 80).
For noise floor db, the most influential factors were gain db (41.6%), gate db (36.9%), treatment pct (20.1%). The best observed value was -59.0 (at mic dist cm = 30, gain db = 50, treatment pct = 0).
Recommended Next Steps
- Consider whether any fixed factors should be varied in a future study.
Experimental Setup
Factors
| Factor | Low | High | Unit |
|---|
mic_dist_cm | 5 | 30 | cm |
gain_db | 20 | 50 | dB |
treatment_pct | 0 | 80 | % |
gate_db | -60 | -30 | dB |
Fixed: mic_type = large_diaphragm_condenser, sample_rate = 48000
Responses
| Response | Direction | Unit |
|---|
clarity_score | ↑ maximize | pts |
noise_floor_db | ↓ minimize | dB |
Configuration
{
"metadata": {
"name": "Podcast Recording Quality",
"description": "Full factorial of mic distance, gain level, room treatment, and noise gate threshold to maximize voice clarity and minimize background noise"
},
"factors": [
{
"name": "mic_dist_cm",
"levels": [
"5",
"30"
],
"type": "continuous",
"unit": "cm"
},
{
"name": "gain_db",
"levels": [
"20",
"50"
],
"type": "continuous",
"unit": "dB"
},
{
"name": "treatment_pct",
"levels": [
"0",
"80"
],
"type": "continuous",
"unit": "%"
},
{
"name": "gate_db",
"levels": [
"-60",
"-30"
],
"type": "continuous",
"unit": "dB"
}
],
"fixed_factors": {
"mic_type": "large_diaphragm_condenser",
"sample_rate": "48000"
},
"responses": [
{
"name": "clarity_score",
"optimize": "maximize",
"unit": "pts"
},
{
"name": "noise_floor_db",
"optimize": "minimize",
"unit": "dB"
}
],
"settings": {
"operation": "full_factorial",
"test_script": "use_cases/160_podcast_recording/sim.sh"
}
}
Experimental Matrix
The Full Factorial Design produces 16 runs. Each row is one experiment with specific factor settings.
| Run | mic_dist_cm | gain_db | treatment_pct | gate_db |
|---|
| 1 | 5 | 50 | 80 | -30 |
| 2 | 30 | 20 | 0 | -30 |
| 3 | 5 | 50 | 0 | -30 |
| 4 | 5 | 50 | 80 | -60 |
| 5 | 30 | 50 | 80 | -60 |
| 6 | 30 | 20 | 80 | -60 |
| 7 | 30 | 50 | 0 | -60 |
| 8 | 30 | 20 | 0 | -60 |
| 9 | 5 | 20 | 0 | -30 |
| 10 | 5 | 20 | 80 | -60 |
| 11 | 30 | 50 | 0 | -30 |
| 12 | 30 | 50 | 80 | -30 |
| 13 | 5 | 50 | 0 | -60 |
| 14 | 30 | 20 | 80 | -30 |
| 15 | 5 | 20 | 0 | -60 |
| 16 | 5 | 20 | 80 | -30 |
Step-by-Step Workflow
1
Preview the design
$ doe info --config use_cases/160_podcast_recording/config.json
2
Generate the runner script
$ doe generate --config use_cases/160_podcast_recording/config.json \
--output use_cases/160_podcast_recording/results/run.sh --seed 42
3
Execute the experiments
$ bash use_cases/160_podcast_recording/results/run.sh
4
Analyze results
$ doe analyze --config use_cases/160_podcast_recording/config.json
5
Get optimization recommendations
$ doe optimize --config use_cases/160_podcast_recording/config.json
6
Multi-objective optimization
With 2 competing responses, use --multi to find the best compromise via Derringer–Suich desirability.
$ doe optimize --config use_cases/160_podcast_recording/config.json --multi
7
Generate the HTML report
$ doe report --config use_cases/160_podcast_recording/config.json \
--output use_cases/160_podcast_recording/results/report.html
Features Exercised
| Feature | Value |
|---|
| Design type | full_factorial |
| Factor types | continuous (all 4) |
| Arg style | double-dash |
| Responses | 2 (clarity_score ↑, noise_floor_db ↓) |
| Total runs | 16 |
Analysis Results
Generated from actual experiment runs using the DOE Helper Tool.
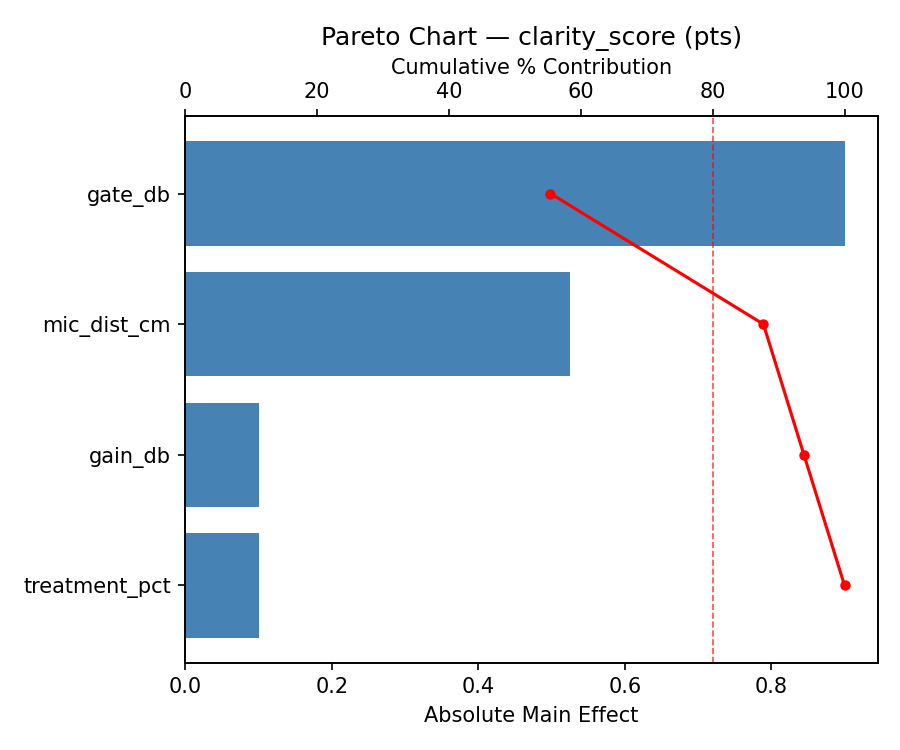
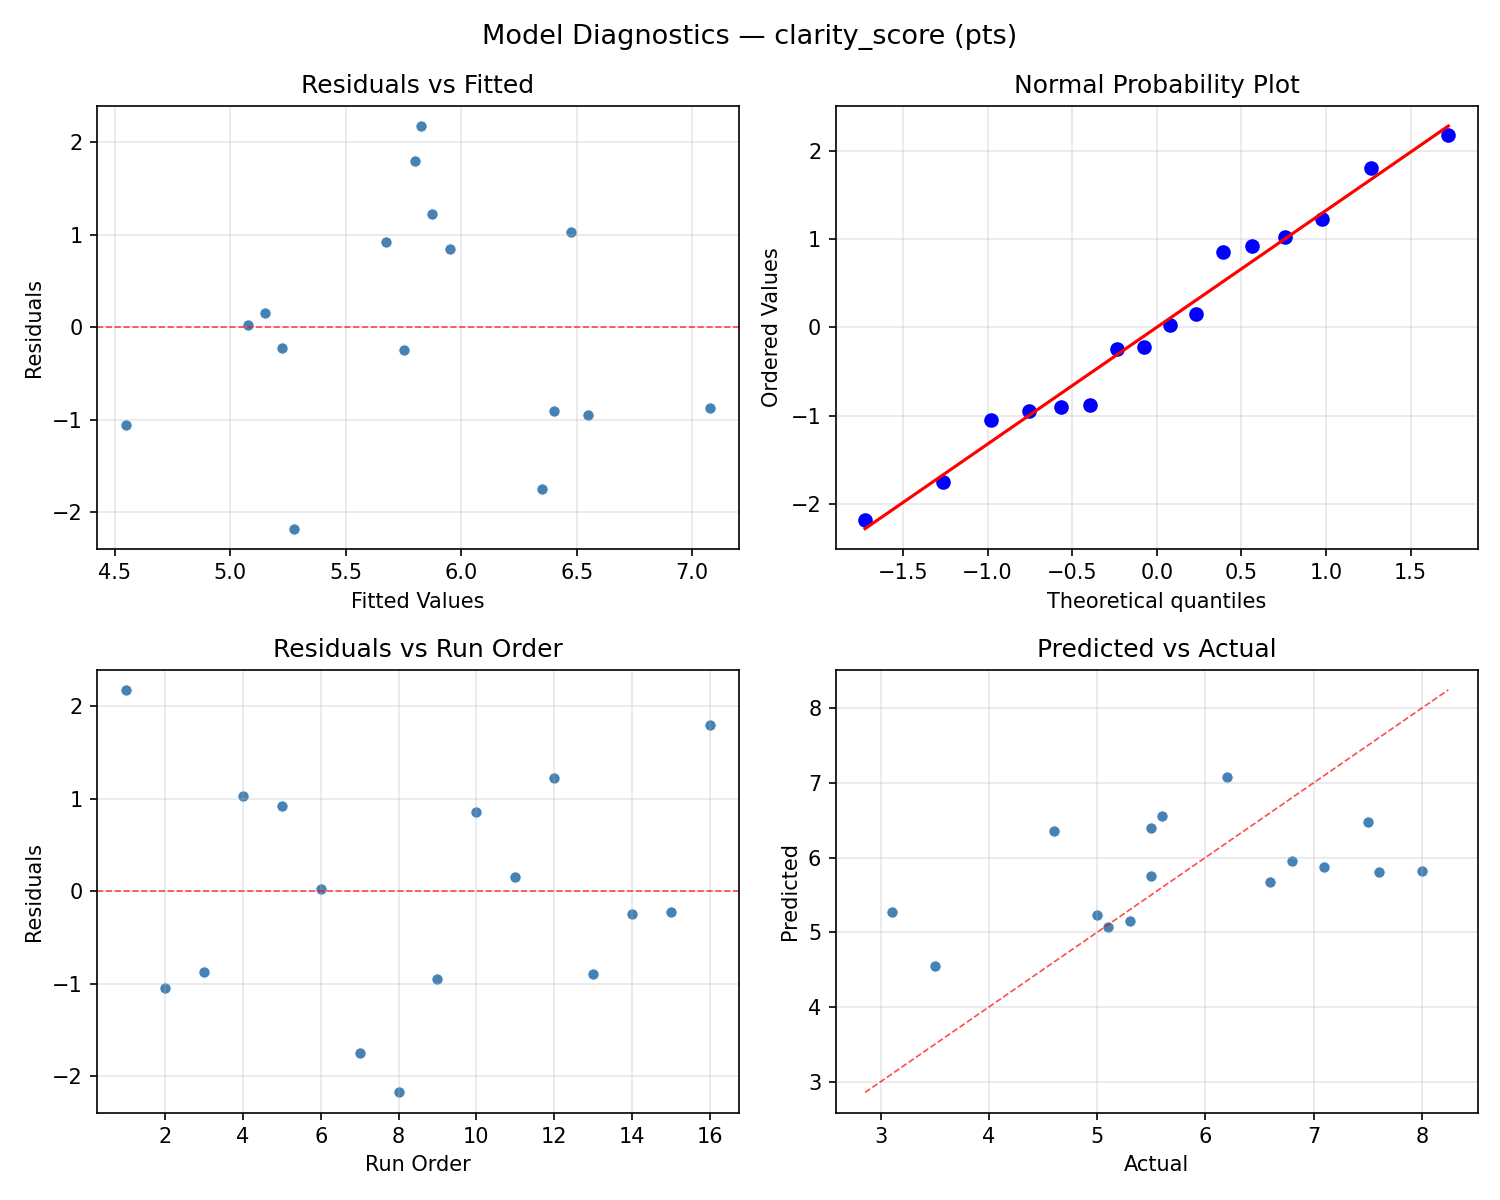
Response: clarity_score
Top factors: treatment_pct (70.0%), mic_dist_cm (20.0%), gain_db (10.0%).
ANOVA
| Source | DF | SS | MS | F | p-value |
|---|
| Source | DF | SS | MS | F | p-value |
| mic_dist_cm | 1 | 0.6400 | 0.6400 | 0.230 | 0.6519 |
| gain_db | 1 | 0.1600 | 0.1600 | 0.057 | 0.8201 |
| treatment_pct | 1 | 7.8400 | 7.8400 | 2.816 | 0.1542 |
| gate_db | 1 | 0.0000 | 0.0000 | 0.000 | 1.0000 |
| mic_dist_cm*gain_db | 1 | 0.7225 | 0.7225 | 0.259 | 0.6322 |
| mic_dist_cm*treatment_pct | 1 | 0.9025 | 0.9025 | 0.324 | 0.5938 |
| mic_dist_cm*gate_db | 1 | 5.0625 | 5.0625 | 1.818 | 0.2354 |
| gain_db*treatment_pct | 1 | 0.2025 | 0.2025 | 0.073 | 0.7982 |
| gain_db*gate_db | 1 | 0.2025 | 0.2025 | 0.073 | 0.7982 |
| treatment_pct*gate_db | 1 | 0.4225 | 0.4225 | 0.152 | 0.7129 |
| Error | 5 | 13.9225 | 2.7845 | | |
| Total | 15 | 30.0775 | 2.0052 | | |
Pareto Chart
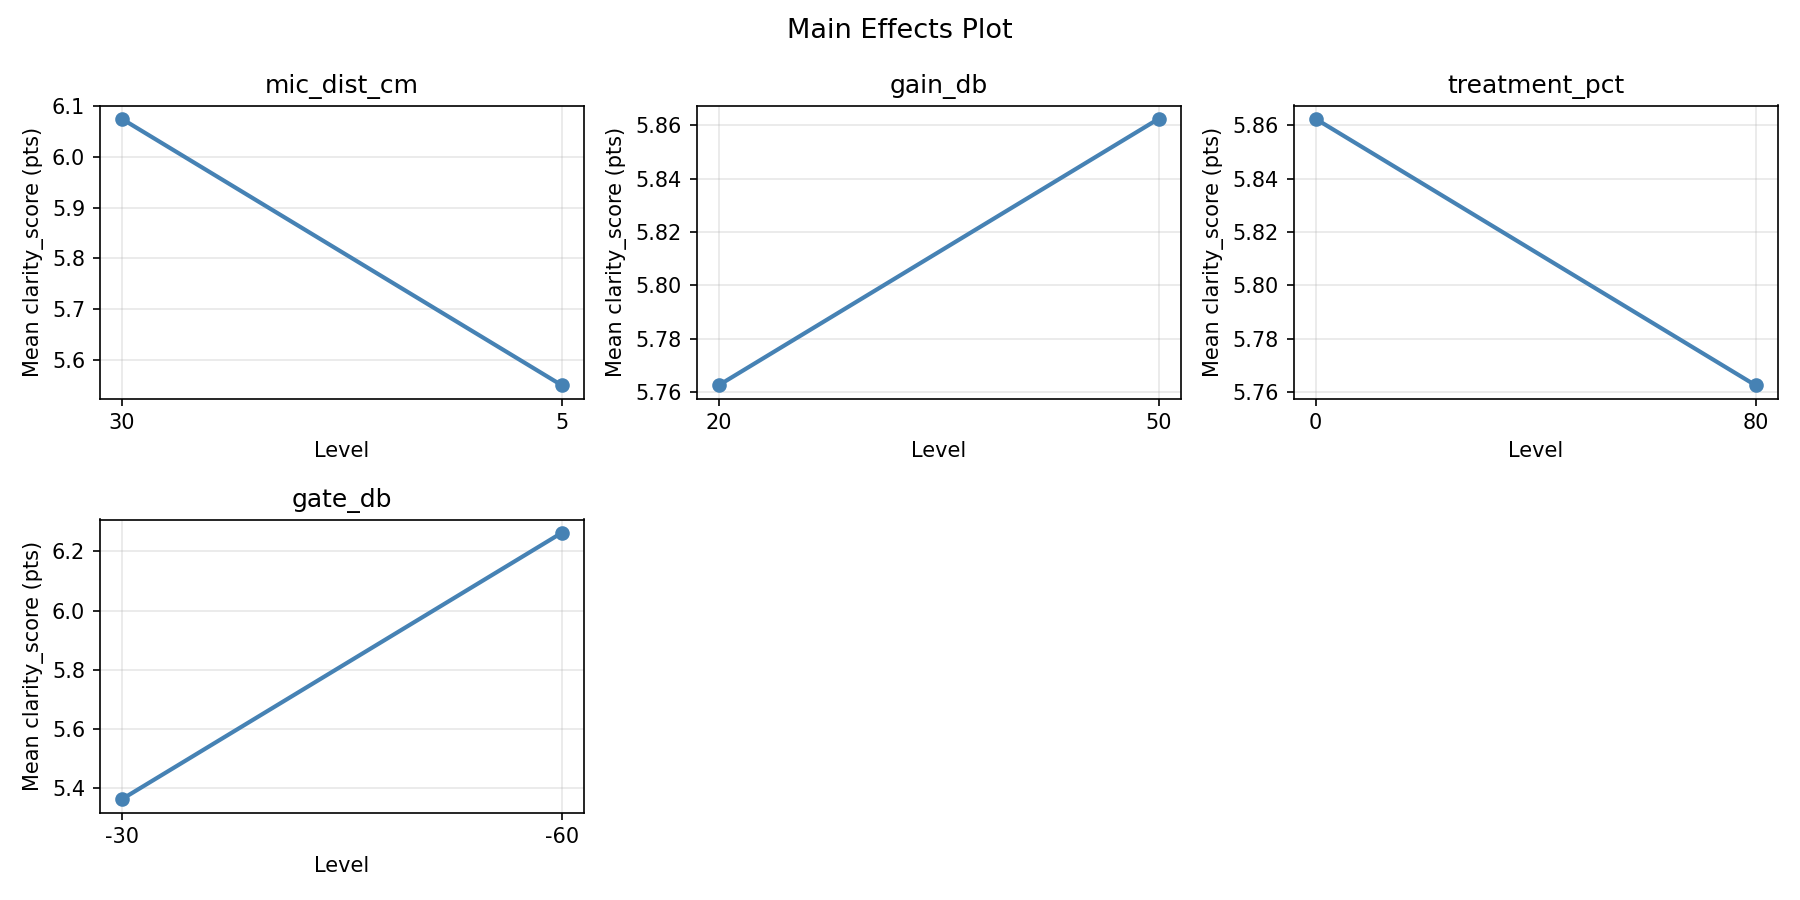
Main Effects Plot
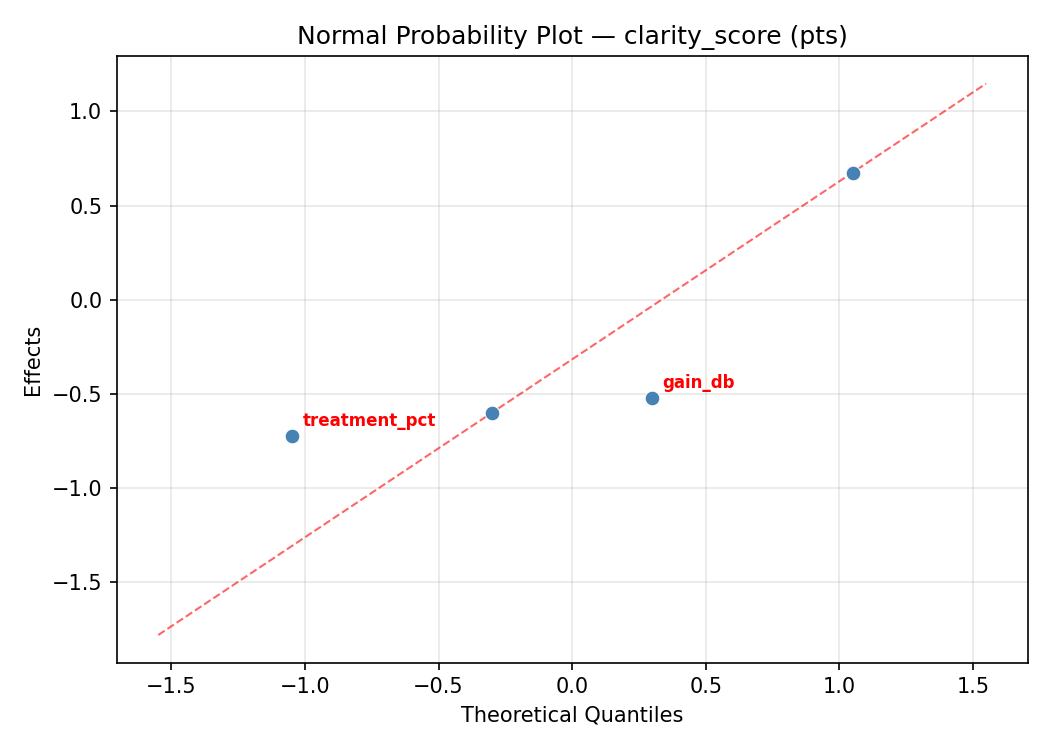
Normal Probability Plot of Effects
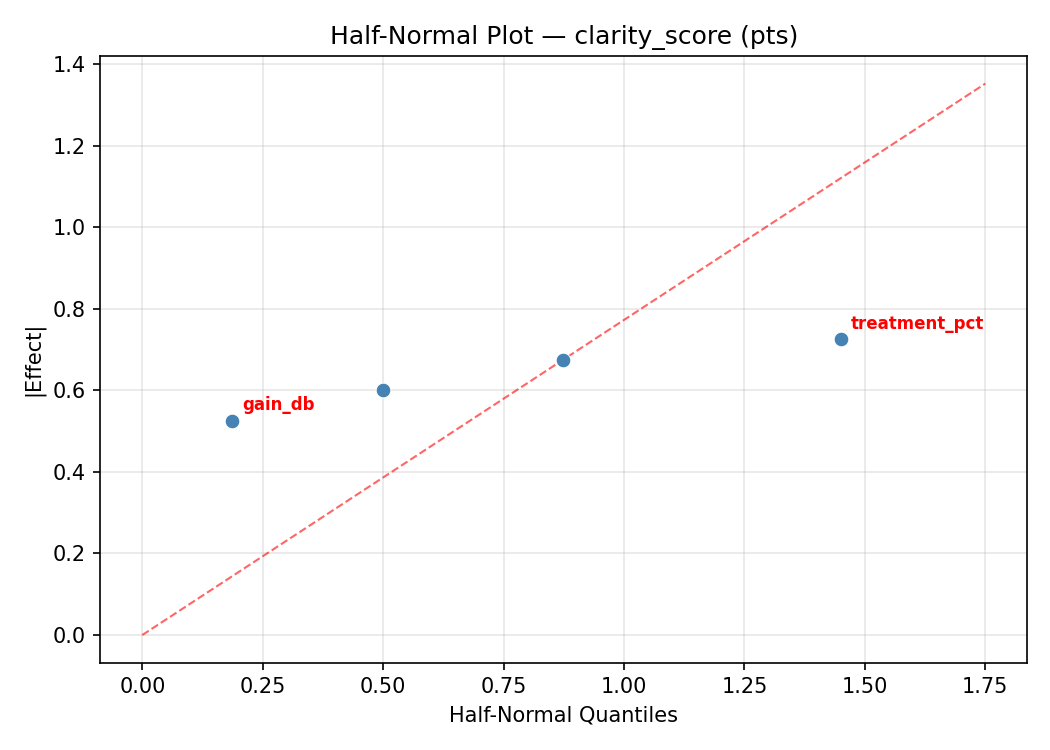
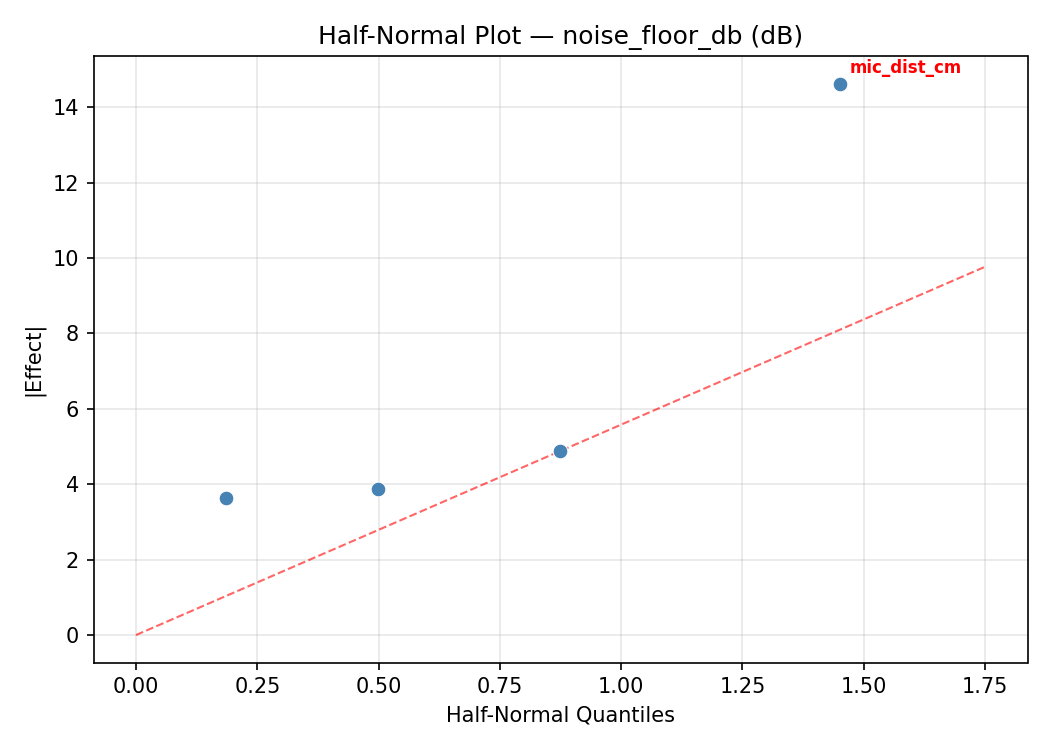
Half-Normal Plot of Effects
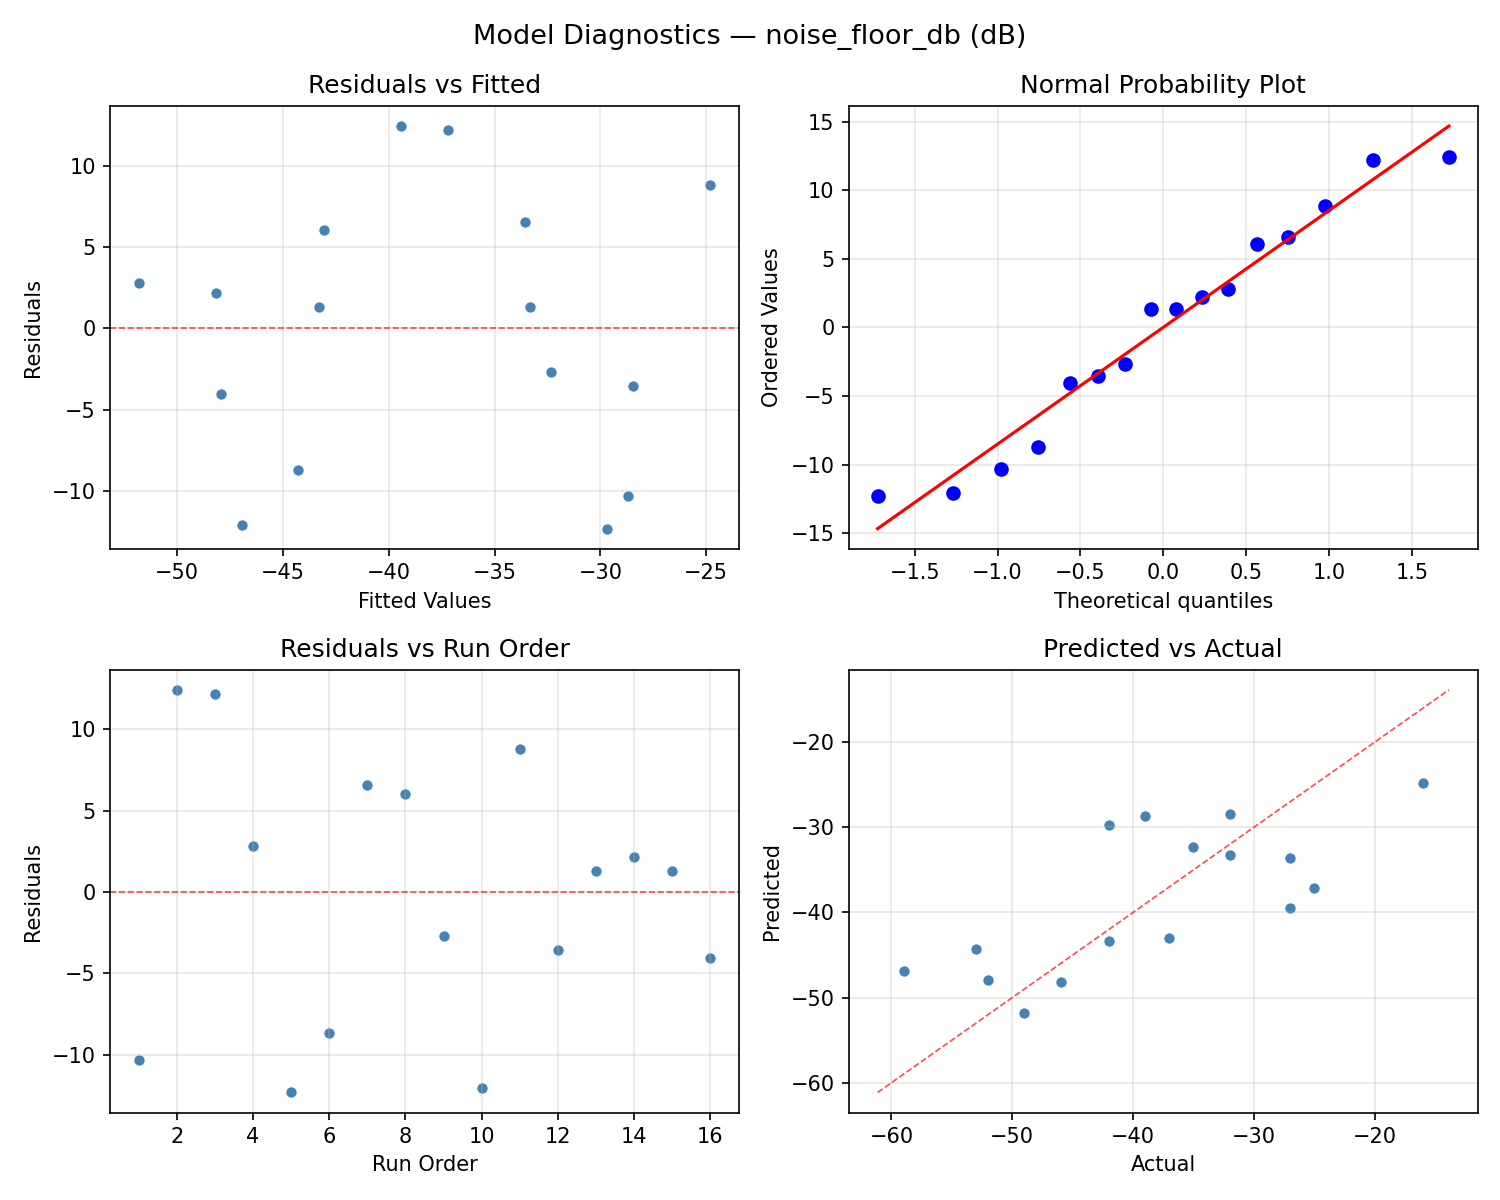
Model Diagnostics
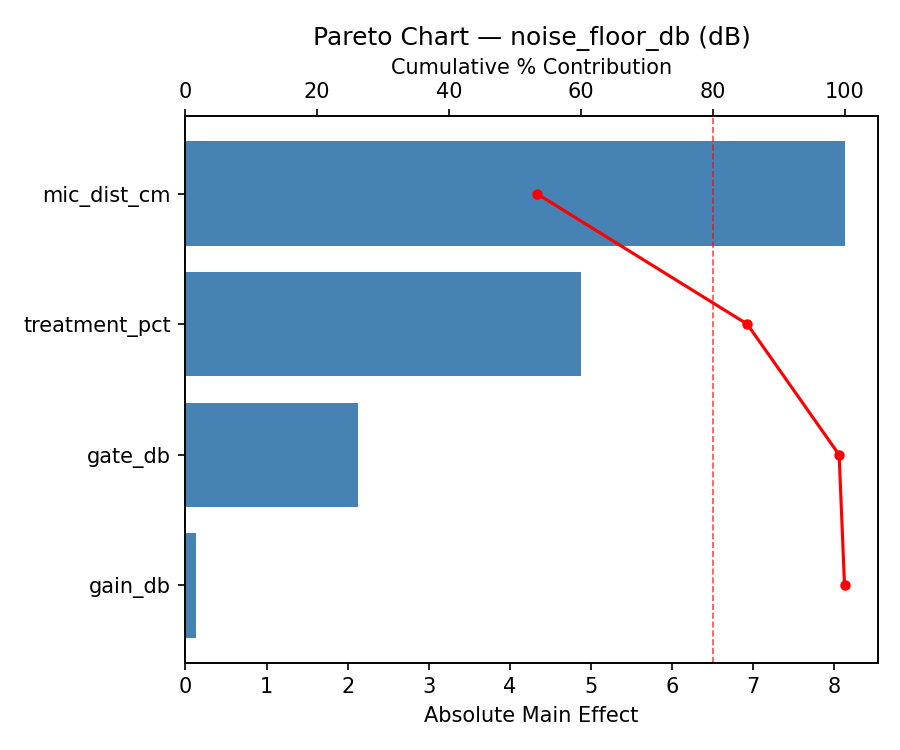
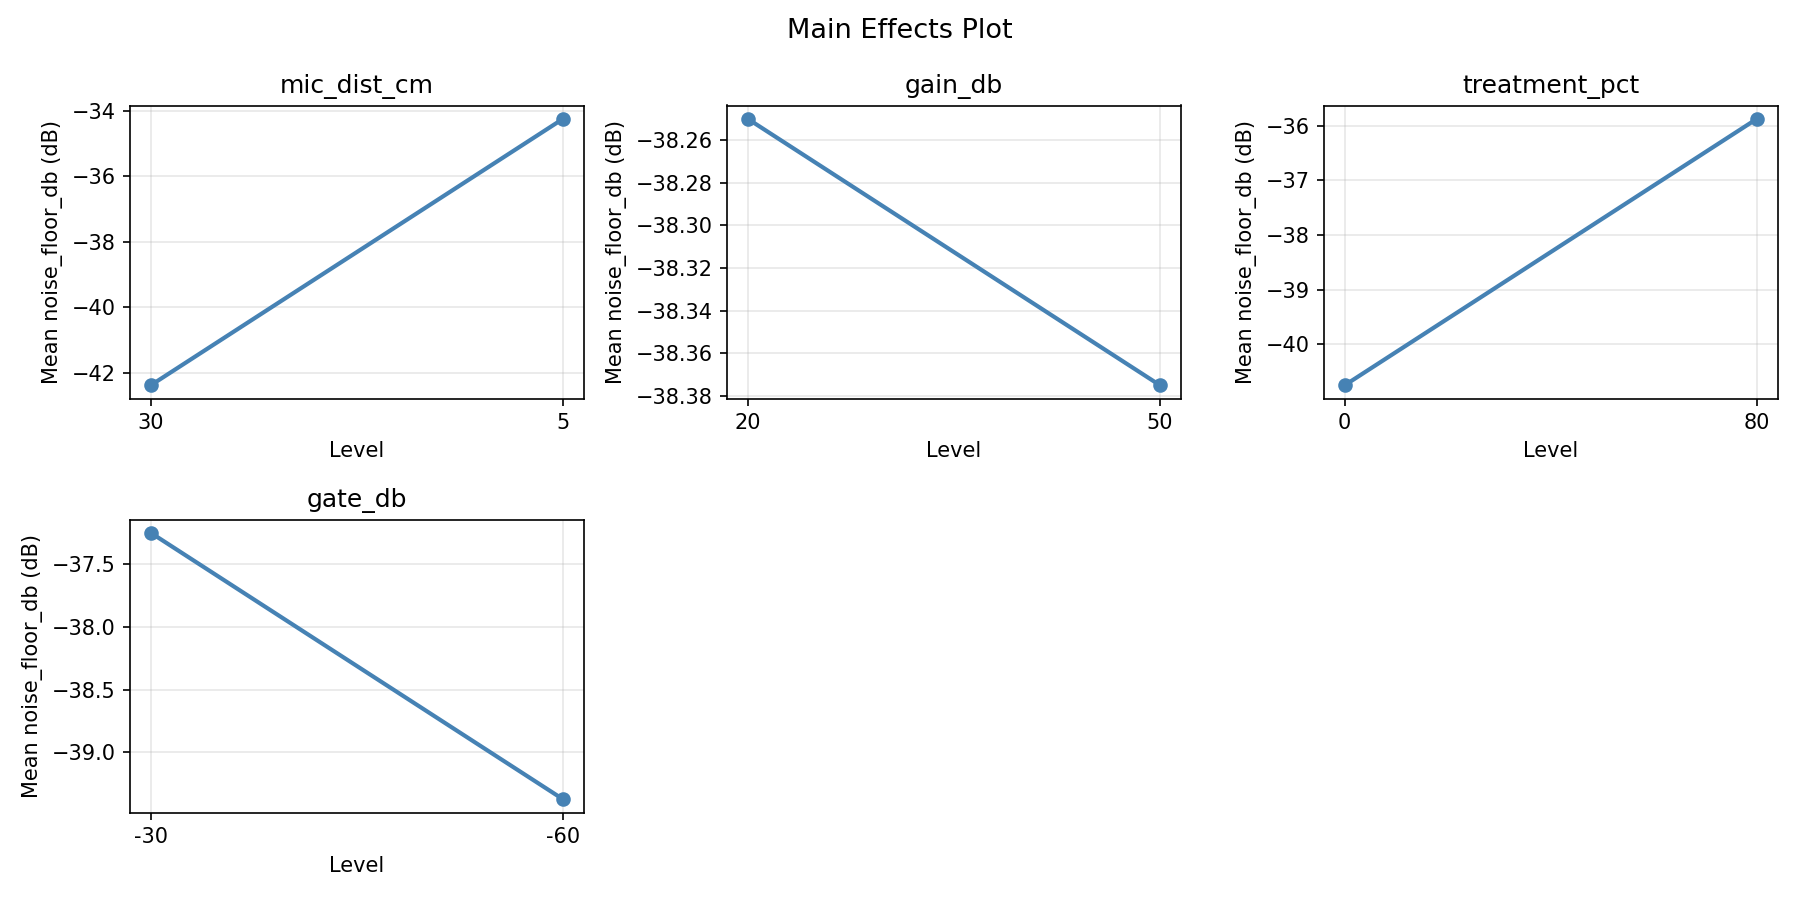
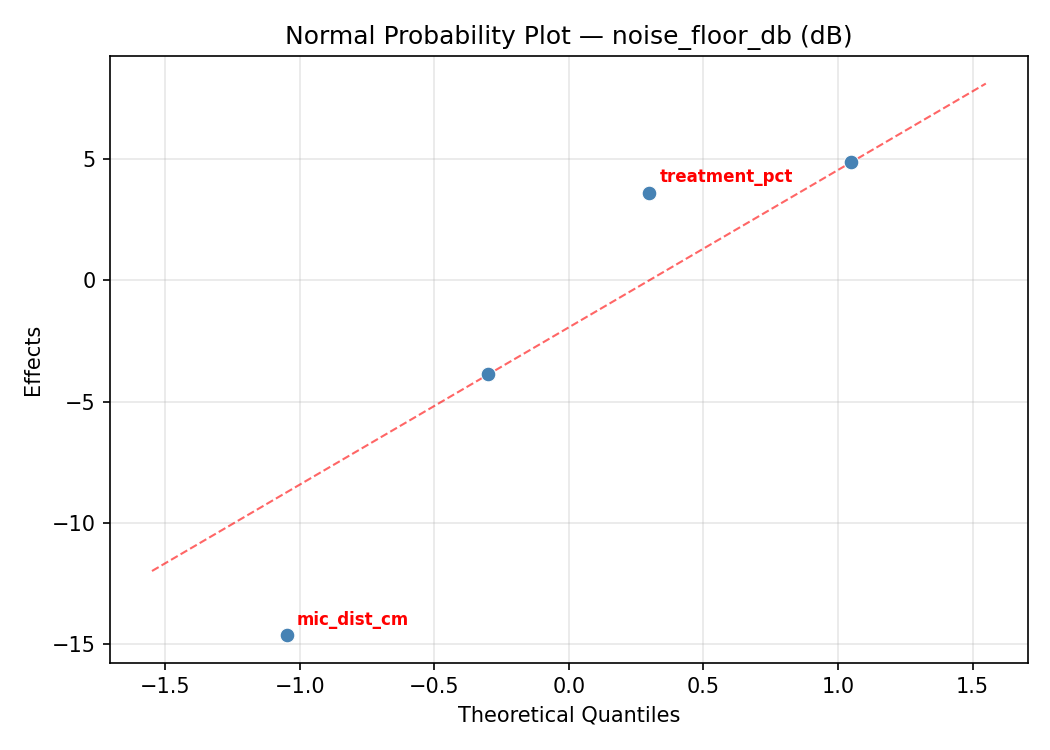
Response: noise_floor_db
Top factors: gain_db (41.6%), gate_db (36.9%), treatment_pct (20.1%).
ANOVA
| Source | DF | SS | MS | F | p-value |
|---|
| Source | DF | SS | MS | F | p-value |
| mic_dist_cm | 1 | 0.5625 | 0.5625 | 0.009 | 0.9276 |
| gain_db | 1 | 495.0625 | 495.0625 | 8.042 | 0.0364 |
| treatment_pct | 1 | 115.5625 | 115.5625 | 1.877 | 0.2290 |
| gate_db | 1 | 390.0625 | 390.0625 | 6.336 | 0.0534 |
| mic_dist_cm*gain_db | 1 | 175.5625 | 175.5625 | 2.852 | 0.1521 |
| mic_dist_cm*treatment_pct | 1 | 10.5625 | 10.5625 | 0.172 | 0.6959 |
| mic_dist_cm*gate_db | 1 | 14.0625 | 14.0625 | 0.228 | 0.6529 |
| gain_db*treatment_pct | 1 | 390.0625 | 390.0625 | 6.336 | 0.0534 |
| gain_db*gate_db | 1 | 18.0625 | 18.0625 | 0.293 | 0.6113 |
| treatment_pct*gate_db | 1 | 138.0625 | 138.0625 | 2.243 | 0.1945 |
| Error | 5 | 307.8125 | 61.5625 | | |
| Total | 15 | 2055.4375 | 137.0292 | | |
Pareto Chart
Main Effects Plot
Normal Probability Plot of Effects
Half-Normal Plot of Effects
Model Diagnostics
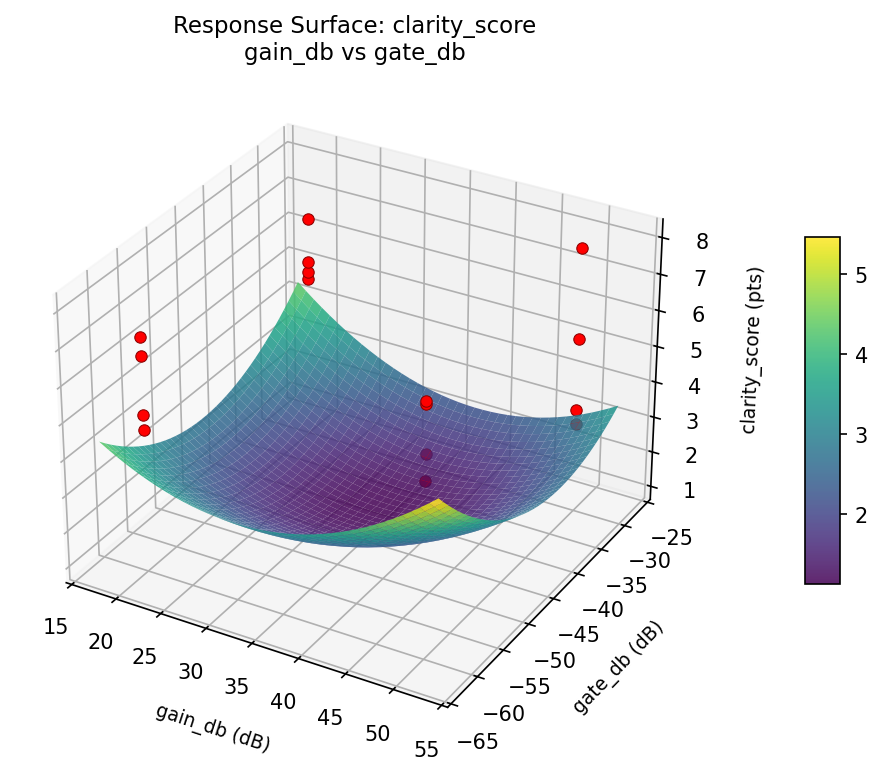
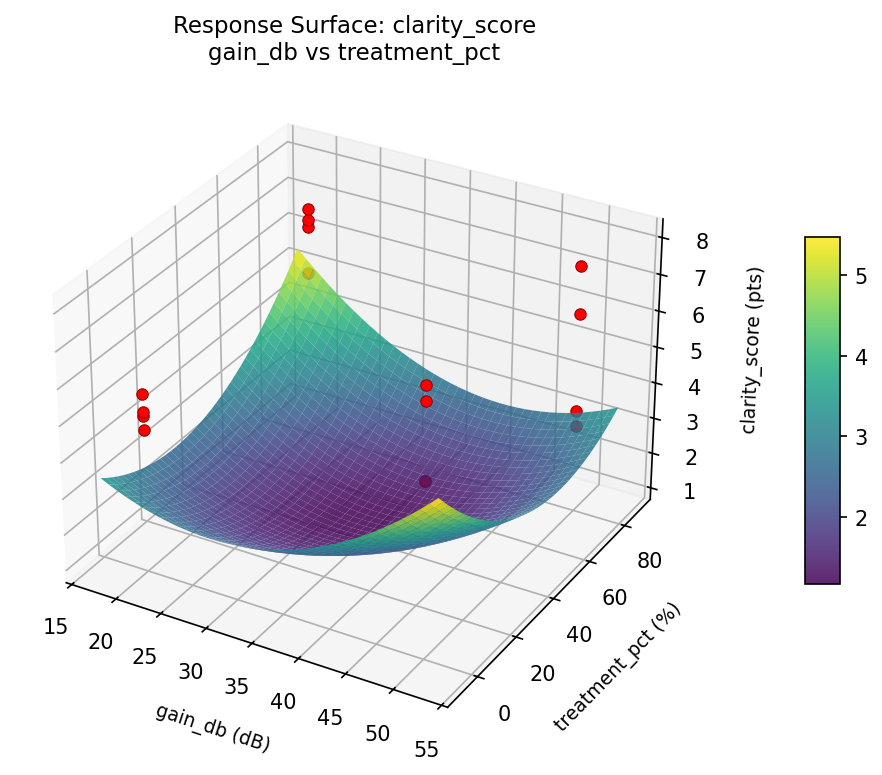
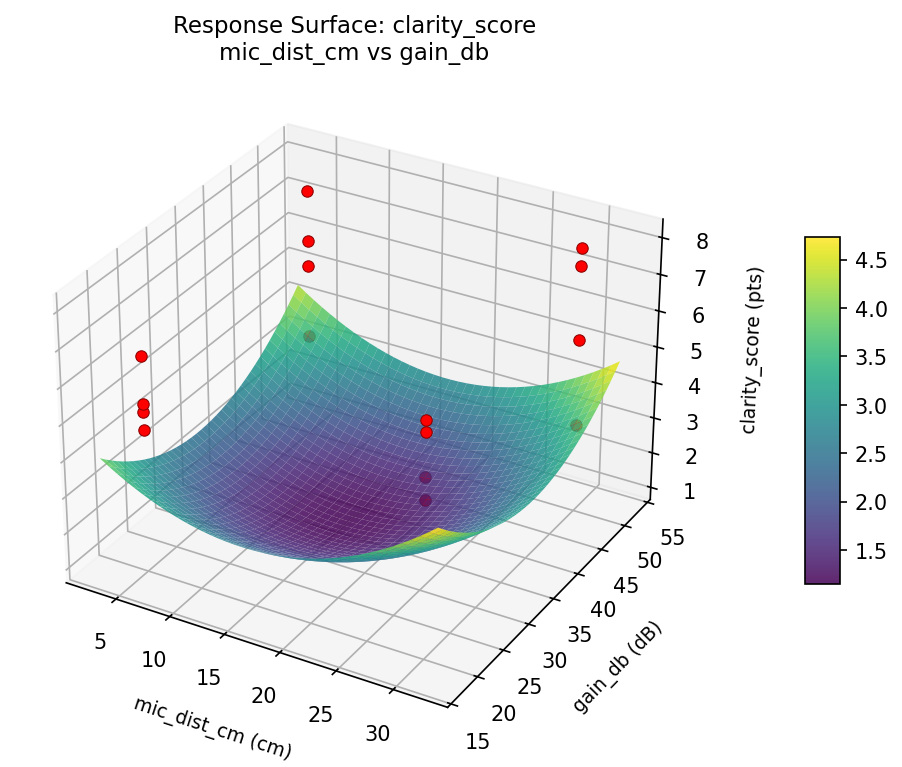
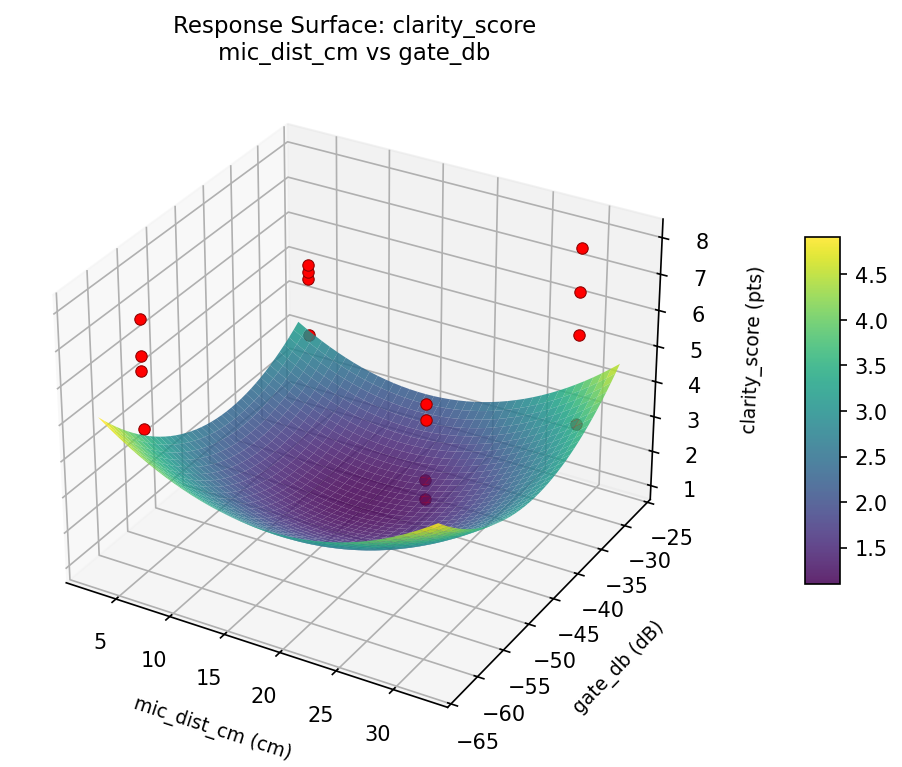
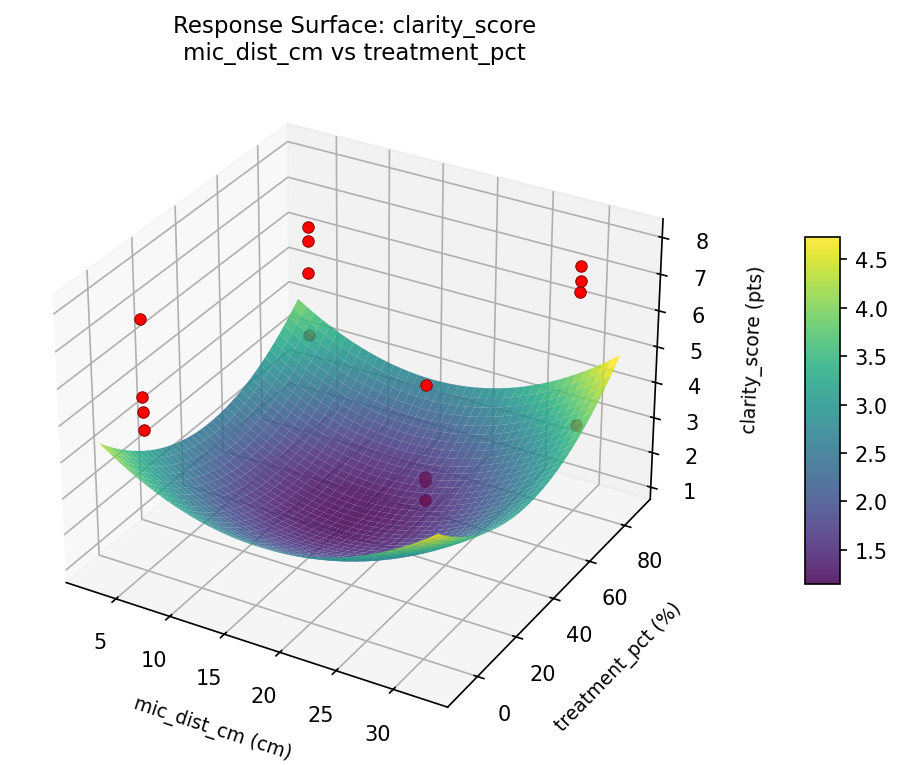
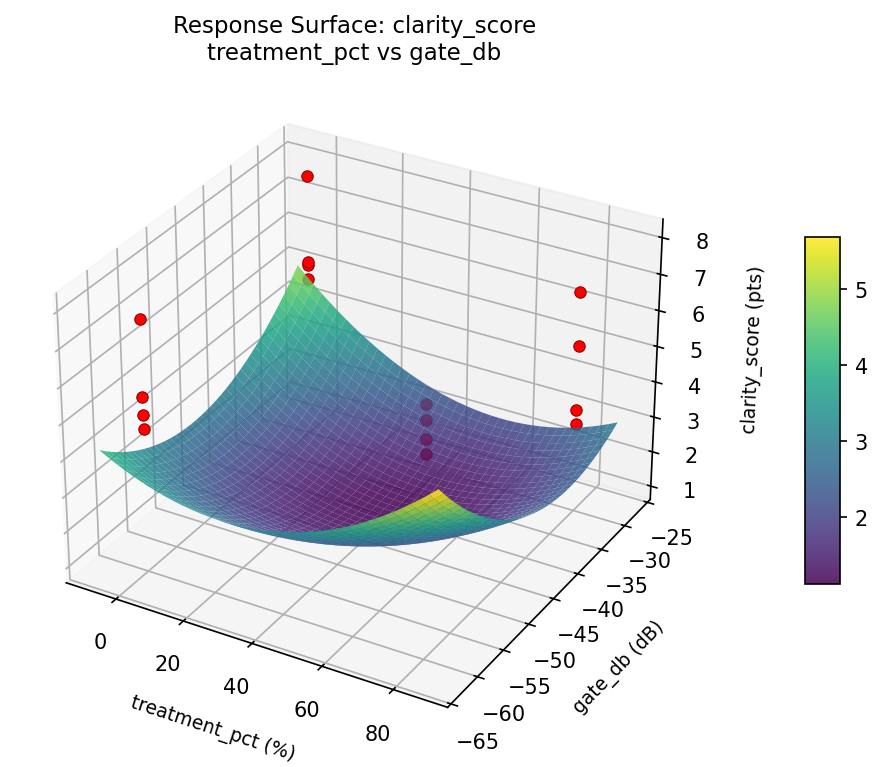
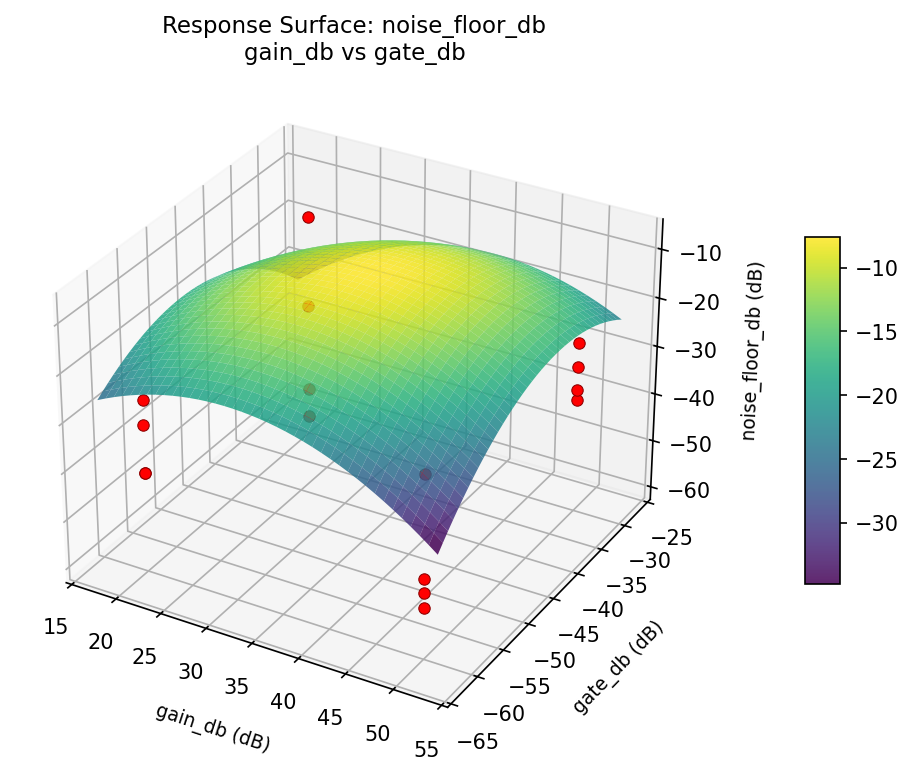
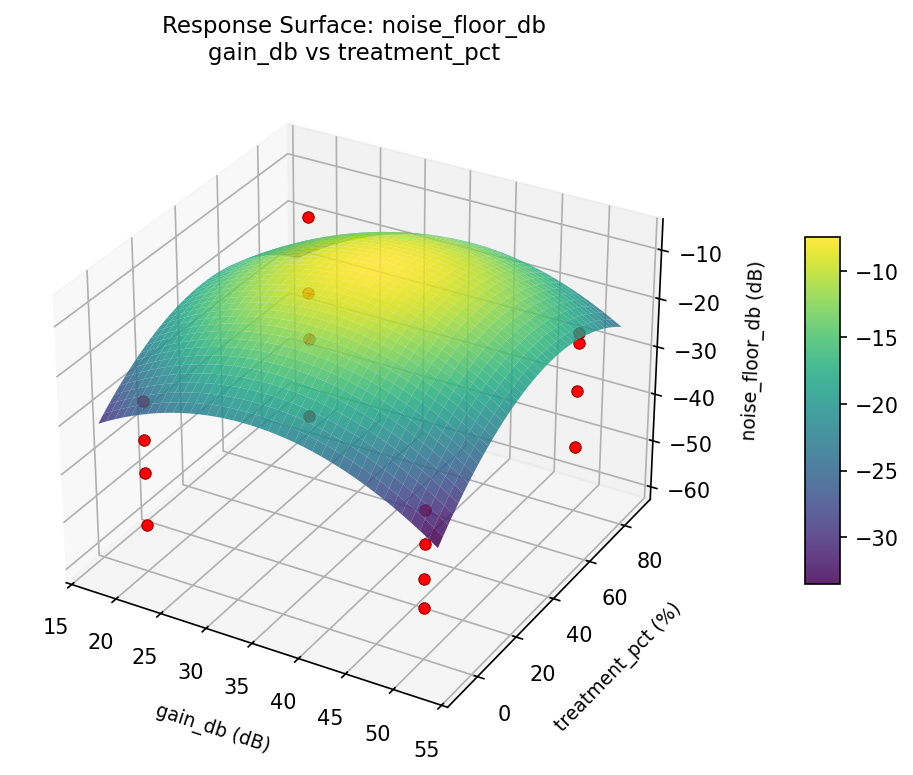
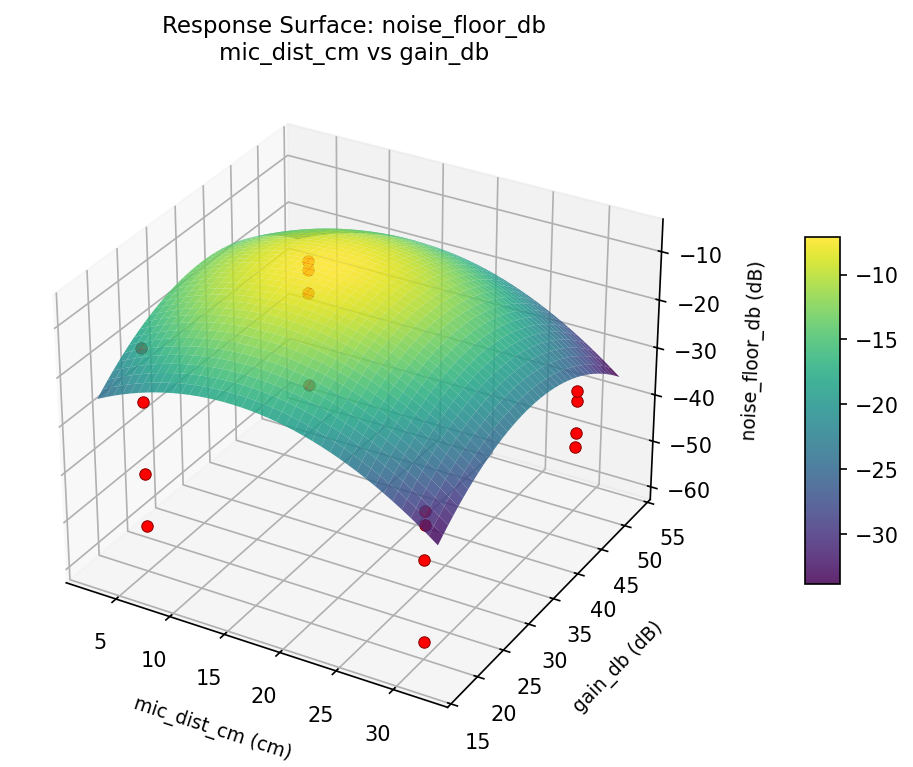
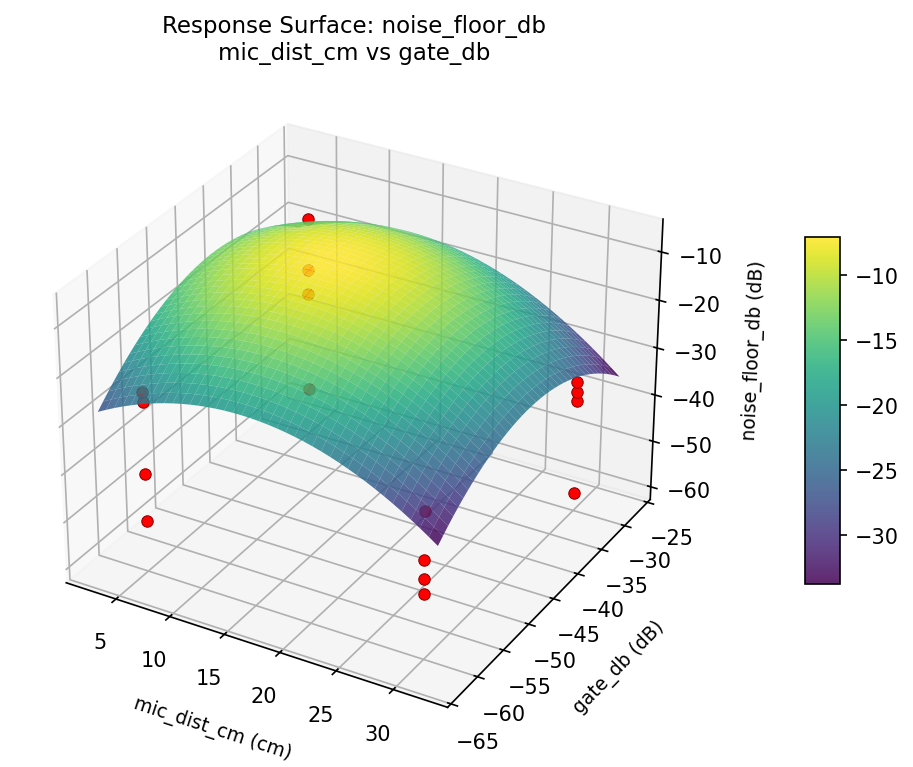
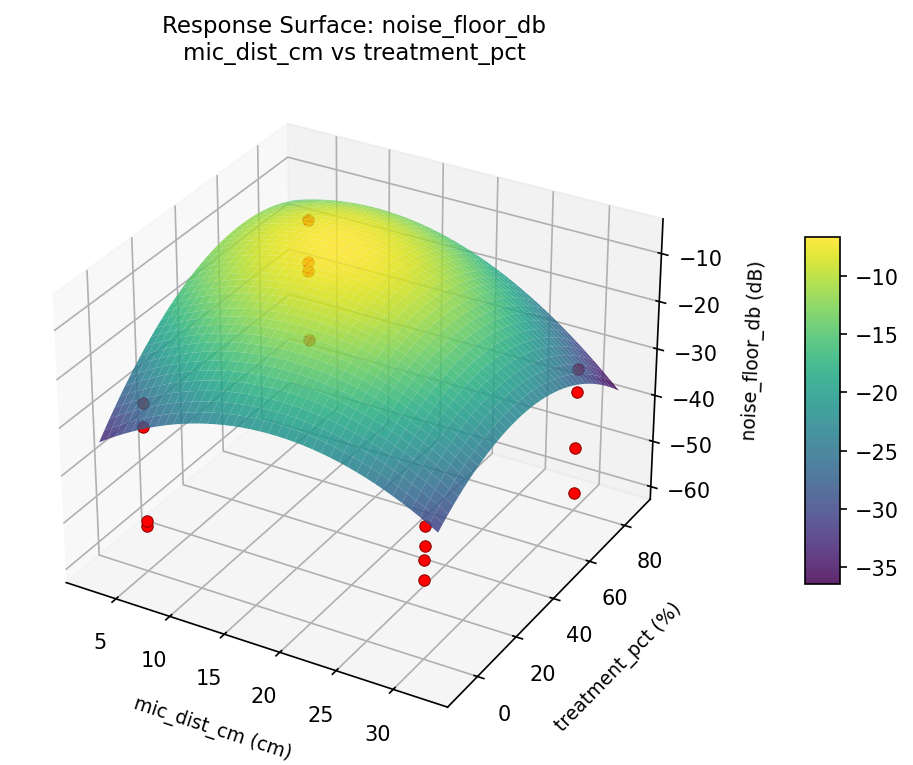
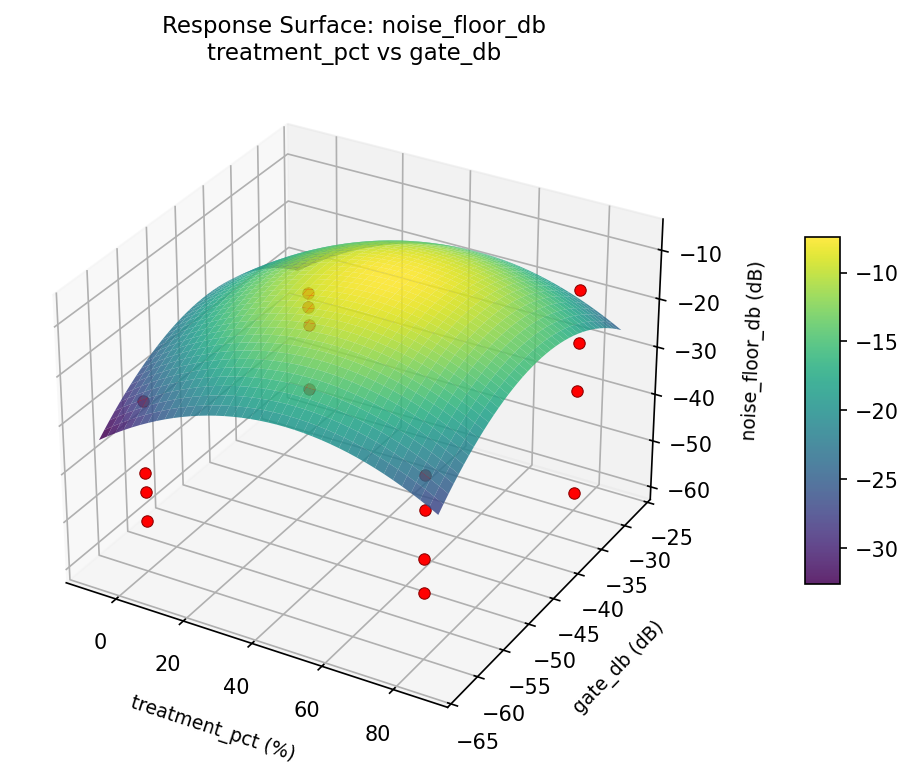
Response Surface Plots
3D surfaces fitted with quadratic RSM. Red dots are observed data points.
clarity score gain db vs gate db
clarity score gain db vs treatment pct
clarity score mic dist cm vs gain db
clarity score mic dist cm vs gate db
clarity score mic dist cm vs treatment pct
clarity score treatment pct vs gate db
noise floor db gain db vs gate db
noise floor db gain db vs treatment pct
noise floor db mic dist cm vs gain db
noise floor db mic dist cm vs gate db
noise floor db mic dist cm vs treatment pct
noise floor db treatment pct vs gate db
Multi-Objective Optimization
When responses compete, Derringer–Suich desirability finds the best compromise.
Each response is scaled to a 0–1 desirability, then combined via a weighted geometric mean.
Overall Desirability
D = 0.8500
Per-Response Desirability
| Response | Weight | Desirability | Predicted | Dir |
|---|
clarity_score |
1.5 |
|
7.60 0.8803 7.60 pts |
↑ |
noise_floor_db |
1.0 |
|
-52.00 0.8066 -52.00 dB |
↓ |
Recommended Settings
| Factor | Value |
|---|
mic_dist_cm | 30 cm |
gain_db | 50 dB |
treatment_pct | 80 % |
gate_db | -30 dB |
Source: from observed run #16
Trade-off Summary
Sacrifice = how much worse than single-objective best.
| Response | Predicted | Best Observed | Sacrifice |
|---|
noise_floor_db | -52.00 | -59.00 | +7.00 |
Top 3 Runs by Desirability
| Run | D | Factor Settings |
|---|
| #10 | 0.8139 | mic_dist_cm=5, gain_db=20, treatment_pct=80, gate_db=-30 |
| #4 | 0.8122 | mic_dist_cm=30, gain_db=50, treatment_pct=80, gate_db=-60 |
Model Quality
| Response | R² | Type |
|---|
noise_floor_db | 0.0904 | linear |
Full Multi-Objective Output
============================================================
MULTI-OBJECTIVE OPTIMIZATION
Method: Derringer-Suich Desirability Function
============================================================
Overall desirability: D = 0.8500
Response Weight Desirability Predicted Direction
---------------------------------------------------------------------
clarity_score 1.5 0.8803 7.60 pts ↑
noise_floor_db 1.0 0.8066 -52.00 dB ↓
Recommended settings:
mic_dist_cm = 30 cm
gain_db = 50 dB
treatment_pct = 80 %
gate_db = -30 dB
(from observed run #16)
Trade-off summary:
clarity_score: 7.60 (best observed: 8.00, sacrifice: +0.40)
noise_floor_db: -52.00 (best observed: -59.00, sacrifice: +7.00)
Model quality:
clarity_score: R² = 0.1978 (linear)
noise_floor_db: R² = 0.0904 (linear)
Top 3 observed runs by overall desirability:
1. Run #16 (D=0.8500): mic_dist_cm=30, gain_db=50, treatment_pct=80, gate_db=-30
2. Run #10 (D=0.8139): mic_dist_cm=5, gain_db=20, treatment_pct=80, gate_db=-30
3. Run #4 (D=0.8122): mic_dist_cm=30, gain_db=50, treatment_pct=80, gate_db=-60
Full Analysis Output
=== Main Effects: clarity_score ===
Factor Effect Std Error % Contribution
--------------------------------------------------------------
treatment_pct -1.4000 0.3540 70.0%
mic_dist_cm 0.4000 0.3540 20.0%
gain_db 0.2000 0.3540 10.0%
gate_db 0.0000 0.3540 0.0%
=== ANOVA Table: clarity_score ===
Source DF SS MS F p-value
-----------------------------------------------------------------------------
mic_dist_cm 1 0.6400 0.6400 0.230 0.6519
gain_db 1 0.1600 0.1600 0.057 0.8201
treatment_pct 1 7.8400 7.8400 2.816 0.1542
gate_db 1 0.0000 0.0000 0.000 1.0000
mic_dist_cm*gain_db 1 0.7225 0.7225 0.259 0.6322
mic_dist_cm*treatment_pct 1 0.9025 0.9025 0.324 0.5938
mic_dist_cm*gate_db 1 5.0625 5.0625 1.818 0.2354
gain_db*treatment_pct 1 0.2025 0.2025 0.073 0.7982
gain_db*gate_db 1 0.2025 0.2025 0.073 0.7982
treatment_pct*gate_db 1 0.4225 0.4225 0.152 0.7129
Error 5 13.9225 2.7845
Total 15 30.0775 2.0052
=== Interaction Effects: clarity_score ===
Factor A Factor B Interaction % Contribution
------------------------------------------------------------------------
mic_dist_cm gate_db -1.1250 40.2%
mic_dist_cm treatment_pct -0.4750 17.0%
mic_dist_cm gain_db 0.4250 15.2%
treatment_pct gate_db 0.3250 11.6%
gain_db treatment_pct 0.2250 8.0%
gain_db gate_db -0.2250 8.0%
=== Summary Statistics: clarity_score ===
mic_dist_cm:
Level N Mean Std Min Max
------------------------------------------------------------
30 8 5.6125 1.3840 3.5000 7.5000
5 8 6.0125 1.5132 3.1000 8.0000
gain_db:
Level N Mean Std Min Max
------------------------------------------------------------
20 8 5.7125 1.7266 3.1000 7.6000
50 8 5.9125 1.1370 4.6000 8.0000
treatment_pct:
Level N Mean Std Min Max
------------------------------------------------------------
0 8 6.5125 1.0776 5.1000 8.0000
80 8 5.1125 1.4197 3.1000 7.5000
gate_db:
Level N Mean Std Min Max
------------------------------------------------------------
-30 8 5.8125 1.3994 3.5000 8.0000
-60 8 5.8125 1.5292 3.1000 7.6000
=== Main Effects: noise_floor_db ===
Factor Effect Std Error % Contribution
--------------------------------------------------------------
gain_db 11.1250 2.9265 41.6%
gate_db -9.8750 2.9265 36.9%
treatment_pct 5.3750 2.9265 20.1%
mic_dist_cm -0.3750 2.9265 1.4%
=== ANOVA Table: noise_floor_db ===
Source DF SS MS F p-value
-----------------------------------------------------------------------------
mic_dist_cm 1 0.5625 0.5625 0.009 0.9276
gain_db 1 495.0625 495.0625 8.042 0.0364
treatment_pct 1 115.5625 115.5625 1.877 0.2290
gate_db 1 390.0625 390.0625 6.336 0.0534
mic_dist_cm*gain_db 1 175.5625 175.5625 2.852 0.1521
mic_dist_cm*treatment_pct 1 10.5625 10.5625 0.172 0.6959
mic_dist_cm*gate_db 1 14.0625 14.0625 0.228 0.6529
gain_db*treatment_pct 1 390.0625 390.0625 6.336 0.0534
gain_db*gate_db 1 18.0625 18.0625 0.293 0.6113
treatment_pct*gate_db 1 138.0625 138.0625 2.243 0.1945
Error 5 307.8125 61.5625
Total 15 2055.4375 137.0292
=== Interaction Effects: noise_floor_db ===
Factor A Factor B Interaction % Contribution
------------------------------------------------------------------------
gain_db treatment_pct -9.8750 35.3%
mic_dist_cm gain_db -6.6250 23.7%
treatment_pct gate_db -5.8750 21.0%
gain_db gate_db -2.1250 7.6%
mic_dist_cm gate_db 1.8750 6.7%
mic_dist_cm treatment_pct 1.6250 5.8%
=== Summary Statistics: noise_floor_db ===
mic_dist_cm:
Level N Mean Std Min Max
------------------------------------------------------------
30 8 -38.1250 14.9517 -59.0000 -16.0000
5 8 -38.5000 8.3666 -52.0000 -25.0000
gain_db:
Level N Mean Std Min Max
------------------------------------------------------------
20 8 -43.8750 11.2178 -59.0000 -27.0000
50 8 -32.7500 9.8525 -46.0000 -16.0000
treatment_pct:
Level N Mean Std Min Max
------------------------------------------------------------
0 8 -41.0000 13.8151 -59.0000 -16.0000
80 8 -35.6250 9.2880 -49.0000 -25.0000
gate_db:
Level N Mean Std Min Max
------------------------------------------------------------
-30 8 -33.3750 13.1902 -59.0000 -16.0000
-60 8 -43.2500 7.9955 -53.0000 -32.0000
Optimization Recommendations
=== Optimization: clarity_score ===
Direction: maximize
Best observed run: #1
mic_dist_cm = 5
gain_db = 50
treatment_pct = 80
gate_db = -60
Value: 8.0
RSM Model (linear, R² = 0.2022, Adj R² = -0.0879):
Coefficients:
intercept +5.8125
mic_dist_cm +0.0500
gain_db -0.1000
treatment_pct +0.6000
gate_db -0.0875
RSM Model (quadratic, R² = 0.6869, Adj R² = -3.6966):
Coefficients:
intercept +1.1625
mic_dist_cm +0.0500
gain_db -0.1000
treatment_pct +0.6000
gate_db -0.0875
mic_dist_cm*gain_db +0.7375
mic_dist_cm*treatment_pct -0.1625
mic_dist_cm*gate_db +0.1000
gain_db*treatment_pct +0.1125
gain_db*gate_db -0.1250
treatment_pct*gate_db -0.5500
mic_dist_cm^2 +1.1625
gain_db^2 +1.1625
treatment_pct^2 +1.1625
gate_db^2 +1.1625
Curvature analysis:
treatment_pct coef=+1.1625 convex (has a minimum)
mic_dist_cm coef=+1.1625 convex (has a minimum)
gain_db coef=+1.1625 convex (has a minimum)
gate_db coef=+1.1625 convex (has a minimum)
Notable interactions:
mic_dist_cm*gain_db coef=+0.7375 (synergistic)
treatment_pct*gate_db coef=-0.5500 (antagonistic)
Predicted optimum (from linear model, at observed points):
mic_dist_cm = 30
gain_db = 20
treatment_pct = 80
gate_db = -60
Predicted value: 6.6500
Surface optimum (via L-BFGS-B, linear model):
mic_dist_cm = 30
gain_db = 20
treatment_pct = 80
gate_db = -60
Predicted value: 6.6500
Model quality: Weak fit — consider adding center points or using a different design.
Factor importance:
1. treatment_pct (effect: 1.2, contribution: 71.6%)
2. gain_db (effect: -0.2, contribution: 11.9%)
3. gate_db (effect: 0.2, contribution: 10.4%)
4. mic_dist_cm (effect: -0.1, contribution: 6.0%)
=== Optimization: noise_floor_db ===
Direction: minimize
Best observed run: #10
mic_dist_cm = 30
gain_db = 50
treatment_pct = 0
gate_db = -30
Value: -59.0
RSM Model (linear, R² = 0.2777, Adj R² = 0.0150):
Coefficients:
intercept -38.3125
mic_dist_cm -1.1875
gain_db -5.5625
treatment_pct -1.5625
gate_db -0.9375
RSM Model (quadratic, R² = 0.7313, Adj R² = -3.0306):
Coefficients:
intercept -7.6625
mic_dist_cm -1.1875
gain_db -5.5625
treatment_pct -1.5625
gate_db -0.9375
mic_dist_cm*gain_db -3.6875
mic_dist_cm*treatment_pct -1.9375
mic_dist_cm*gate_db +0.4375
gain_db*treatment_pct +5.4375
gain_db*gate_db -0.4375
treatment_pct*gate_db +3.3125
mic_dist_cm^2 -7.6625
gain_db^2 -7.6625
treatment_pct^2 -7.6625
gate_db^2 -7.6625
Curvature analysis:
treatment_pct coef=-7.6625 concave (has a maximum)
mic_dist_cm coef=-7.6625 concave (has a maximum)
gain_db coef=-7.6625 concave (has a maximum)
gate_db coef=-7.6625 concave (has a maximum)
Notable interactions:
gain_db*treatment_pct coef=+5.4375 (synergistic)
mic_dist_cm*gain_db coef=-3.6875 (antagonistic)
treatment_pct*gate_db coef=+3.3125 (synergistic)
mic_dist_cm*treatment_pct coef=-1.9375 (antagonistic)
gain_db*gate_db coef=-0.4375 (antagonistic)
mic_dist_cm*gate_db coef=+0.4375 (synergistic)
Predicted optimum (from linear model, at observed points):
mic_dist_cm = 5
gain_db = 20
treatment_pct = 0
gate_db = -60
Predicted value: -29.0625
Surface optimum (via L-BFGS-B, linear model):
mic_dist_cm = 30
gain_db = 50
treatment_pct = 80
gate_db = -30
Predicted value: -47.5625
Model quality: Weak fit — consider adding center points or using a different design.
Factor importance:
1. gain_db (effect: -11.1, contribution: 60.1%)
2. treatment_pct (effect: -3.1, contribution: 16.9%)
3. mic_dist_cm (effect: 2.4, contribution: 12.8%)
4. gate_db (effect: 1.9, contribution: 10.1%)