Summary
This experiment investigates backyard chicken egg production. Full factorial of light hours, feed protein, calcium supplement, and coop ventilation to maximize egg production and shell quality.
The design varies 4 factors: light hrs (hrs), ranging from 10 to 16, feed protein pct (%), ranging from 14 to 20, calcium g (g/day), ranging from 2 to 6, and ventilation, ranging from low to high. The goal is to optimize 2 responses: eggs per week (eggs/hen) (maximize) and shell thickness (mm) (maximize). Fixed conditions held constant across all runs include breed = rhode_island_red, flock size = 6.
A full factorial design was used to explore all 16 possible combinations of the 4 factors at two levels. This guarantees that every main effect and interaction can be estimated independently, at the cost of a larger experiment (16 runs).
Quadratic response surface models were fitted to capture potential curvature and factor interactions. The RSM contour plots below visualize how pairs of factors jointly affect each response.
Key Findings
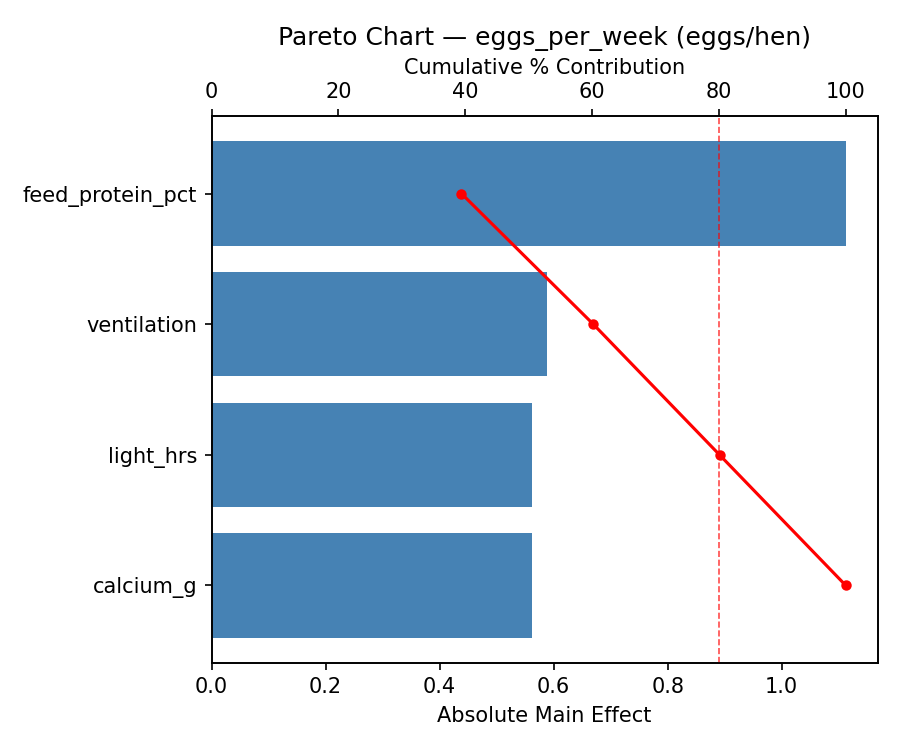
For eggs per week, the most influential factors were calcium g (37.1%), light hrs (31.2%), feed protein pct (17.1%). The best observed value was 6.3 (at light hrs = 10, feed protein pct = 14, calcium g = 2).
For shell thickness, the most influential factors were feed protein pct (42.8%), light hrs (25.9%), calcium g (17.3%). The best observed value was 0.433 (at light hrs = 16, feed protein pct = 20, calcium g = 6).
Recommended Next Steps
- Consider whether any fixed factors should be varied in a future study.
Experimental Setup
Factors
| Factor | Low | High | Unit |
|---|
light_hrs | 10 | 16 | hrs |
feed_protein_pct | 14 | 20 | % |
calcium_g | 2 | 6 | g/day |
ventilation | low | high | |
Fixed: breed = rhode_island_red, flock_size = 6
Responses
| Response | Direction | Unit |
|---|
eggs_per_week | ↑ maximize | eggs/hen |
shell_thickness | ↑ maximize | mm |
Configuration
{
"metadata": {
"name": "Backyard Chicken Egg Production",
"description": "Full factorial of light hours, feed protein, calcium supplement, and coop ventilation to maximize egg production and shell quality"
},
"factors": [
{
"name": "light_hrs",
"levels": [
"10",
"16"
],
"type": "continuous",
"unit": "hrs"
},
{
"name": "feed_protein_pct",
"levels": [
"14",
"20"
],
"type": "continuous",
"unit": "%"
},
{
"name": "calcium_g",
"levels": [
"2",
"6"
],
"type": "continuous",
"unit": "g/day"
},
{
"name": "ventilation",
"levels": [
"low",
"high"
],
"type": "categorical",
"unit": ""
}
],
"fixed_factors": {
"breed": "rhode_island_red",
"flock_size": "6"
},
"responses": [
{
"name": "eggs_per_week",
"optimize": "maximize",
"unit": "eggs/hen"
},
{
"name": "shell_thickness",
"optimize": "maximize",
"unit": "mm"
}
],
"settings": {
"operation": "full_factorial",
"test_script": "use_cases/169_chicken_egg_production/sim.sh"
}
}
Experimental Matrix
The Full Factorial Design produces 16 runs. Each row is one experiment with specific factor settings.
| Run | light_hrs | feed_protein_pct | calcium_g | ventilation |
|---|
| 1 | 10 | 20 | 6 | high |
| 2 | 16 | 14 | 2 | high |
| 3 | 10 | 20 | 2 | high |
| 4 | 10 | 20 | 6 | low |
| 5 | 16 | 20 | 6 | low |
| 6 | 16 | 14 | 6 | low |
| 7 | 16 | 20 | 2 | low |
| 8 | 16 | 14 | 2 | low |
| 9 | 10 | 14 | 2 | high |
| 10 | 10 | 14 | 6 | low |
| 11 | 16 | 20 | 2 | high |
| 12 | 16 | 20 | 6 | high |
| 13 | 10 | 20 | 2 | low |
| 14 | 16 | 14 | 6 | high |
| 15 | 10 | 14 | 2 | low |
| 16 | 10 | 14 | 6 | high |
Step-by-Step Workflow
1
Preview the design
$ doe info --config use_cases/169_chicken_egg_production/config.json
2
Generate the runner script
$ doe generate --config use_cases/169_chicken_egg_production/config.json \
--output use_cases/169_chicken_egg_production/results/run.sh --seed 42
3
Execute the experiments
$ bash use_cases/169_chicken_egg_production/results/run.sh
4
Analyze results
$ doe analyze --config use_cases/169_chicken_egg_production/config.json
5
Get optimization recommendations
$ doe optimize --config use_cases/169_chicken_egg_production/config.json
6
Multi-objective optimization
With 2 competing responses, use --multi to find the best compromise via Derringer–Suich desirability.
$ doe optimize --config use_cases/169_chicken_egg_production/config.json --multi
7
Generate the HTML report
$ doe report --config use_cases/169_chicken_egg_production/config.json \
--output use_cases/169_chicken_egg_production/results/report.html
Features Exercised
| Feature | Value |
|---|
| Design type | full_factorial |
| Factor types | continuous (3), categorical (1) |
| Arg style | double-dash |
| Responses | 2 (eggs_per_week ↑, shell_thickness ↑) |
| Total runs | 16 |
Analysis Results
Generated from actual experiment runs using the DOE Helper Tool.
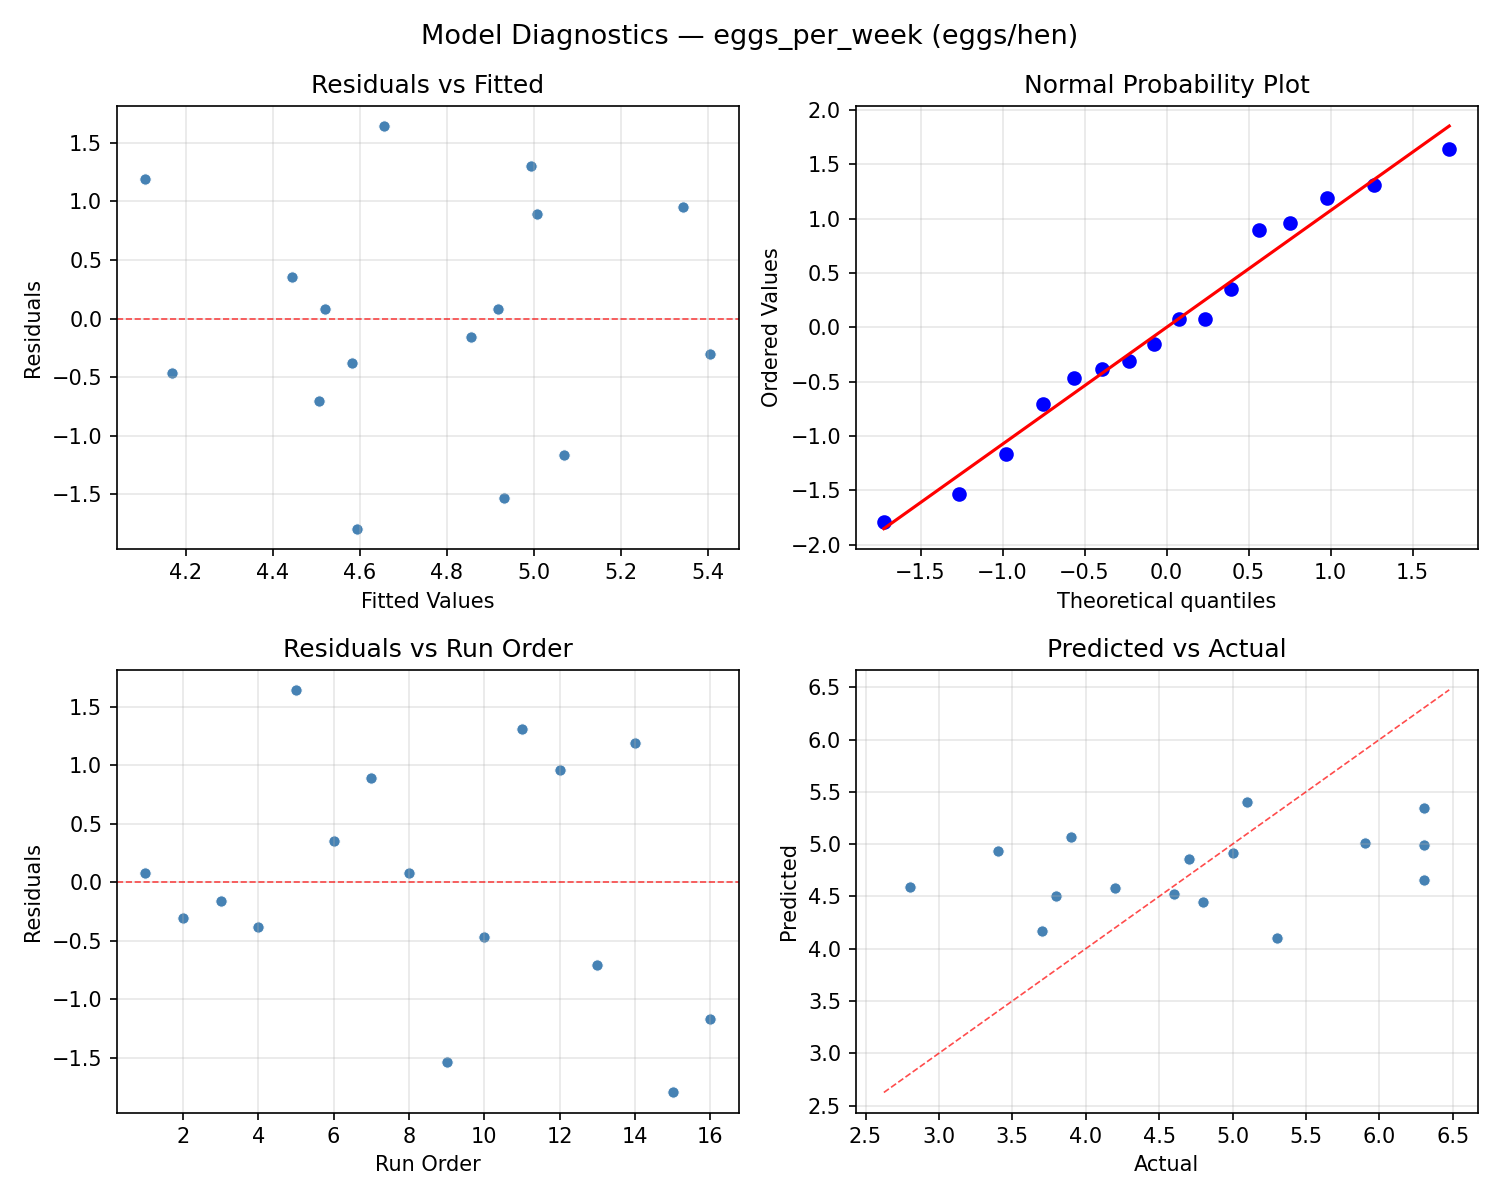
Response: eggs_per_week
Top factors: calcium_g (37.1%), light_hrs (31.2%), feed_protein_pct (17.1%).
ANOVA
| Source | DF | SS | MS | F | p-value |
|---|
| Source | DF | SS | MS | F | p-value |
| light_hrs | 1 | 1.7556 | 1.7556 | 1.248 | 0.3147 |
| feed_protein_pct | 1 | 0.5256 | 0.5256 | 0.374 | 0.5677 |
| calcium_g | 1 | 2.4806 | 2.4806 | 1.764 | 0.2416 |
| ventilation | 1 | 0.3906 | 0.3906 | 0.278 | 0.6207 |
| light_hrs*feed_protein_pct | 1 | 1.5006 | 1.5006 | 1.067 | 0.3490 |
| light_hrs*calcium_g | 1 | 0.0756 | 0.0756 | 0.054 | 0.8258 |
| light_hrs*ventilation | 1 | 1.7556 | 1.7556 | 1.248 | 0.3147 |
| feed_protein_pct*calcium_g | 1 | 1.1556 | 1.1556 | 0.822 | 0.4063 |
| feed_protein_pct*ventilation | 1 | 0.0756 | 0.0756 | 0.054 | 0.8258 |
| calcium_g*ventilation | 1 | 0.9506 | 0.9506 | 0.676 | 0.4484 |
| Error | 5 | 7.0331 | 1.4066 | | |
| Total | 15 | 17.6994 | 1.1800 | | |
Pareto Chart
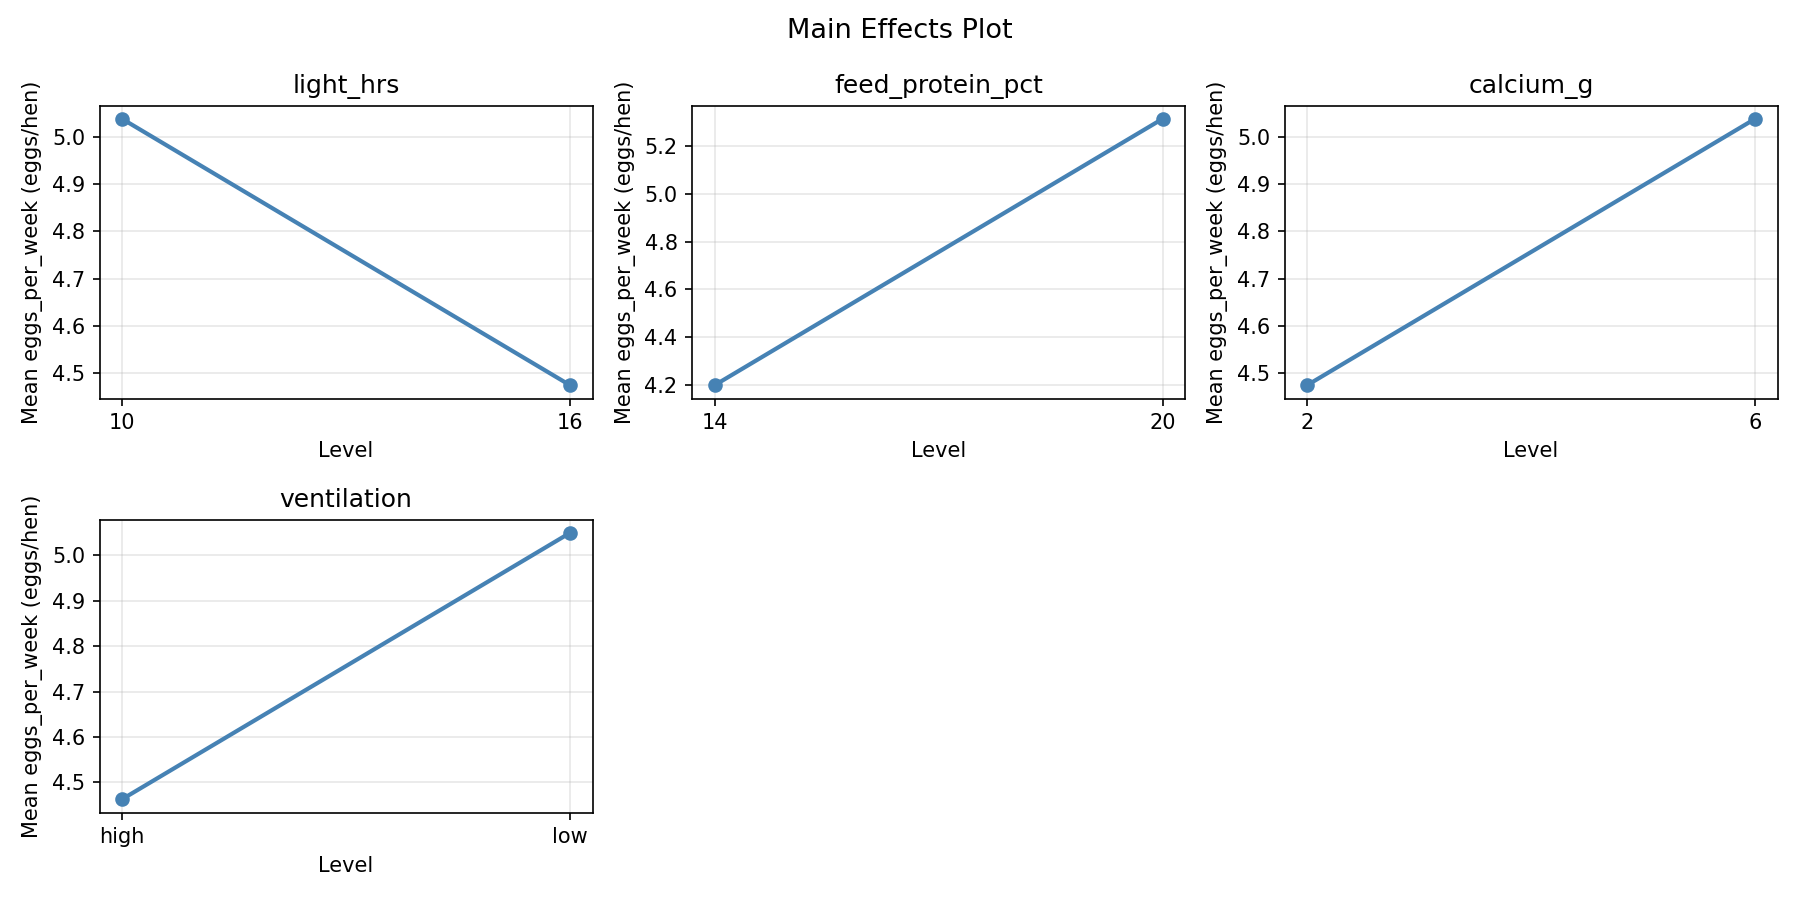
Main Effects Plot
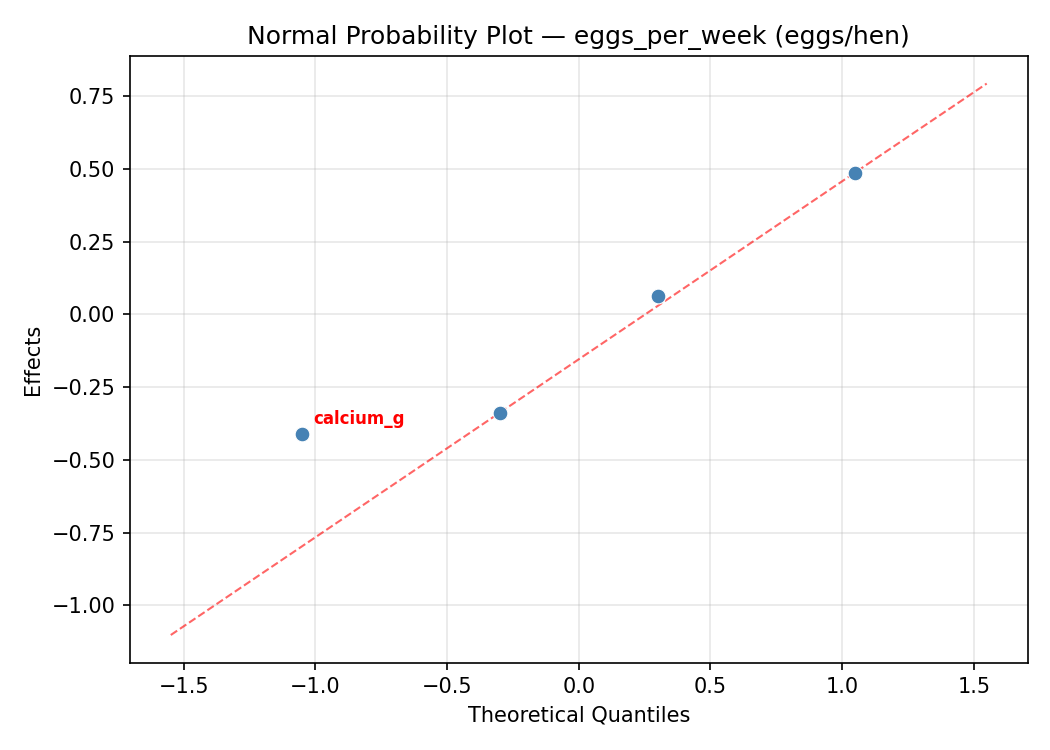
Normal Probability Plot of Effects
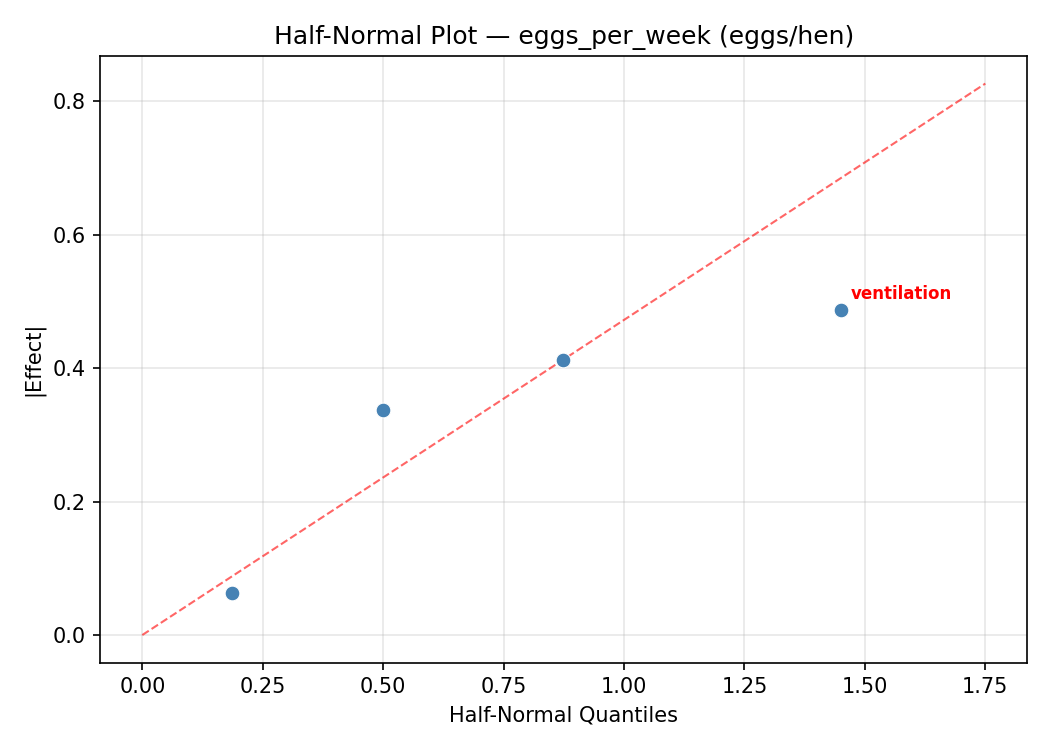
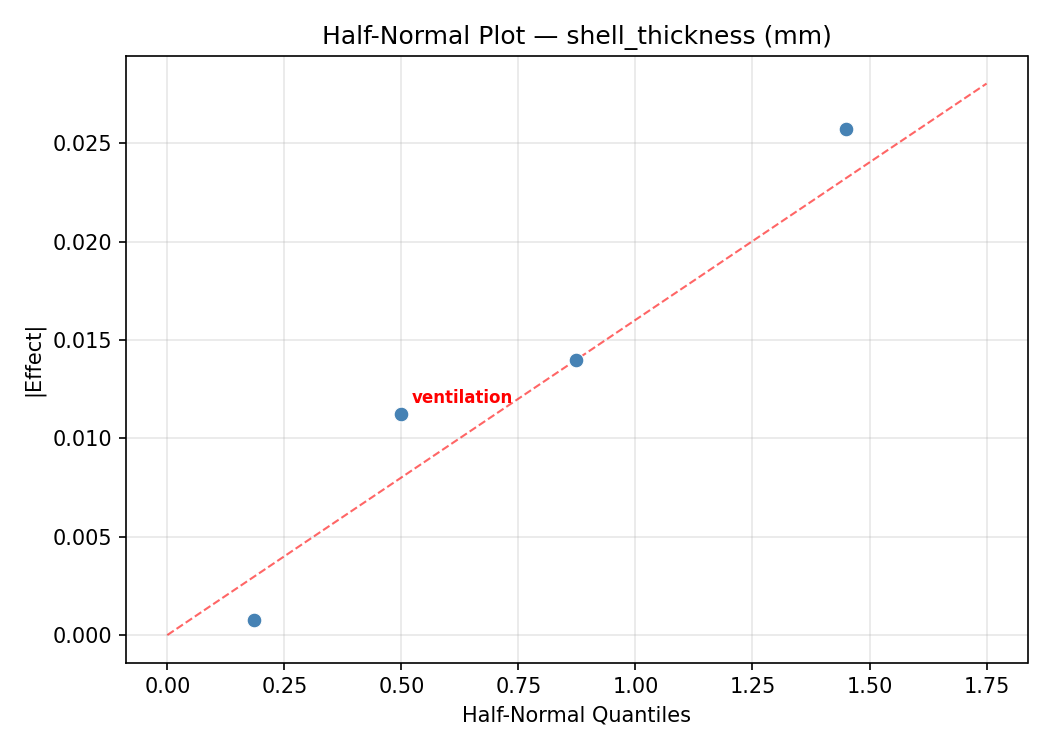
Half-Normal Plot of Effects
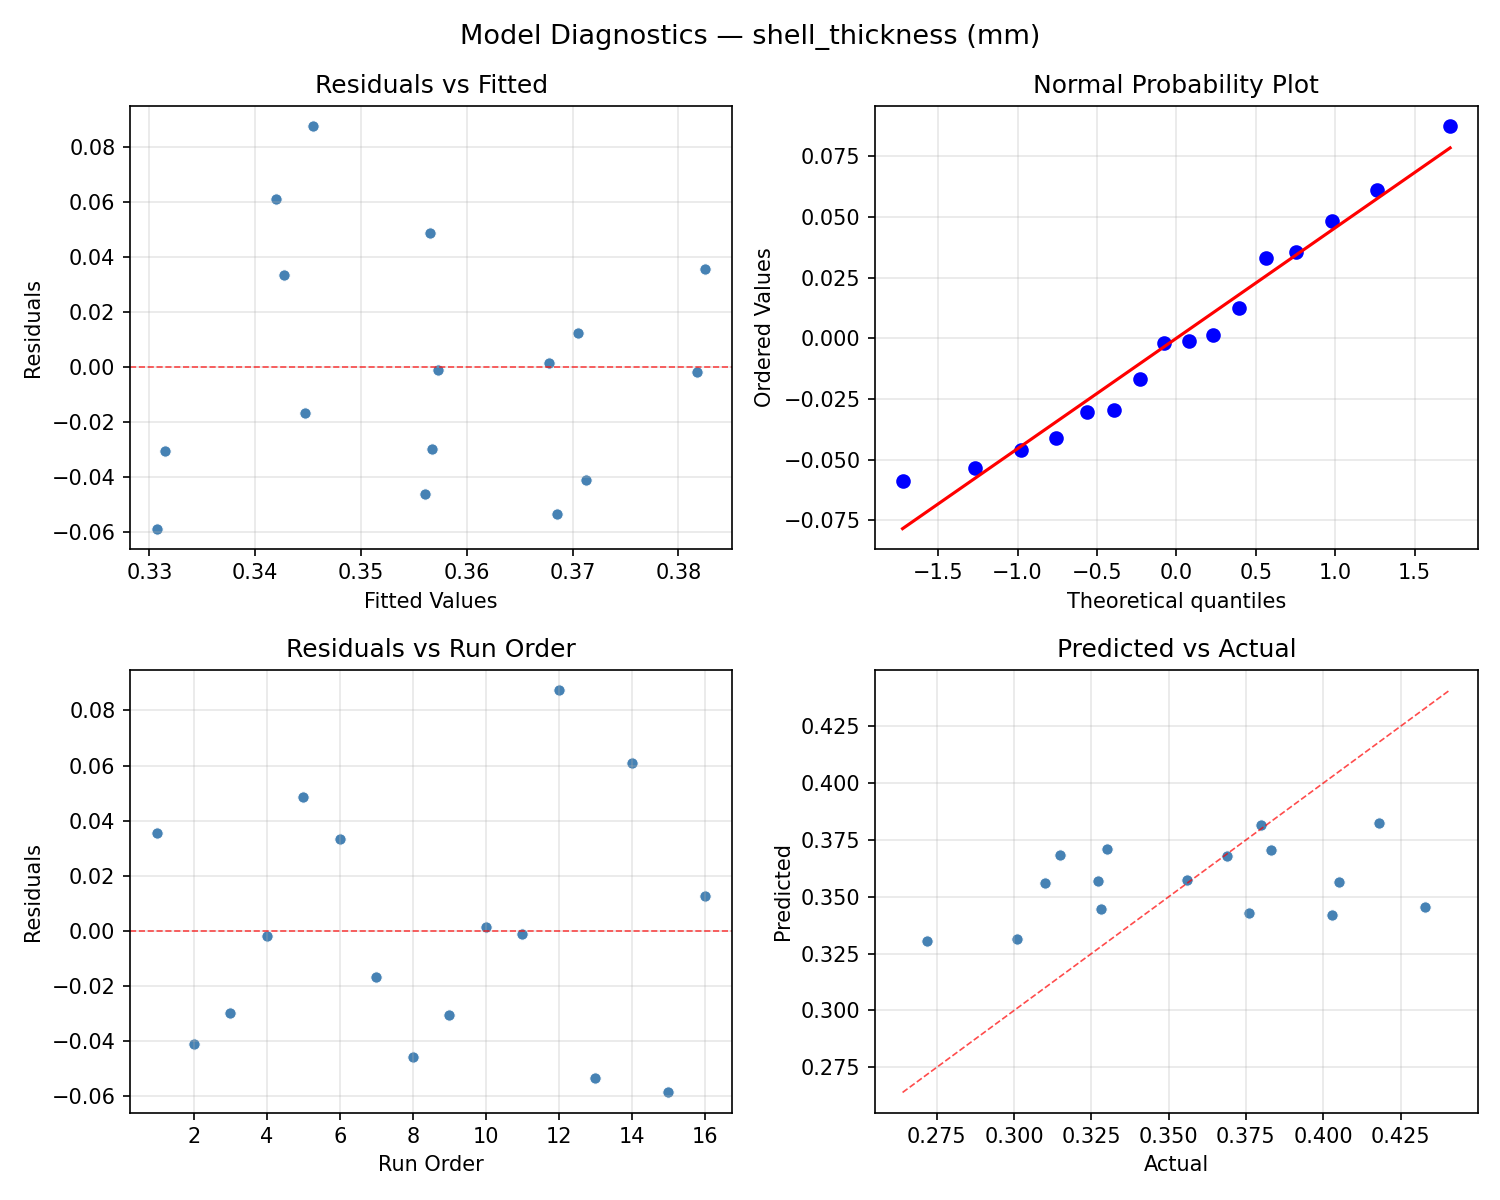
Model Diagnostics
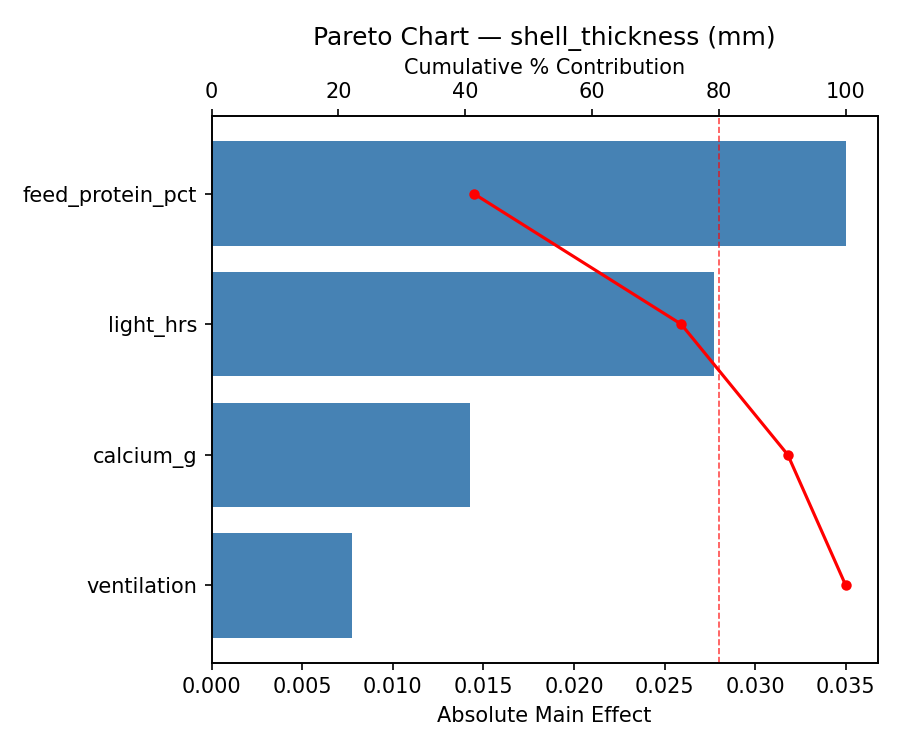
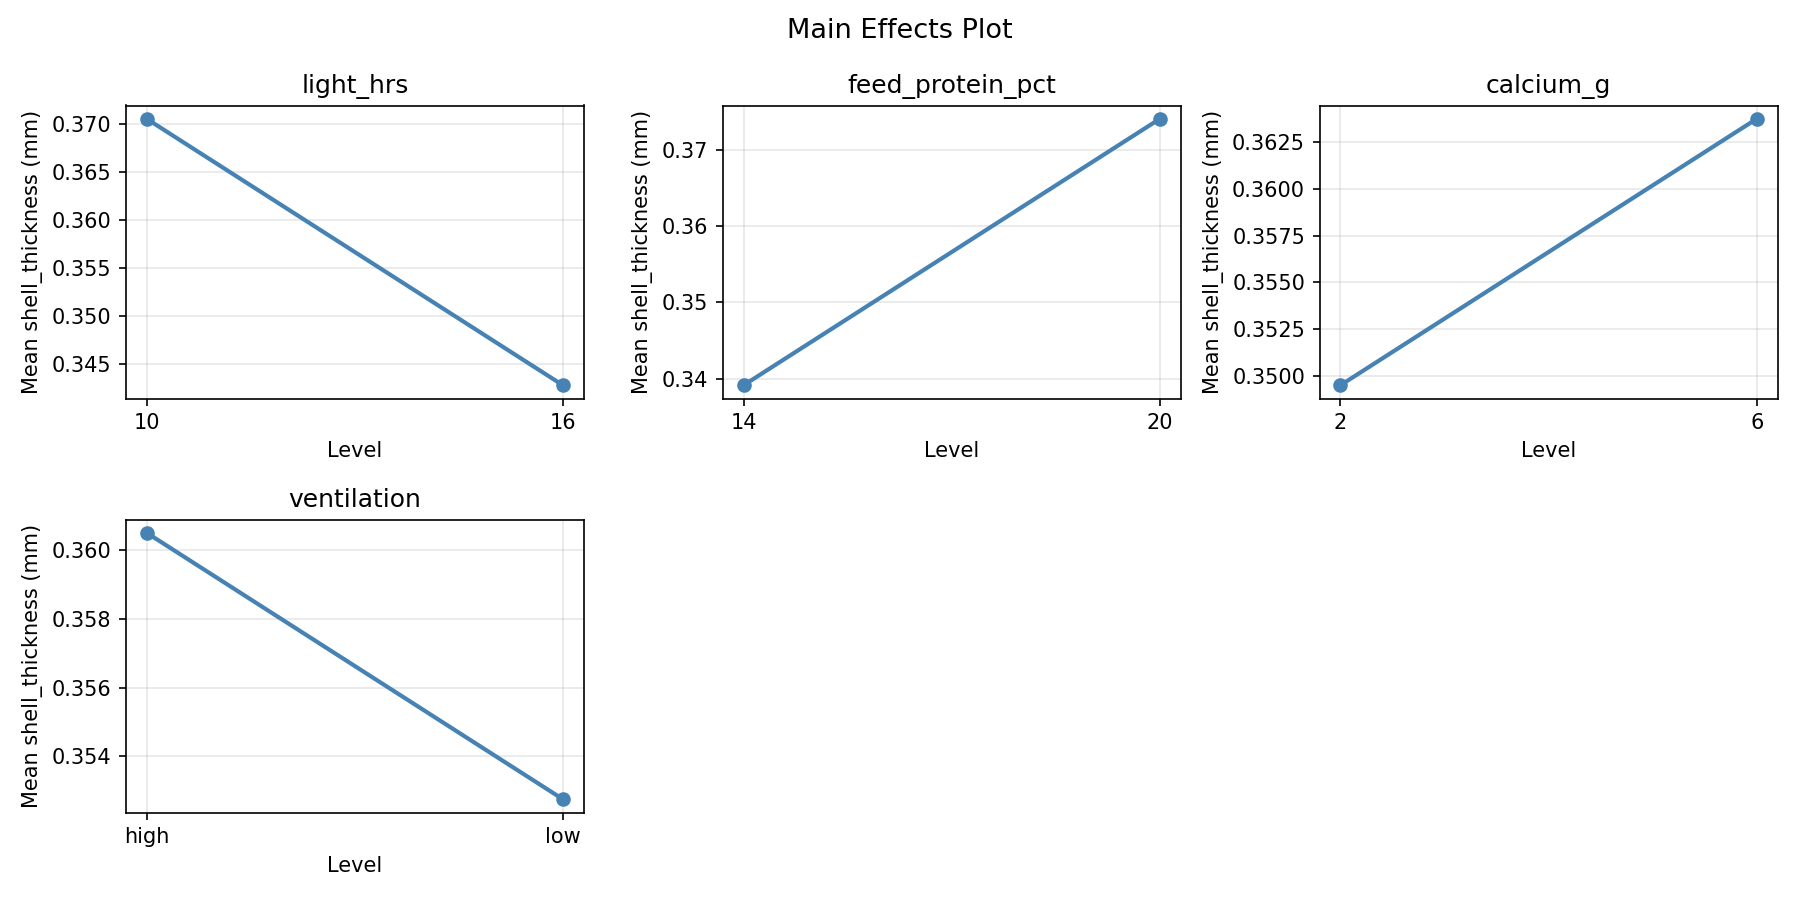
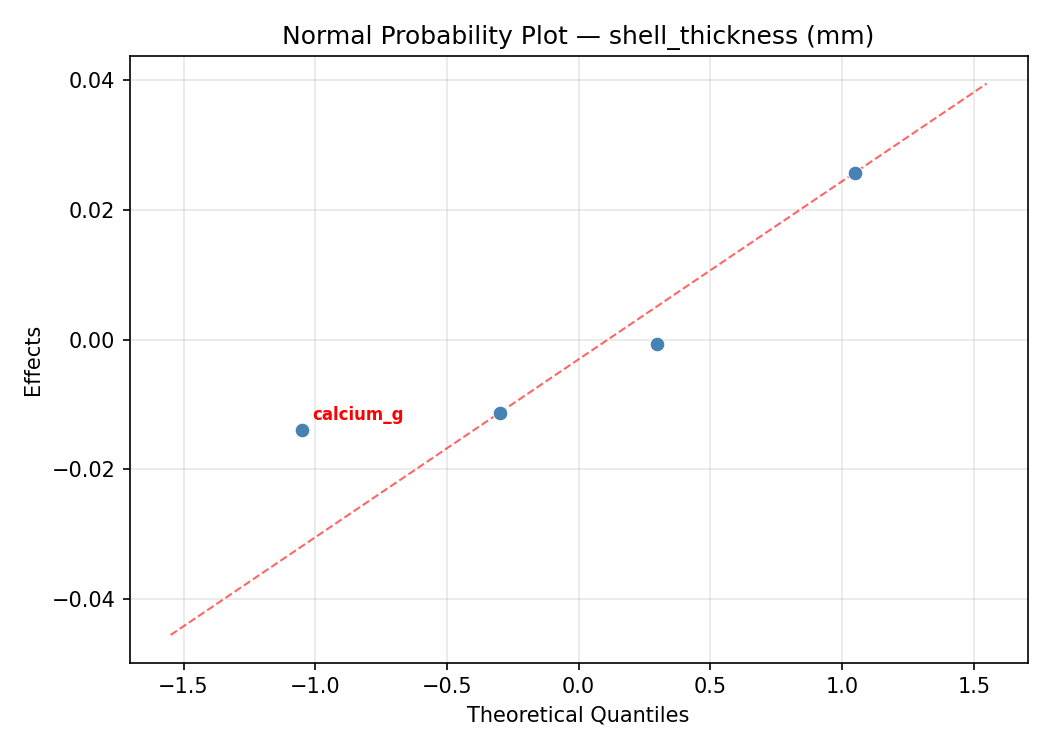
Response: shell_thickness
Top factors: feed_protein_pct (42.8%), light_hrs (25.9%), calcium_g (17.3%).
ANOVA
| Source | DF | SS | MS | F | p-value |
|---|
| Source | DF | SS | MS | F | p-value |
| light_hrs | 1 | 0.0013 | 0.0013 | 0.444 | 0.5345 |
| feed_protein_pct | 1 | 0.0035 | 0.0035 | 1.214 | 0.3207 |
| calcium_g | 1 | 0.0006 | 0.0006 | 0.198 | 0.6753 |
| ventilation | 1 | 0.0004 | 0.0004 | 0.130 | 0.7328 |
| light_hrs*feed_protein_pct | 1 | 0.0085 | 0.0085 | 2.902 | 0.1492 |
| light_hrs*calcium_g | 1 | 0.0008 | 0.0008 | 0.279 | 0.6202 |
| light_hrs*ventilation | 1 | 0.0001 | 0.0001 | 0.041 | 0.8466 |
| feed_protein_pct*calcium_g | 1 | 0.0007 | 0.0007 | 0.250 | 0.6383 |
| feed_protein_pct*ventilation | 1 | 0.0016 | 0.0016 | 0.562 | 0.4870 |
| calcium_g*ventilation | 1 | 0.0003 | 0.0003 | 0.099 | 0.7656 |
| Error | 5 | 0.0146 | 0.0029 | | |
| Total | 15 | 0.0324 | 0.0022 | | |
Pareto Chart
Main Effects Plot
Normal Probability Plot of Effects
Half-Normal Plot of Effects
Model Diagnostics
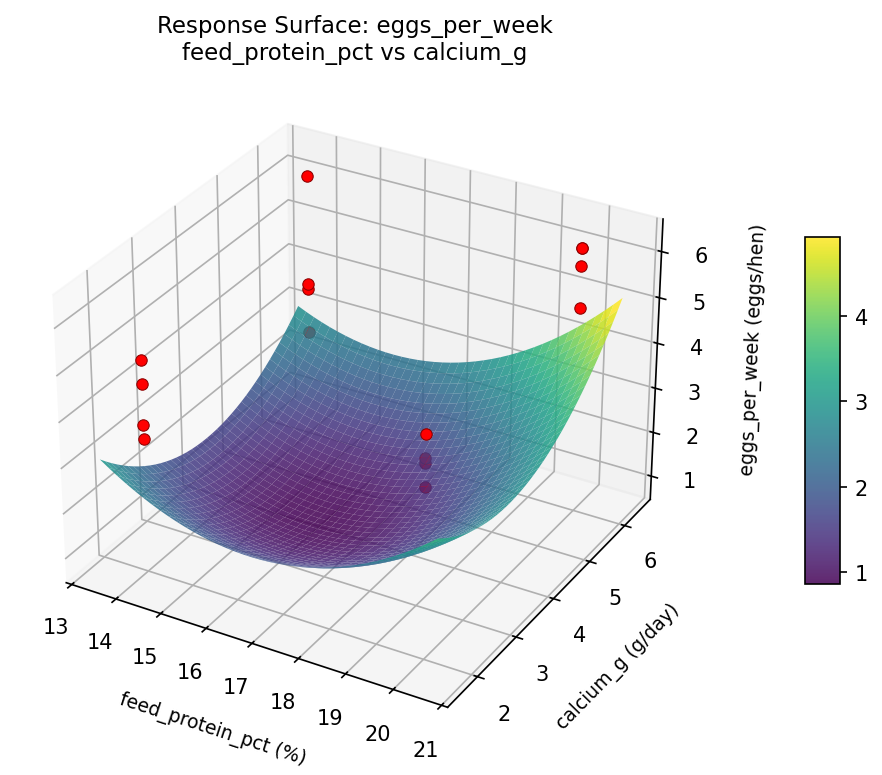
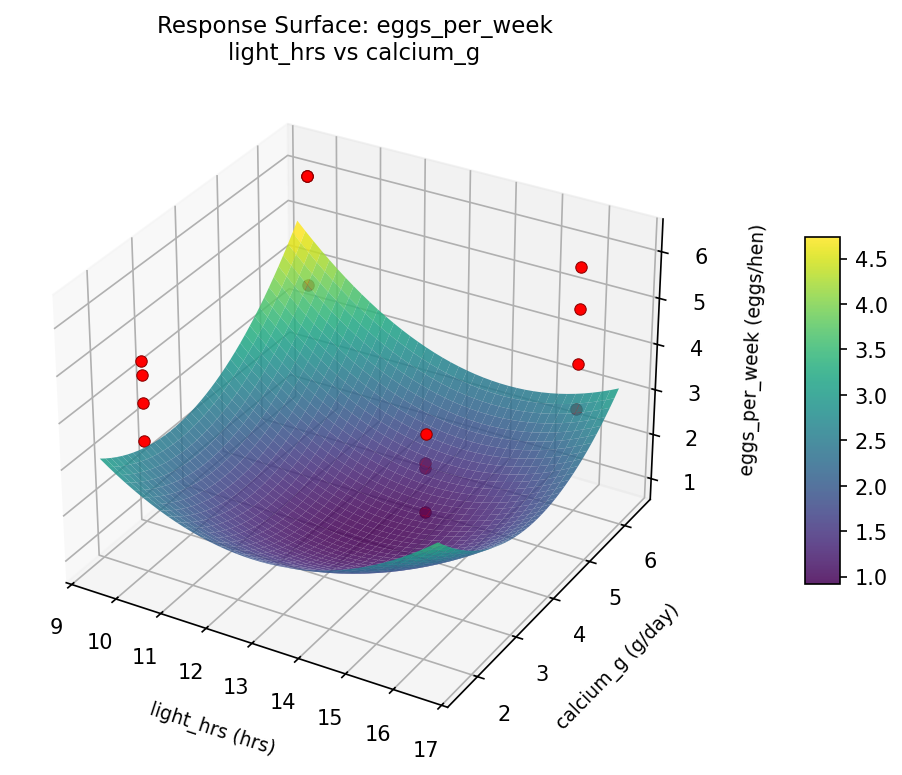
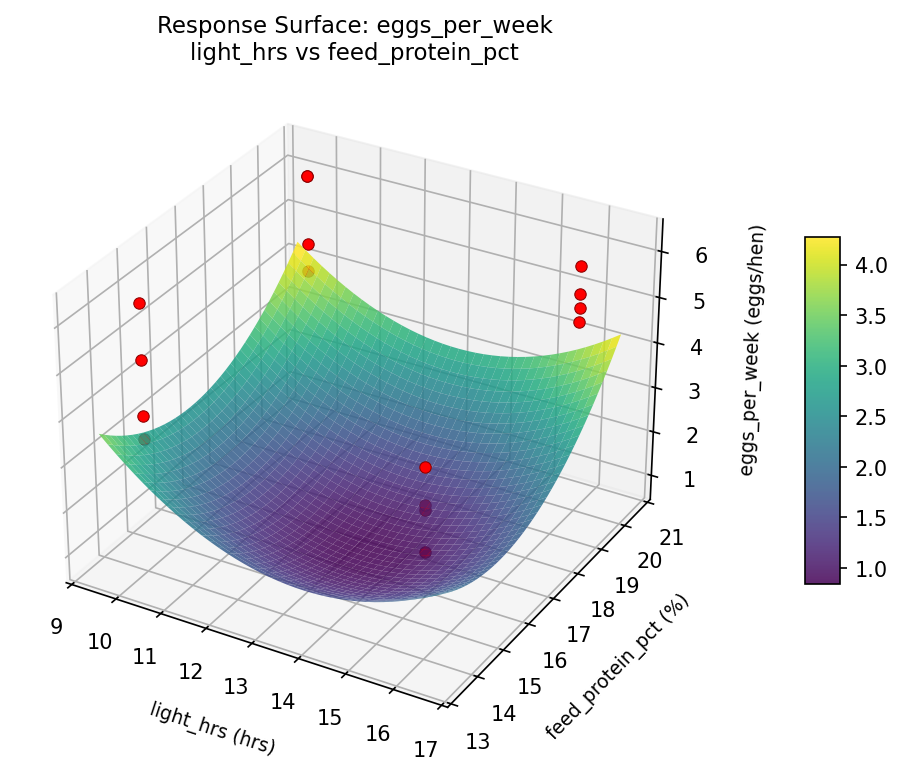
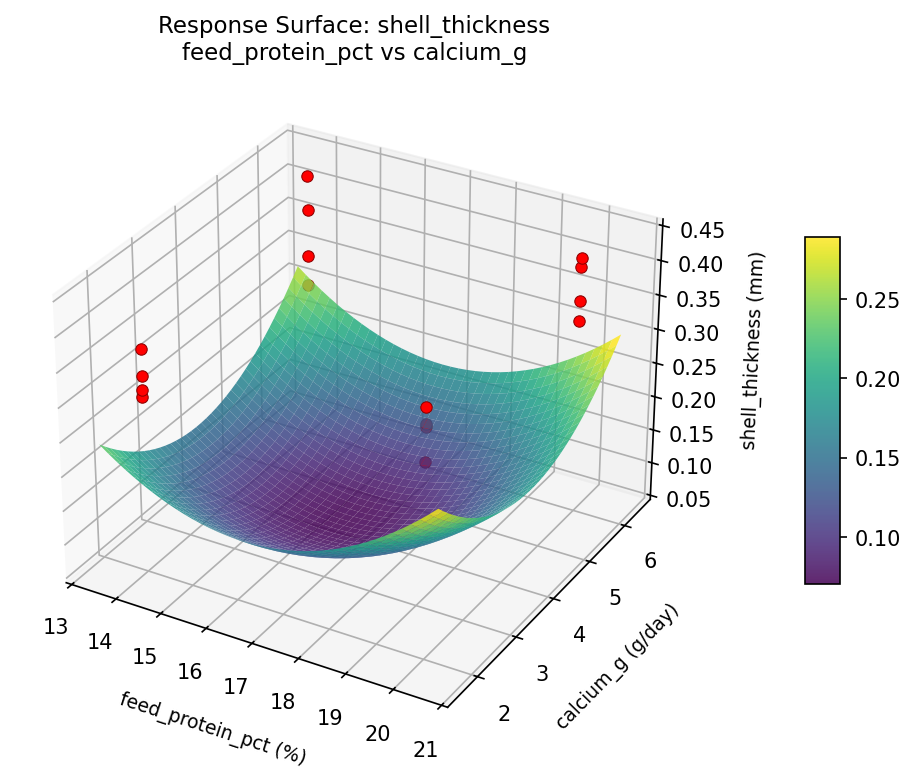
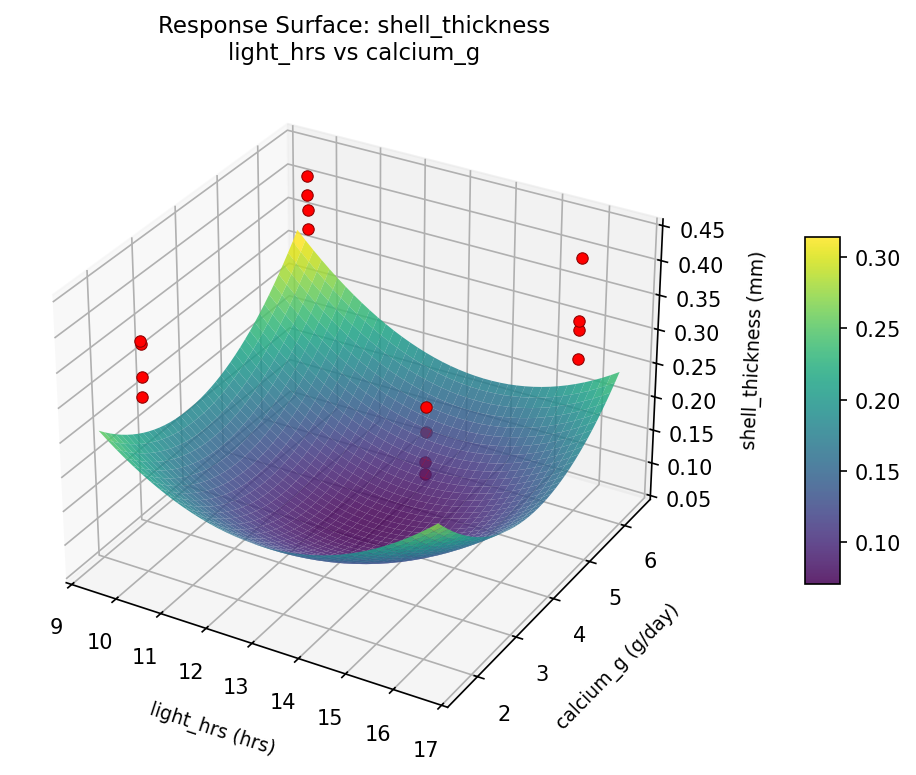
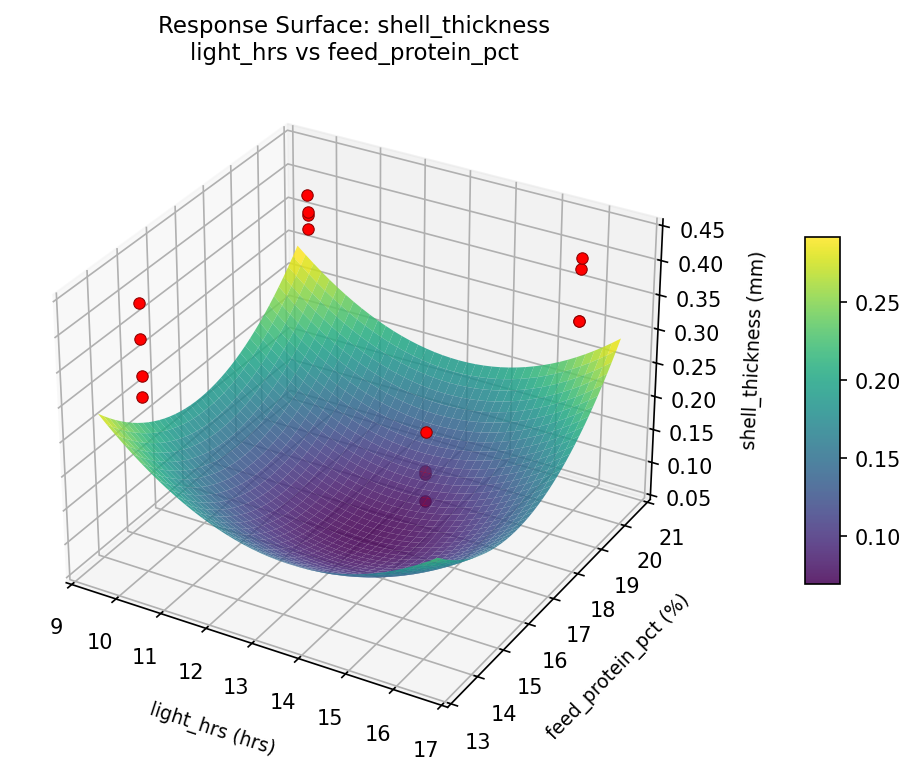
Response Surface Plots
3D surfaces fitted with quadratic RSM. Red dots are observed data points.
eggs per week feed protein pct vs calcium g
eggs per week light hrs vs calcium g
eggs per week light hrs vs feed protein pct
shell thickness feed protein pct vs calcium g
shell thickness light hrs vs calcium g
shell thickness light hrs vs feed protein pct
Multi-Objective Optimization
When responses compete, Derringer–Suich desirability finds the best compromise.
Each response is scaled to a 0–1 desirability, then combined via a weighted geometric mean.
Overall Desirability
D = 0.9545
Per-Response Desirability
| Response | Weight | Desirability | Predicted | Dir |
|---|
eggs_per_week |
1.5 |
|
6.30 0.9545 6.30 eggs/hen |
↑ |
shell_thickness |
1.0 |
|
0.43 0.9545 0.43 mm |
↑ |
Recommended Settings
| Factor | Value |
|---|
light_hrs | 10 hrs |
feed_protein_pct | 14 % |
calcium_g | 6 g/day |
ventilation | low |
Source: from observed run #12
Trade-off Summary
Sacrifice = how much worse than single-objective best.
| Response | Predicted | Best Observed | Sacrifice |
|---|
shell_thickness | 0.43 | 0.43 | +0.00 |
Top 3 Runs by Desirability
| Run | D | Factor Settings |
|---|
| #5 | 0.8879 | light_hrs=16, feed_protein_pct=14, calcium_g=6, ventilation=low |
| #11 | 0.7485 | light_hrs=10, feed_protein_pct=20, calcium_g=2, ventilation=high |
Model Quality
| Response | R² | Type |
|---|
shell_thickness | 0.2135 | linear |
Full Multi-Objective Output
============================================================
MULTI-OBJECTIVE OPTIMIZATION
Method: Derringer-Suich Desirability Function
============================================================
Overall desirability: D = 0.9545
Response Weight Desirability Predicted Direction
---------------------------------------------------------------------
eggs_per_week 1.5 0.9545 6.30 eggs/hen ↑
shell_thickness 1.0 0.9545 0.43 mm ↑
Recommended settings:
light_hrs = 10 hrs
feed_protein_pct = 14 %
calcium_g = 6 g/day
ventilation = low
(from observed run #12)
Trade-off summary:
eggs_per_week: 6.30 (best observed: 6.30, sacrifice: +0.00)
shell_thickness: 0.43 (best observed: 0.43, sacrifice: +0.00)
Model quality:
eggs_per_week: R² = 0.9402 (quadratic)
shell_thickness: R² = 0.2135 (linear)
Top 3 observed runs by overall desirability:
1. Run #12 (D=0.9545): light_hrs=10, feed_protein_pct=14, calcium_g=6, ventilation=low
2. Run #5 (D=0.8879): light_hrs=16, feed_protein_pct=14, calcium_g=6, ventilation=low
3. Run #11 (D=0.7485): light_hrs=10, feed_protein_pct=20, calcium_g=2, ventilation=high
Full Analysis Output
=== Main Effects: eggs_per_week ===
Factor Effect Std Error % Contribution
--------------------------------------------------------------
calcium_g 0.7875 0.2716 37.1%
light_hrs 0.6625 0.2716 31.2%
feed_protein_pct 0.3625 0.2716 17.1%
ventilation -0.3125 0.2716 14.7%
=== ANOVA Table: eggs_per_week ===
Source DF SS MS F p-value
-----------------------------------------------------------------------------
light_hrs 1 1.7556 1.7556 1.248 0.3147
feed_protein_pct 1 0.5256 0.5256 0.374 0.5677
calcium_g 1 2.4806 2.4806 1.764 0.2416
ventilation 1 0.3906 0.3906 0.278 0.6207
light_hrs*feed_protein_pct 1 1.5006 1.5006 1.067 0.3490
light_hrs*calcium_g 1 0.0756 0.0756 0.054 0.8258
light_hrs*ventilation 1 1.7556 1.7556 1.248 0.3147
feed_protein_pct*calcium_g 1 1.1556 1.1556 0.822 0.4063
feed_protein_pct*ventilation 1 0.0756 0.0756 0.054 0.8258
calcium_g*ventilation 1 0.9506 0.9506 0.676 0.4484
Error 5 7.0331 1.4066
Total 15 17.6994 1.1800
=== Interaction Effects: eggs_per_week ===
Factor A Factor B Interaction % Contribution
------------------------------------------------------------------------
light_hrs ventilation -0.6625 25.7%
light_hrs feed_protein_pct 0.6125 23.8%
feed_protein_pct calcium_g 0.5375 20.9%
calcium_g ventilation -0.4875 18.9%
light_hrs calcium_g 0.1375 5.3%
feed_protein_pct ventilation 0.1375 5.3%
=== Summary Statistics: eggs_per_week ===
light_hrs:
Level N Mean Std Min Max
------------------------------------------------------------
10 8 4.4250 0.7960 2.8000 5.3000
16 8 5.0875 1.2822 3.4000 6.3000
feed_protein_pct:
Level N Mean Std Min Max
------------------------------------------------------------
14 8 4.5750 0.7996 3.7000 5.9000
20 8 4.9375 1.3469 2.8000 6.3000
calcium_g:
Level N Mean Std Min Max
------------------------------------------------------------
2 8 4.3625 1.0770 2.8000 6.3000
6 8 5.1500 1.0071 3.7000 6.3000
ventilation:
Level N Mean Std Min Max
------------------------------------------------------------
high 8 4.9125 1.2665 2.8000 6.3000
low 8 4.6000 0.9320 3.4000 6.3000
=== Main Effects: shell_thickness ===
Factor Effect Std Error % Contribution
--------------------------------------------------------------
feed_protein_pct -0.0297 0.0116 42.8%
light_hrs 0.0180 0.0116 25.9%
calcium_g 0.0120 0.0116 17.3%
ventilation 0.0097 0.0116 14.0%
=== ANOVA Table: shell_thickness ===
Source DF SS MS F p-value
-----------------------------------------------------------------------------
light_hrs 1 0.0013 0.0013 0.444 0.5345
feed_protein_pct 1 0.0035 0.0035 1.214 0.3207
calcium_g 1 0.0006 0.0006 0.198 0.6753
ventilation 1 0.0004 0.0004 0.130 0.7328
light_hrs*feed_protein_pct 1 0.0085 0.0085 2.902 0.1492
light_hrs*calcium_g 1 0.0008 0.0008 0.279 0.6202
light_hrs*ventilation 1 0.0001 0.0001 0.041 0.8466
feed_protein_pct*calcium_g 1 0.0007 0.0007 0.250 0.6383
feed_protein_pct*ventilation 1 0.0016 0.0016 0.562 0.4870
calcium_g*ventilation 1 0.0003 0.0003 0.099 0.7656
Error 5 0.0146 0.0029
Total 15 0.0324 0.0022
=== Interaction Effects: shell_thickness ===
Factor A Factor B Interaction % Contribution
------------------------------------------------------------------------
light_hrs feed_protein_pct 0.0460 42.6%
feed_protein_pct ventilation -0.0202 18.7%
light_hrs calcium_g -0.0142 13.2%
feed_protein_pct calcium_g 0.0135 12.5%
calcium_g ventilation 0.0085 7.9%
light_hrs ventilation 0.0055 5.1%
=== Summary Statistics: shell_thickness ===
light_hrs:
Level N Mean Std Min Max
------------------------------------------------------------
10 8 0.3476 0.0448 0.2720 0.4030
16 8 0.3656 0.0494 0.3010 0.4330
feed_protein_pct:
Level N Mean Std Min Max
------------------------------------------------------------
14 8 0.3715 0.0348 0.3150 0.4180
20 8 0.3417 0.0540 0.2720 0.4330
calcium_g:
Level N Mean Std Min Max
------------------------------------------------------------
2 8 0.3506 0.0590 0.2720 0.4330
6 8 0.3626 0.0326 0.3270 0.4050
ventilation:
Level N Mean Std Min Max
------------------------------------------------------------
high 8 0.3518 0.0520 0.2720 0.4330
low 8 0.3615 0.0433 0.3010 0.4180
Optimization Recommendations
=== Optimization: eggs_per_week ===
Direction: maximize
Best observed run: #5
light_hrs = 10
feed_protein_pct = 14
calcium_g = 2
ventilation = high
Value: 6.3
RSM Model (linear, R² = 0.3278, Adj R² = 0.0834):
Coefficients:
intercept +4.7563
light_hrs -0.2813
feed_protein_pct +0.2063
calcium_g +0.4188
ventilation -0.2562
RSM Model (quadratic, R² = 0.7970, Adj R² = -2.0451):
Coefficients:
intercept +0.9512
light_hrs -0.2812
feed_protein_pct +0.2062
calcium_g +0.4188
ventilation -0.2563
light_hrs*feed_protein_pct +0.4687
light_hrs*calcium_g +0.1812
light_hrs*ventilation -0.1437
feed_protein_pct*calcium_g +0.2438
feed_protein_pct*ventilation +0.2438
calcium_g*ventilation +0.3563
light_hrs^2 +0.9512
feed_protein_pct^2 +0.9512
calcium_g^2 +0.9513
ventilation^2 +0.9513
Curvature analysis:
calcium_g coef=+0.9513 convex (has a minimum)
ventilation coef=+0.9513 convex (has a minimum)
light_hrs coef=+0.9512 convex (has a minimum)
feed_protein_pct coef=+0.9512 convex (has a minimum)
Notable interactions:
light_hrs*feed_protein_pct coef=+0.4687 (synergistic)
calcium_g*ventilation coef=+0.3563 (synergistic)
Predicted optimum (from linear model, at observed points):
light_hrs = 10
feed_protein_pct = 20
calcium_g = 6
ventilation = high
Predicted value: 5.9188
Surface optimum (via L-BFGS-B, linear model):
light_hrs = 10
feed_protein_pct = 20
calcium_g = 6
ventilation = low
Predicted value: 5.9188
Model quality: Weak fit — consider adding center points or using a different design.
Factor importance:
1. calcium_g (effect: 0.8, contribution: 36.0%)
2. light_hrs (effect: -0.6, contribution: 24.2%)
3. ventilation (effect: -0.5, contribution: 22.0%)
4. feed_protein_pct (effect: 0.4, contribution: 17.7%)
=== Optimization: shell_thickness ===
Direction: maximize
Best observed run: #12
light_hrs = 16
feed_protein_pct = 20
calcium_g = 6
ventilation = high
Value: 0.433
RSM Model (linear, R² = 0.4539, Adj R² = 0.2553):
Coefficients:
intercept +0.3566
light_hrs -0.0195
feed_protein_pct +0.0064
calcium_g +0.0089
ventilation -0.0205
RSM Model (quadratic, R² = 0.9372, Adj R² = 0.0575):
Coefficients:
intercept +0.0713
light_hrs -0.0195
feed_protein_pct +0.0064
calcium_g +0.0089
ventilation -0.0205
light_hrs*feed_protein_pct +0.0065
light_hrs*calcium_g +0.0257
light_hrs*ventilation -0.0056
feed_protein_pct*calcium_g +0.0019
feed_protein_pct*ventilation +0.0088
calcium_g*ventilation -0.0127
light_hrs^2 +0.0713
feed_protein_pct^2 +0.0713
calcium_g^2 +0.0713
ventilation^2 +0.0713
Curvature analysis:
light_hrs coef=+0.0713 negligible curvature
feed_protein_pct coef=+0.0713 negligible curvature
calcium_g coef=+0.0713 negligible curvature
ventilation coef=+0.0713 negligible curvature
Predicted optimum (from linear model, at observed points):
light_hrs = 10
feed_protein_pct = 20
calcium_g = 6
ventilation = high
Predicted value: 0.4119
Surface optimum (via L-BFGS-B, linear model):
light_hrs = 10
feed_protein_pct = 20
calcium_g = 6
ventilation = low
Predicted value: 0.4119
Model quality: Weak fit — consider adding center points or using a different design.
Factor importance:
1. ventilation (effect: -0.0, contribution: 37.1%)
2. light_hrs (effect: -0.0, contribution: 35.3%)
3. calcium_g (effect: 0.0, contribution: 16.1%)
4. feed_protein_pct (effect: 0.0, contribution: 11.5%)