Summary
This experiment investigates electroplating thickness control. Plackett-Burman screening of current density, bath temperature, plating time, pH, and agitation for uniform coating thickness and adhesion.
The design varies 5 factors: current density (A/dm2), ranging from 1 to 10, bath temp c (C), ranging from 20 to 55, time min (min), ranging from 5 to 60, bath ph (pH), ranging from 2 to 5, and agitation rpm (rpm), ranging from 0 to 200. The goal is to optimize 2 responses: thickness um (um) (maximize) and adhesion score (pts) (maximize). Fixed conditions held constant across all runs include metal = nickel, substrate = mild_steel.
A Plackett-Burman screening design was used to efficiently test 5 factors in only 8 runs. This design assumes interactions are negligible and focuses on identifying the most influential main effects.
Key Findings
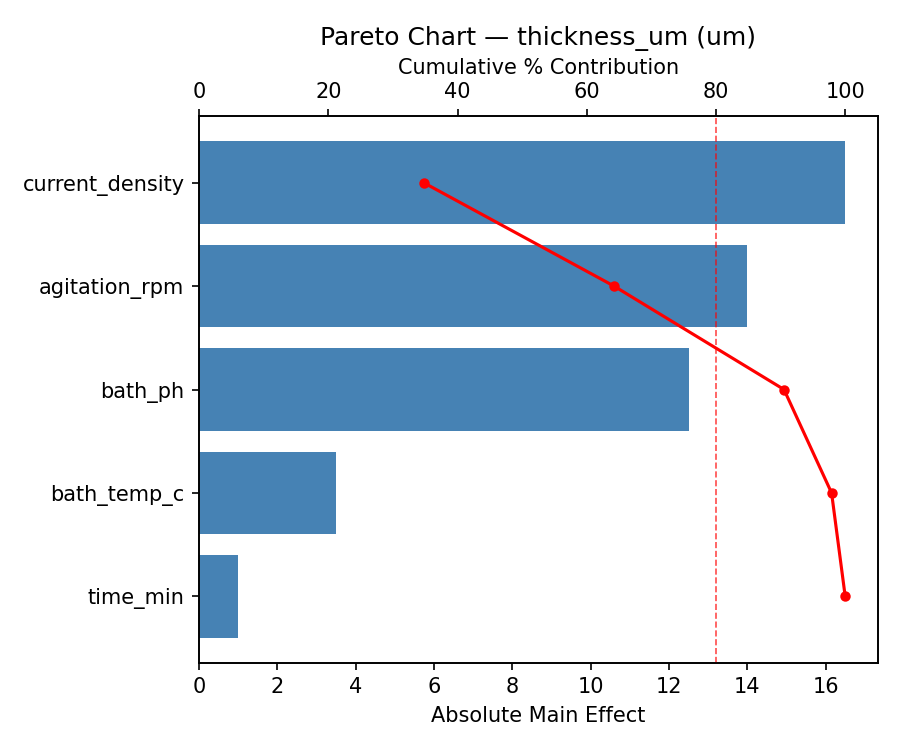
For thickness um, the most influential factors were current density (44.4%), time min (33.3%), bath temp c (17.8%). The best observed value was 38.0 (at current density = 10, bath temp c = 20, time min = 5).
For adhesion score, the most influential factors were bath temp c (35.7%), time min (21.7%), bath ph (16.5%). The best observed value was 4.4 (at current density = 10, bath temp c = 20, time min = 5).
Recommended Next Steps
- Follow up with a response surface design (CCD or Box-Behnken) on the top 3–4 factors to model curvature and find the true optimum.
- Consider whether any fixed factors should be varied in a future study.
- The screening results can guide factor reduction — drop factors contributing less than 5% and re-run with a smaller, more focused design.
Experimental Setup
Factors
| Factor | Low | High | Unit |
|---|
current_density | 1 | 10 | A/dm2 |
bath_temp_c | 20 | 55 | C |
time_min | 5 | 60 | min |
bath_ph | 2 | 5 | pH |
agitation_rpm | 0 | 200 | rpm |
Fixed: metal = nickel, substrate = mild_steel
Responses
| Response | Direction | Unit |
|---|
thickness_um | ↑ maximize | um |
adhesion_score | ↑ maximize | pts |
Configuration
{
"metadata": {
"name": "Electroplating Thickness Control",
"description": "Plackett-Burman screening of current density, bath temperature, plating time, pH, and agitation for uniform coating thickness and adhesion"
},
"factors": [
{
"name": "current_density",
"levels": [
"1",
"10"
],
"type": "continuous",
"unit": "A/dm2"
},
{
"name": "bath_temp_c",
"levels": [
"20",
"55"
],
"type": "continuous",
"unit": "C"
},
{
"name": "time_min",
"levels": [
"5",
"60"
],
"type": "continuous",
"unit": "min"
},
{
"name": "bath_ph",
"levels": [
"2",
"5"
],
"type": "continuous",
"unit": "pH"
},
{
"name": "agitation_rpm",
"levels": [
"0",
"200"
],
"type": "continuous",
"unit": "rpm"
}
],
"fixed_factors": {
"metal": "nickel",
"substrate": "mild_steel"
},
"responses": [
{
"name": "thickness_um",
"optimize": "maximize",
"unit": "um"
},
{
"name": "adhesion_score",
"optimize": "maximize",
"unit": "pts"
}
],
"settings": {
"operation": "plackett_burman",
"test_script": "use_cases/194_electroplating/sim.sh"
}
}
Experimental Matrix
The Plackett-Burman Design produces 8 runs. Each row is one experiment with specific factor settings.
| Run | current_density | bath_temp_c | time_min | bath_ph | agitation_rpm |
|---|
| 1 | 10 | 55 | 60 | 2 | 0 |
| 2 | 1 | 20 | 60 | 5 | 0 |
| 3 | 1 | 55 | 5 | 5 | 0 |
| 4 | 10 | 55 | 60 | 5 | 200 |
| 5 | 1 | 55 | 5 | 2 | 200 |
| 6 | 10 | 20 | 5 | 5 | 200 |
| 7 | 1 | 20 | 60 | 2 | 200 |
| 8 | 10 | 20 | 5 | 2 | 0 |
Step-by-Step Workflow
1
Preview the design
$ doe info --config use_cases/194_electroplating/config.json
2
Generate the runner script
$ doe generate --config use_cases/194_electroplating/config.json \
--output use_cases/194_electroplating/results/run.sh --seed 42
3
Execute the experiments
$ bash use_cases/194_electroplating/results/run.sh
4
Analyze results
$ doe analyze --config use_cases/194_electroplating/config.json
5
Get optimization recommendations
$ doe optimize --config use_cases/194_electroplating/config.json
6
Multi-objective optimization
With 2 competing responses, use --multi to find the best compromise via Derringer–Suich desirability.
$ doe optimize --config use_cases/194_electroplating/config.json --multi
7
Generate the HTML report
$ doe report --config use_cases/194_electroplating/config.json \
--output use_cases/194_electroplating/results/report.html
Features Exercised
| Feature | Value |
|---|
| Design type | plackett_burman |
| Factor types | continuous (all 5) |
| Arg style | double-dash |
| Responses | 2 (thickness_um ↑, adhesion_score ↑) |
| Total runs | 8 |
Analysis Results
Generated from actual experiment runs using the DOE Helper Tool.
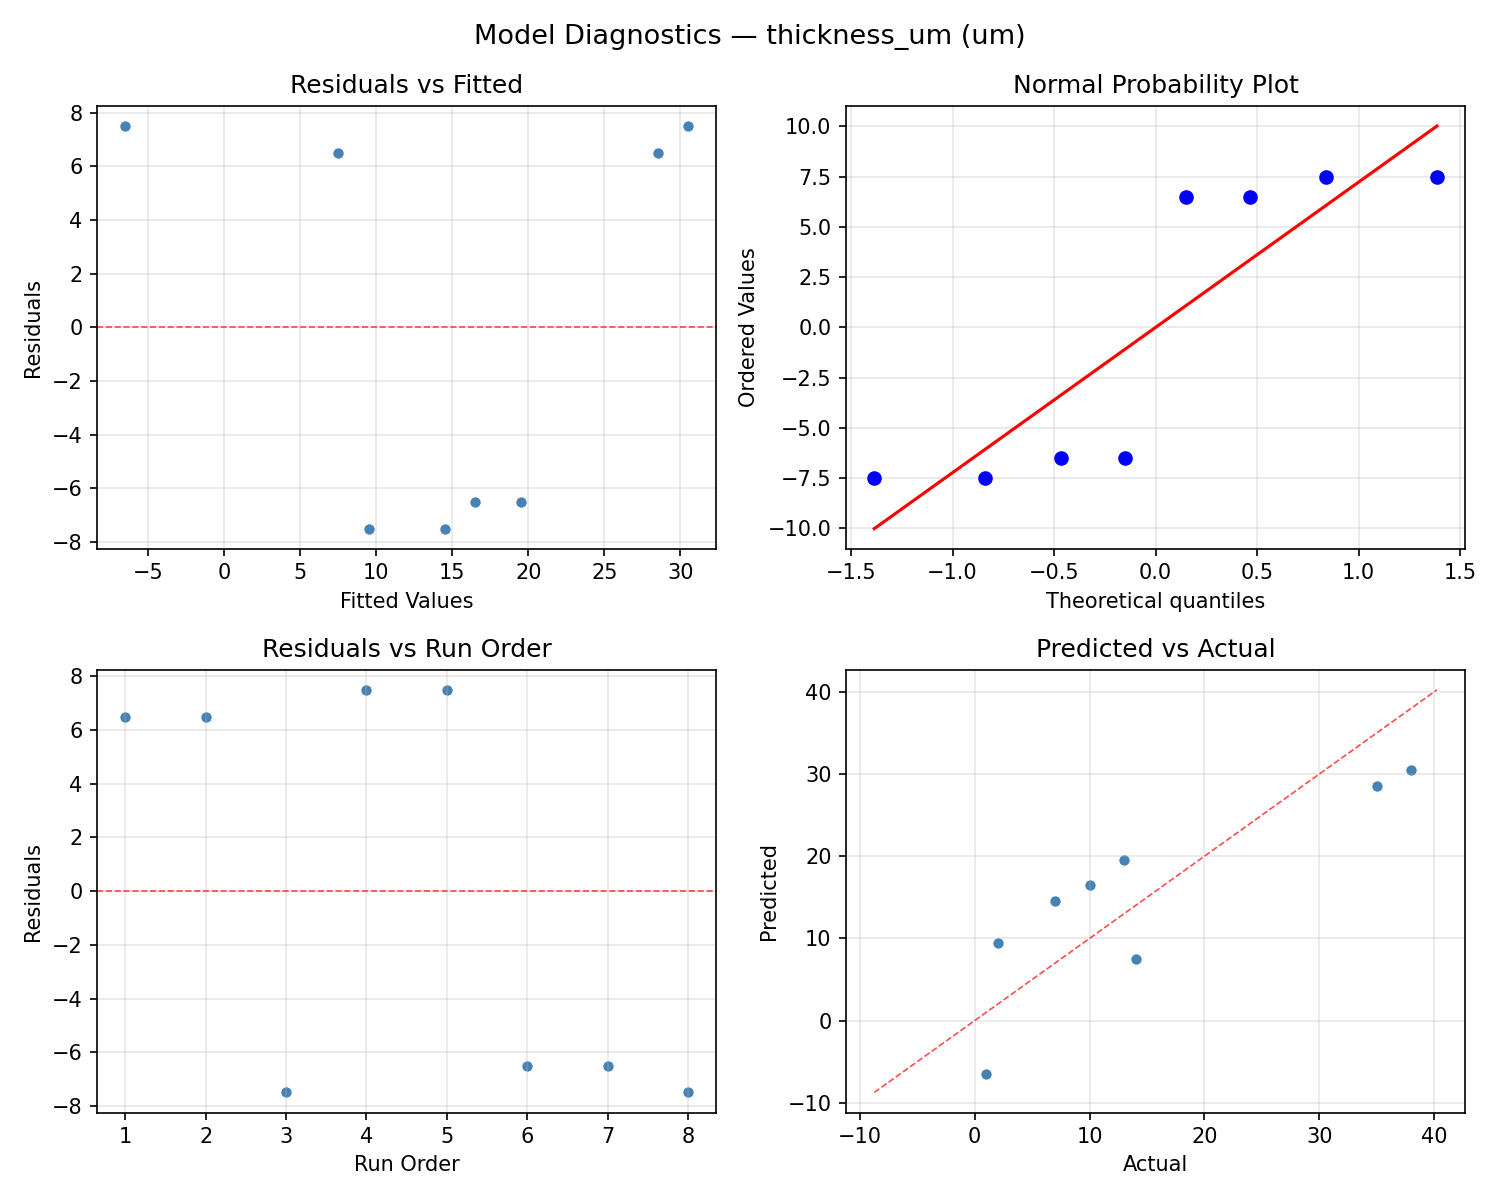
Response: thickness_um
Top factors: current_density (44.4%), time_min (33.3%), bath_temp_c (17.8%).
ANOVA
| Source | DF | SS | MS | F | p-value |
|---|
| Source | DF | SS | MS | F | p-value |
| current_density | 1 | 800.0000 | 800.0000 | 213.333 | 0.0000 |
| bath_temp_c | 1 | 128.0000 | 128.0000 | 34.133 | 0.0021 |
| time_min | 1 | 450.0000 | 450.0000 | 120.000 | 0.0001 |
| bath_ph | 1 | 4.5000 | 4.5000 | 1.200 | 0.3233 |
| agitation_rpm | 1 | 0.5000 | 0.5000 | 0.133 | 0.7299 |
| current_density*bath_temp_c | 1 | 450.0000 | 450.0000 | 120.000 | 0.0001 |
| current_density*time_min | 1 | 128.0000 | 128.0000 | 34.133 | 0.0021 |
| current_density*bath_ph | 1 | 0.5000 | 0.5000 | 0.133 | 0.7299 |
| current_density*agitation_rpm | 1 | 4.5000 | 4.5000 | 1.200 | 0.3233 |
| bath_temp_c*time_min | 1 | 800.0000 | 800.0000 | 213.333 | 0.0000 |
| bath_temp_c*bath_ph | 1 | 0.5000 | 0.5000 | 0.133 | 0.7299 |
| bath_temp_c*agitation_rpm | 1 | 4.5000 | 4.5000 | 1.200 | 0.3233 |
| time_min*bath_ph | 1 | 4.5000 | 4.5000 | 1.200 | 0.3233 |
| time_min*agitation_rpm | 1 | 0.5000 | 0.5000 | 0.133 | 0.7299 |
| bath_ph*agitation_rpm | 1 | 800.0000 | 800.0000 | 213.333 | 0.0000 |
| Error | (Lenth | PSE) | 5 | 18.7500 | 3.7500 |
| Total | 7 | 1388.0000 | 198.2857 | | |
Pareto Chart
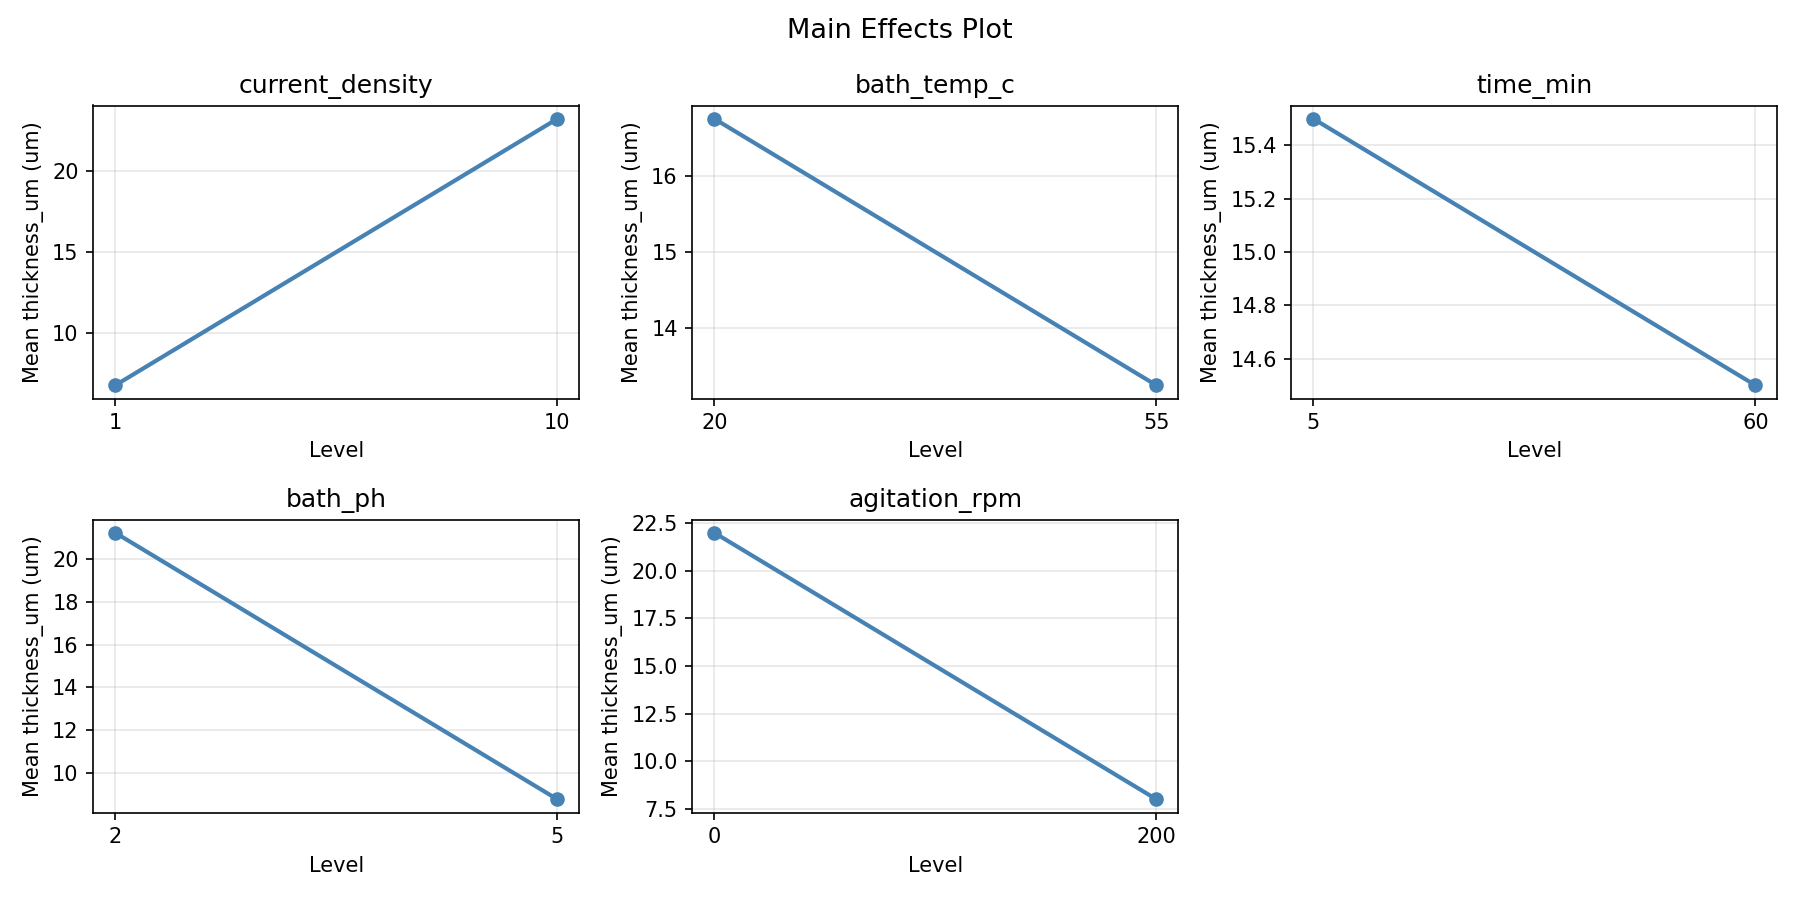
Main Effects Plot
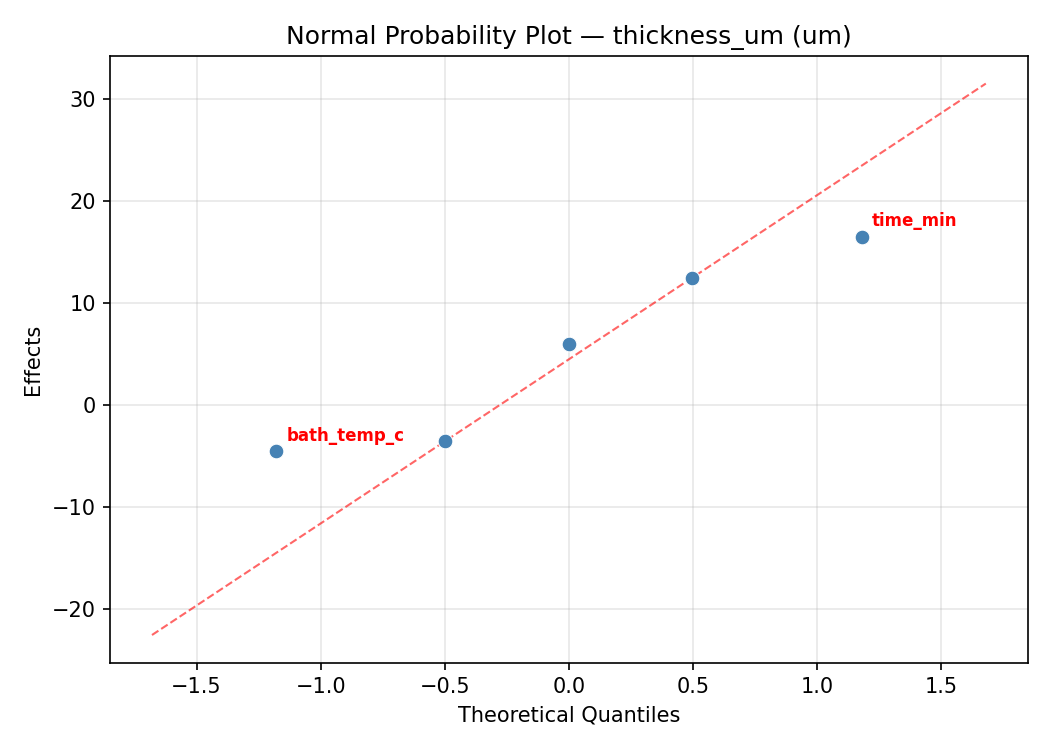
Normal Probability Plot of Effects
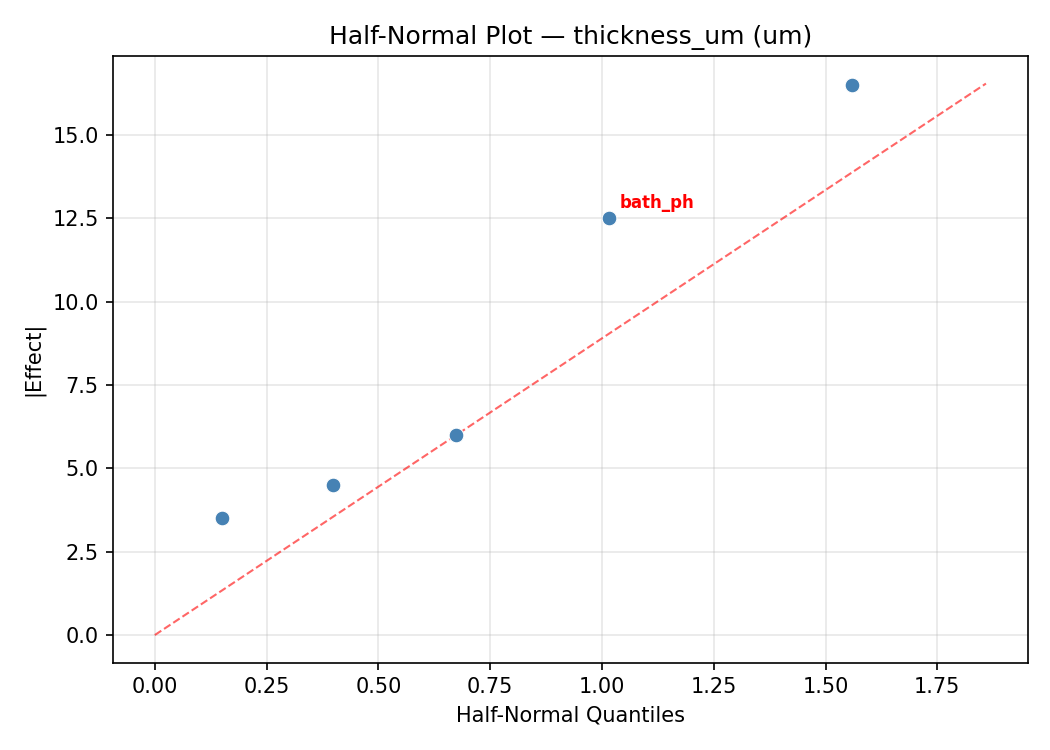
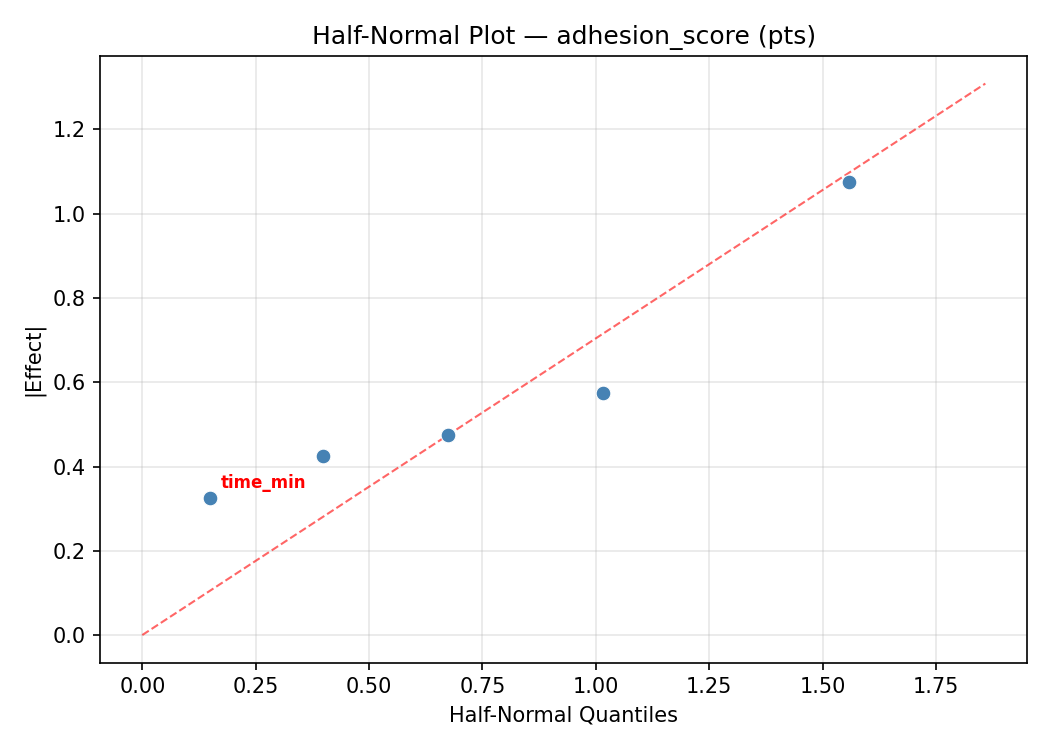
Half-Normal Plot of Effects
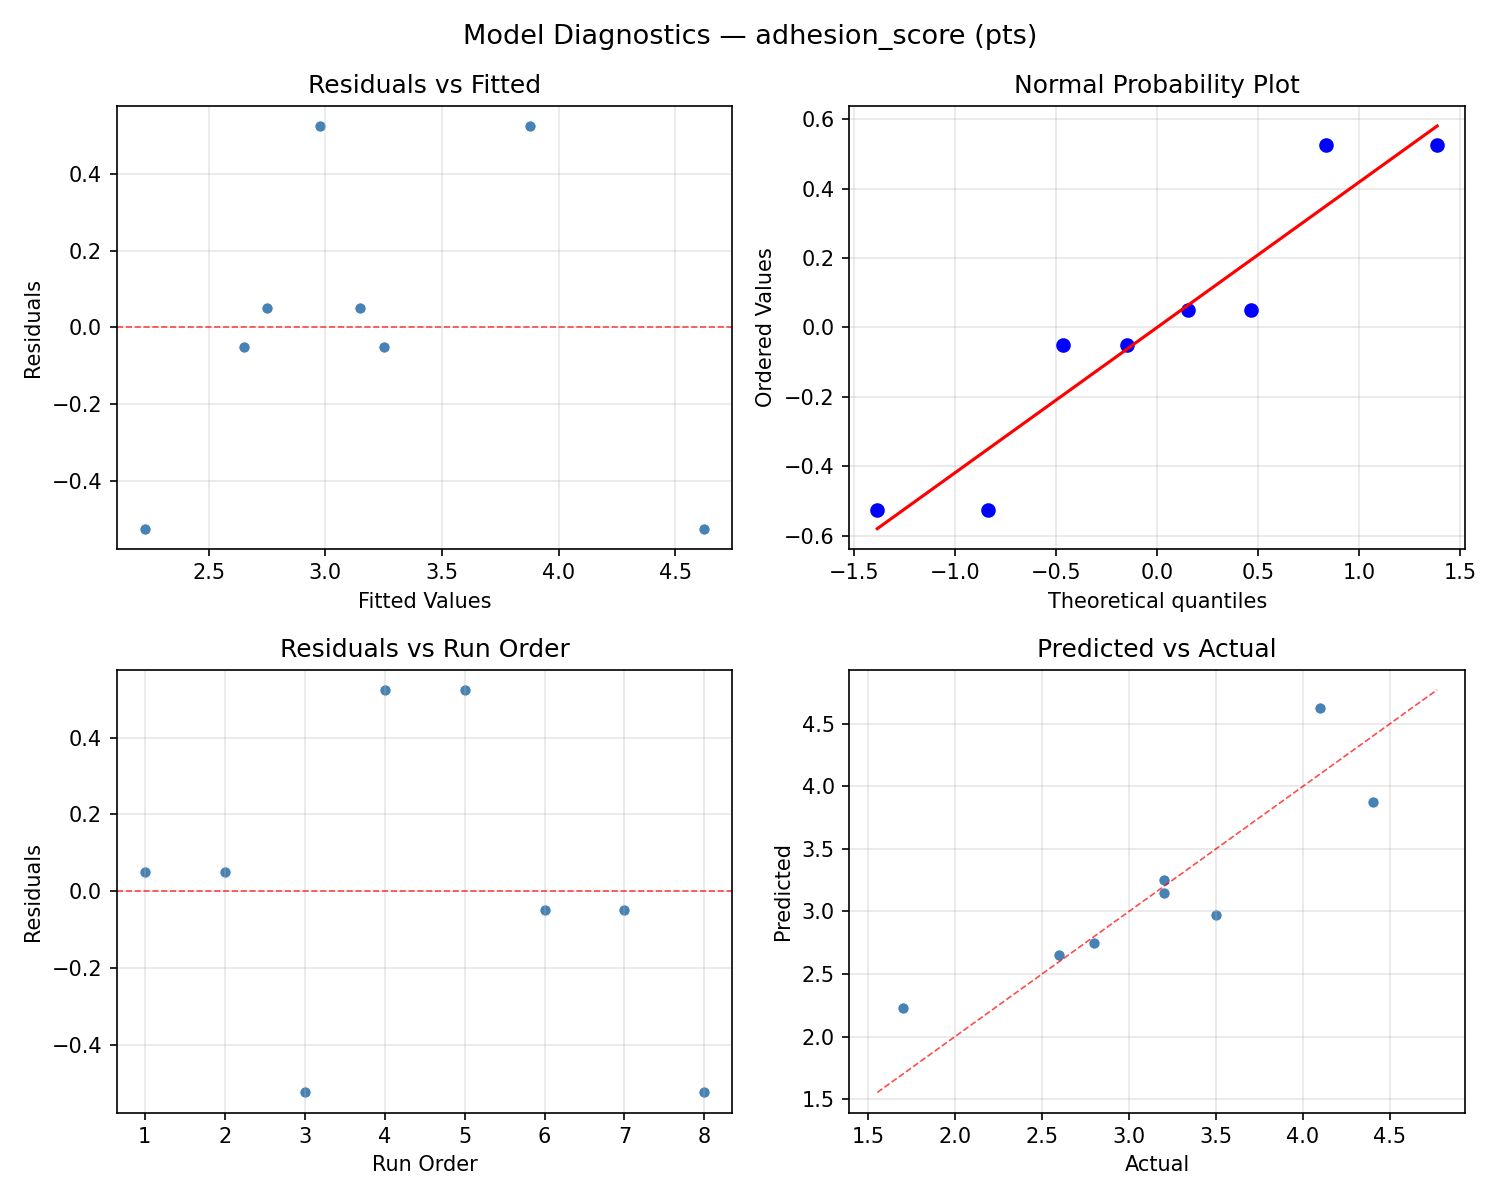
Model Diagnostics
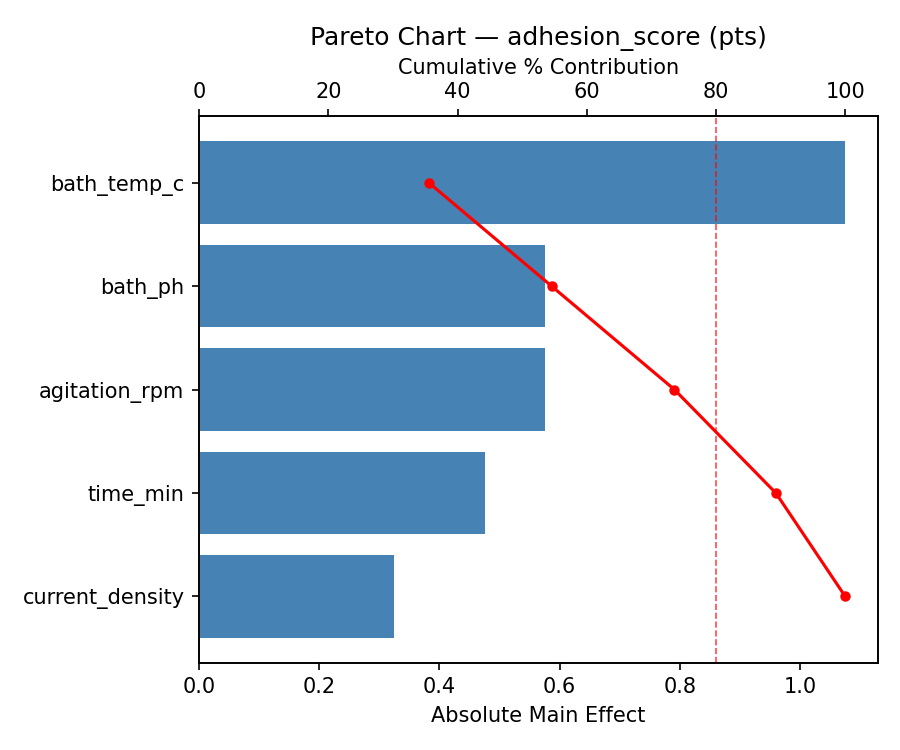
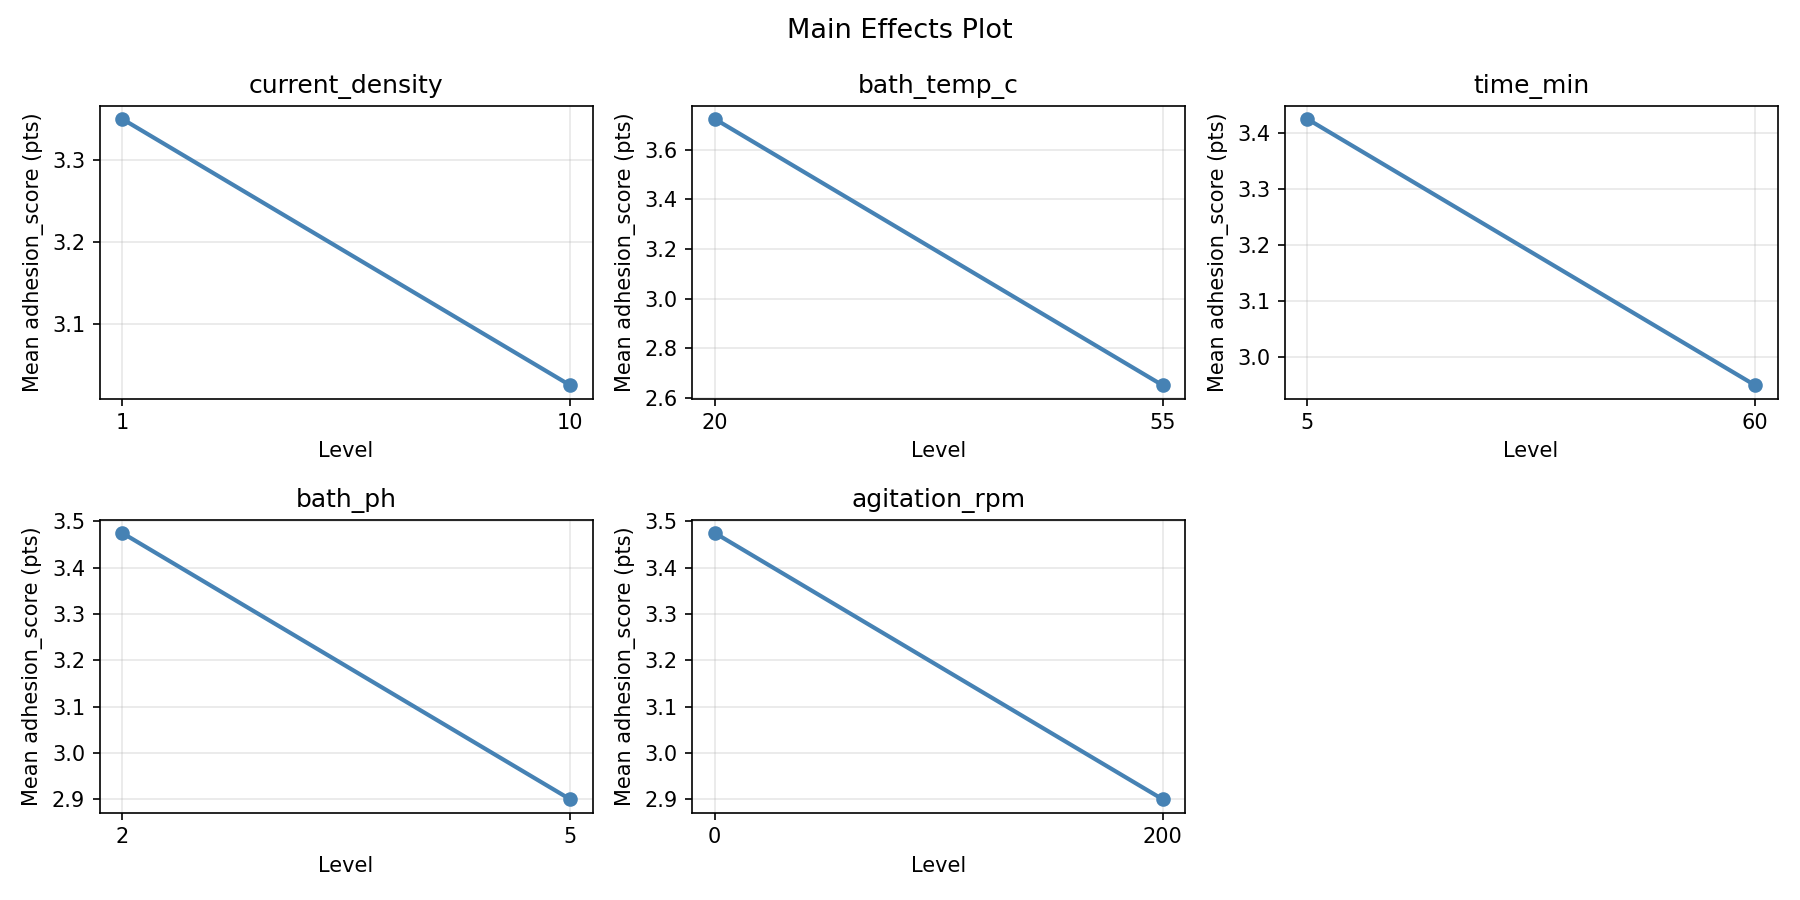
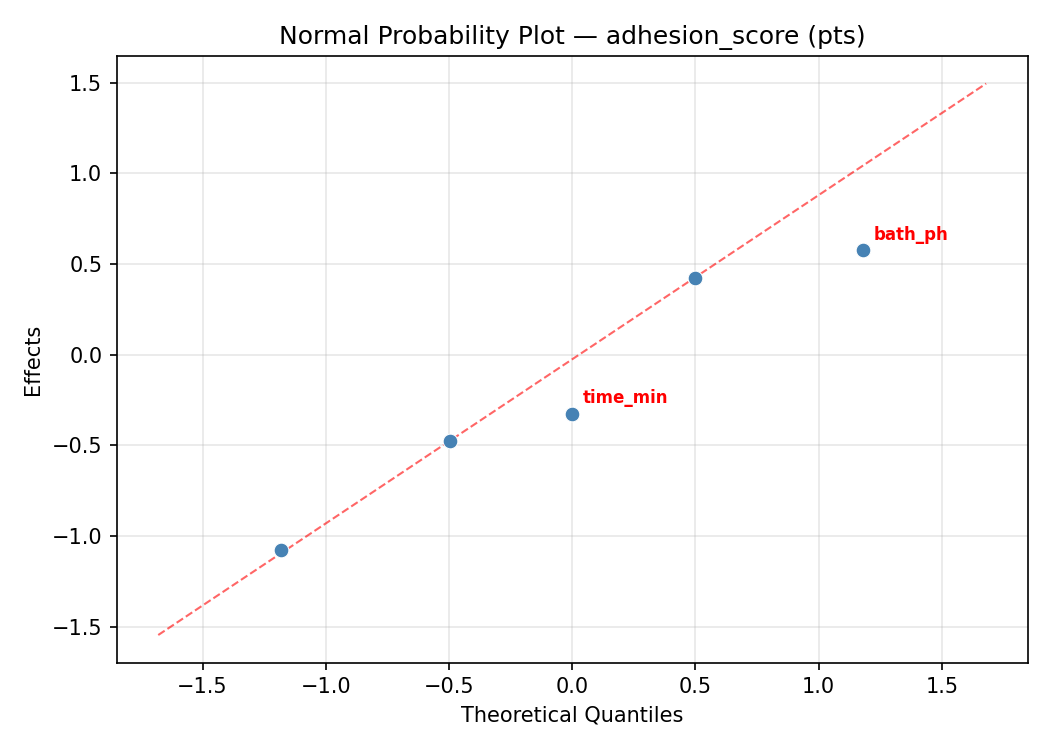
Response: adhesion_score
Top factors: bath_temp_c (35.7%), time_min (21.7%), bath_ph (16.5%).
ANOVA
| Source | DF | SS | MS | F | p-value |
|---|
| Source | DF | SS | MS | F | p-value |
| current_density | 1 | 0.3613 | 0.3613 | 0.667 | 0.4513 |
| bath_temp_c | 1 | 2.1012 | 2.1012 | 3.878 | 0.1060 |
| time_min | 1 | 0.7812 | 0.7812 | 1.442 | 0.2836 |
| bath_ph | 1 | 0.4513 | 0.4513 | 0.833 | 0.4033 |
| agitation_rpm | 1 | 0.2113 | 0.2113 | 0.390 | 0.5598 |
| current_density*bath_temp_c | 1 | 0.7813 | 0.7813 | 1.442 | 0.2836 |
| current_density*time_min | 1 | 2.1012 | 2.1012 | 3.878 | 0.1060 |
| current_density*bath_ph | 1 | 0.2112 | 0.2112 | 0.390 | 0.5598 |
| current_density*agitation_rpm | 1 | 0.4513 | 0.4513 | 0.833 | 0.4033 |
| bath_temp_c*time_min | 1 | 0.3613 | 0.3613 | 0.667 | 0.4513 |
| bath_temp_c*bath_ph | 1 | 0.0012 | 0.0012 | 0.002 | 0.9636 |
| bath_temp_c*agitation_rpm | 1 | 1.2012 | 1.2012 | 2.217 | 0.1967 |
| time_min*bath_ph | 1 | 1.2012 | 1.2012 | 2.217 | 0.1967 |
| time_min*agitation_rpm | 1 | 0.0012 | 0.0012 | 0.002 | 0.9636 |
| bath_ph*agitation_rpm | 1 | 0.3612 | 0.3612 | 0.667 | 0.4513 |
| Error | (Lenth | PSE) | 5 | 2.7094 | 0.5419 |
| Total | 7 | 5.1088 | 0.7298 | | |
Pareto Chart
Main Effects Plot
Normal Probability Plot of Effects
Half-Normal Plot of Effects
Model Diagnostics
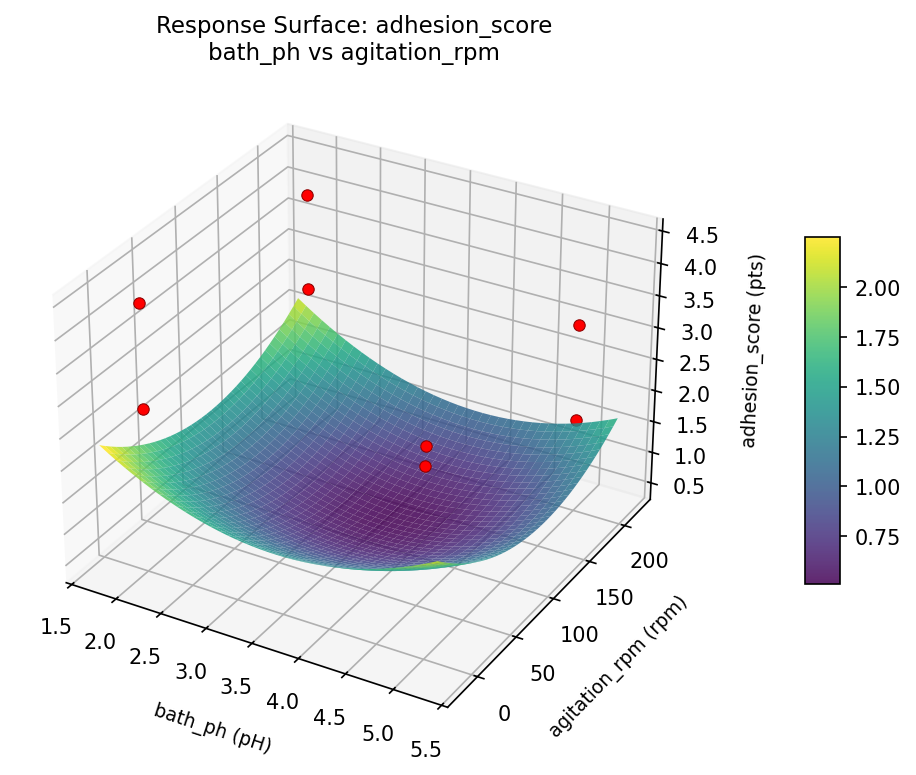
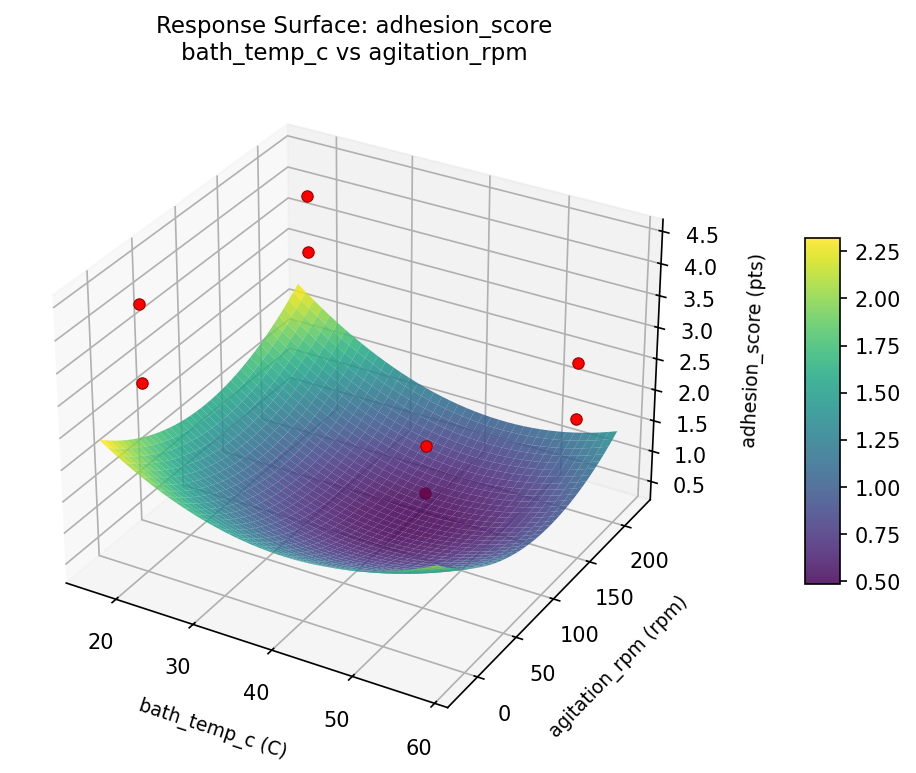
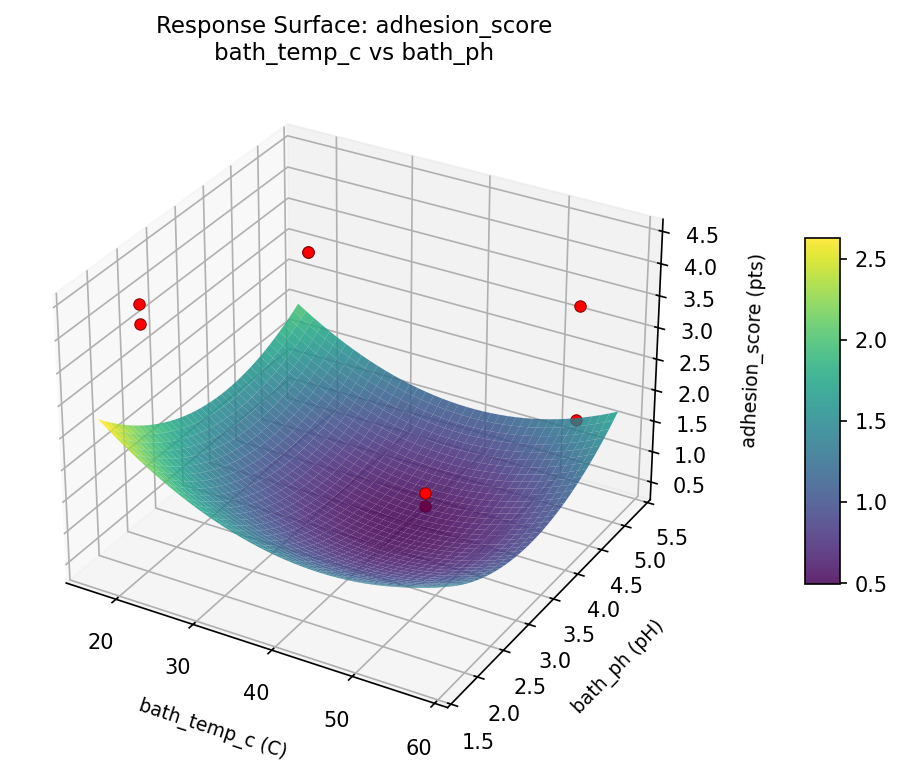
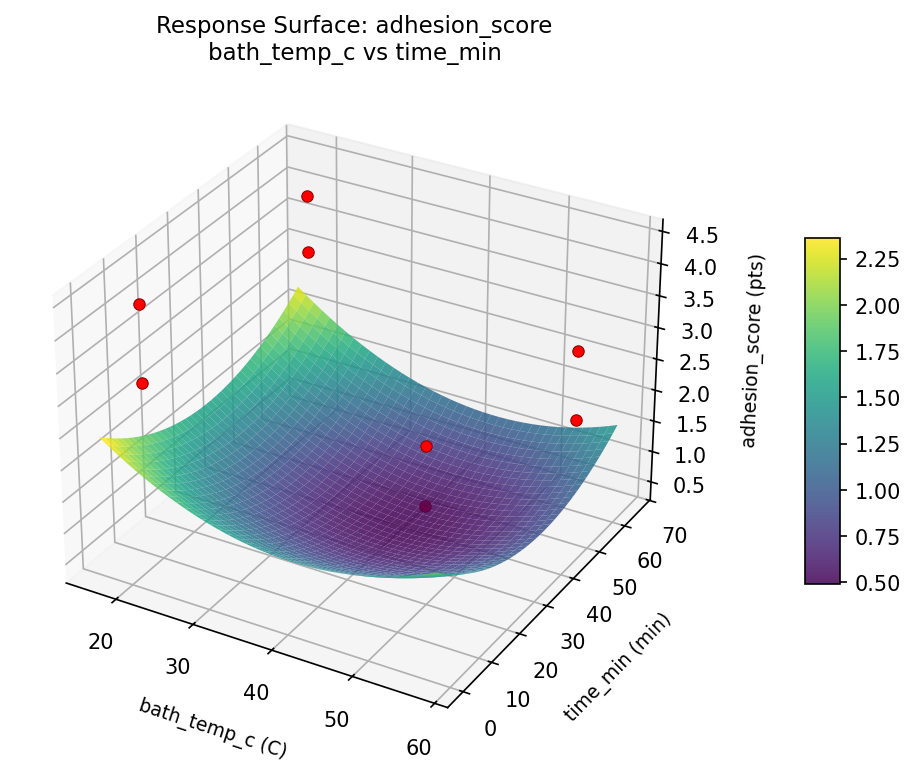
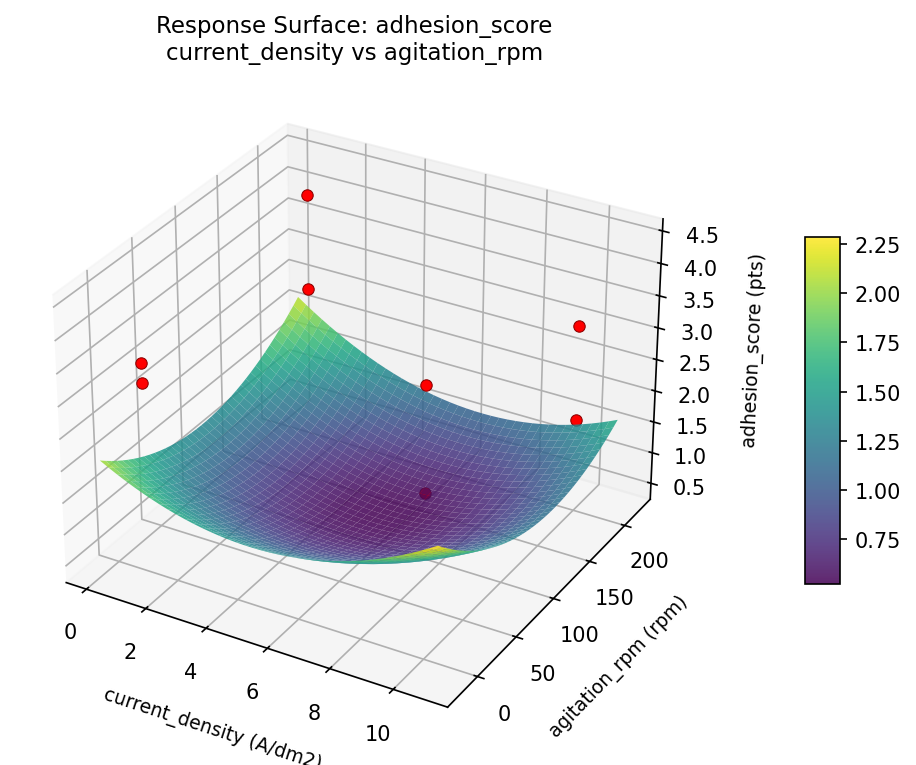
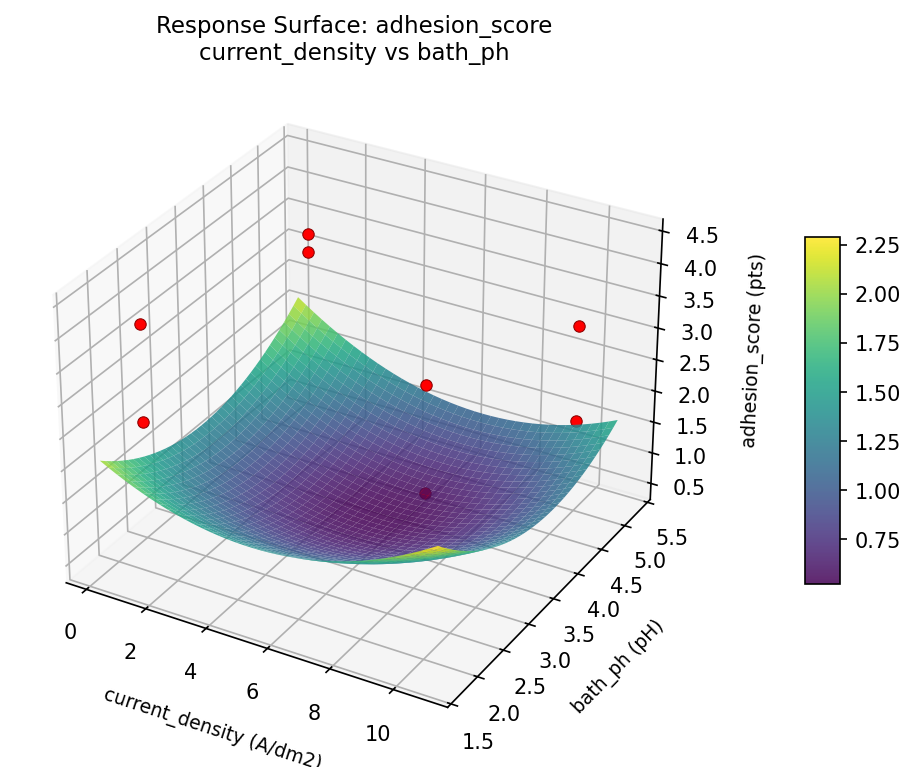
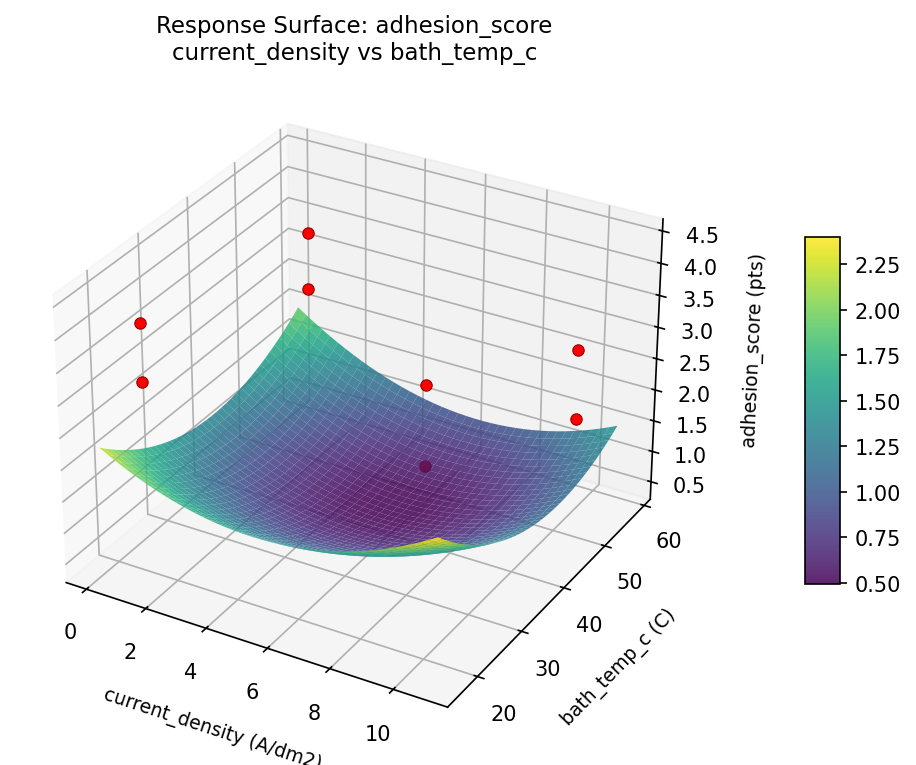
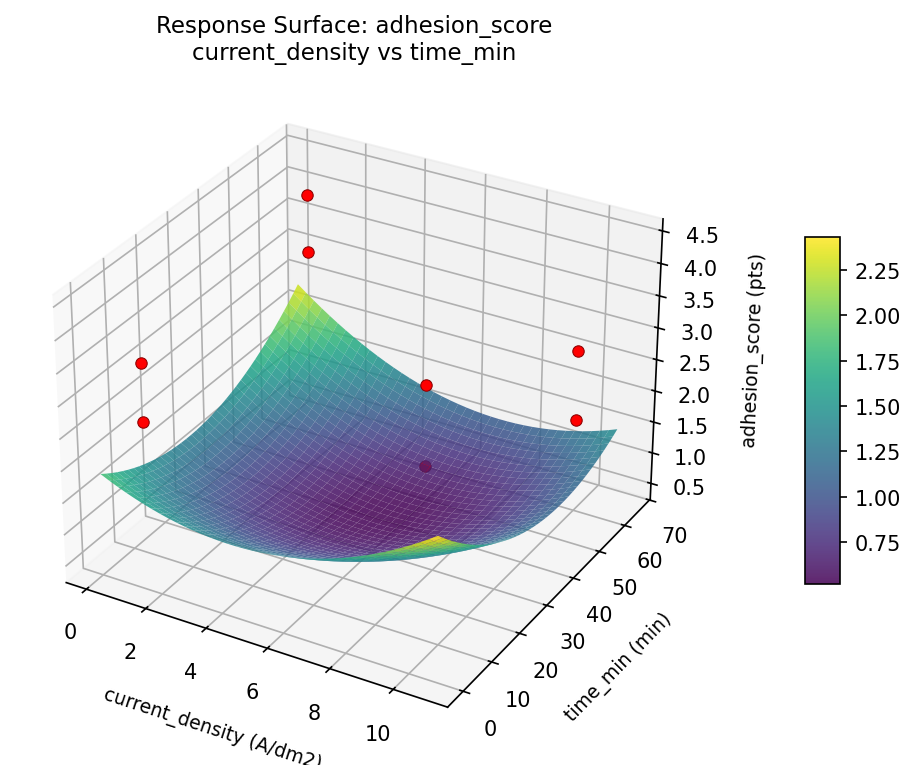
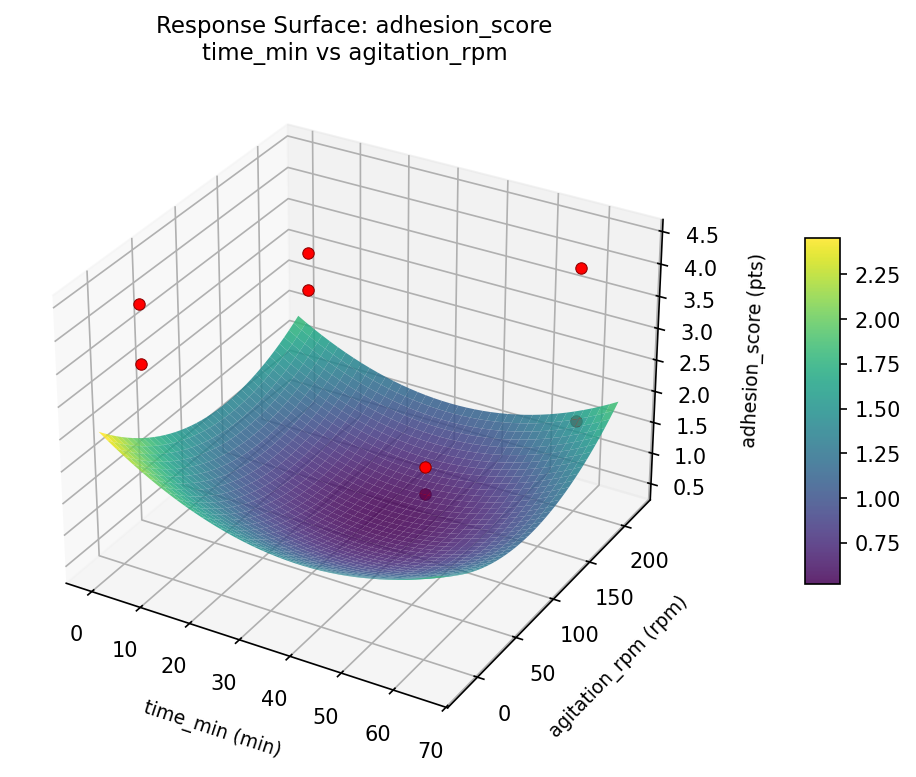
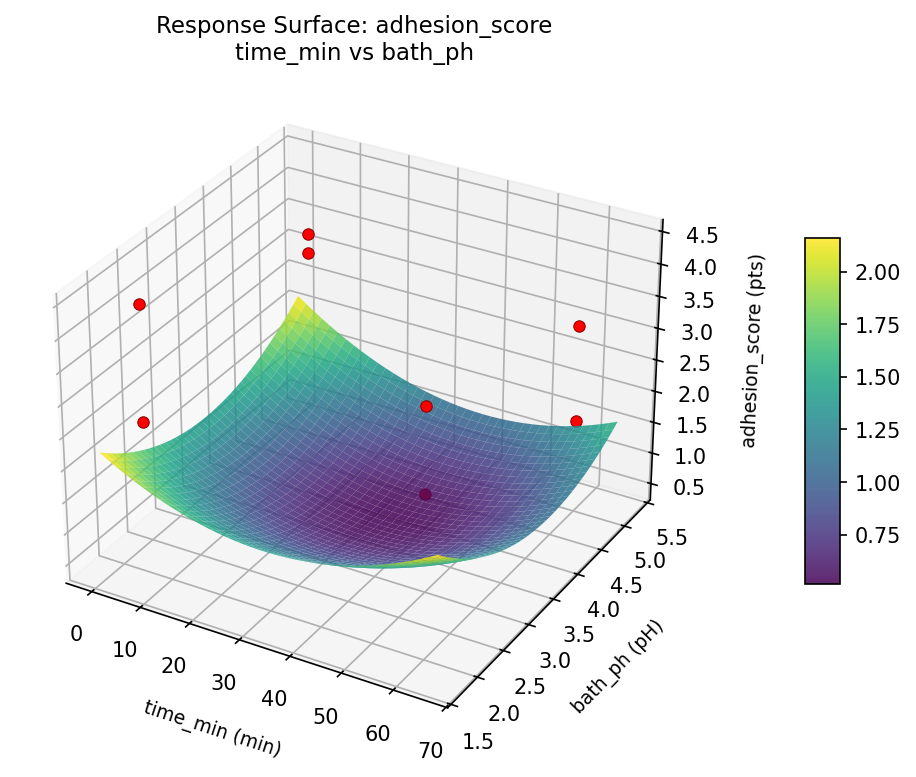
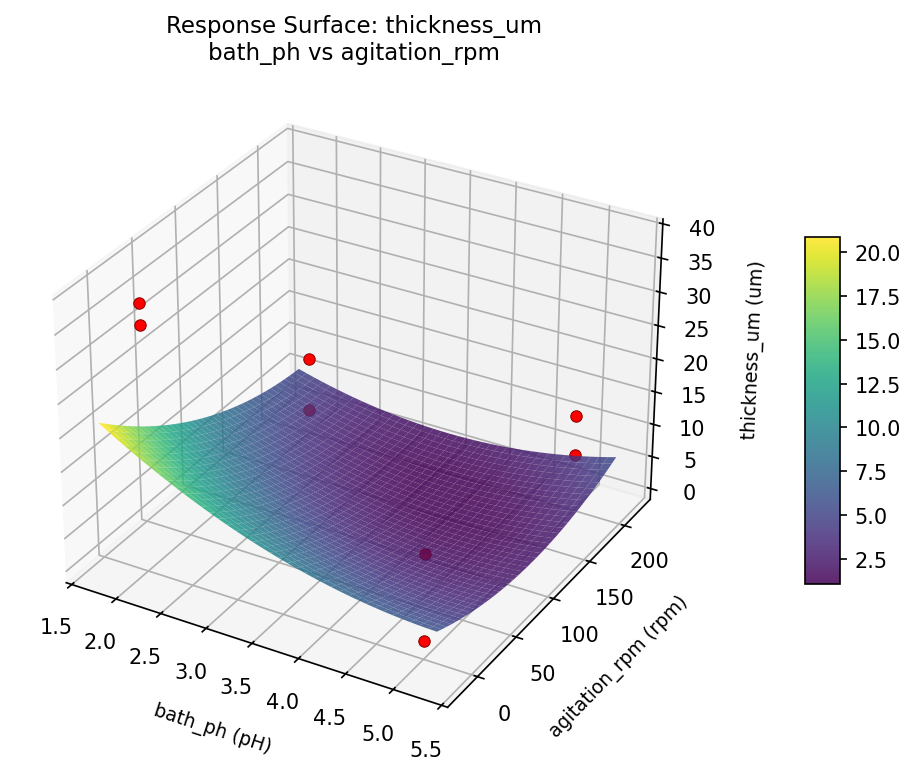
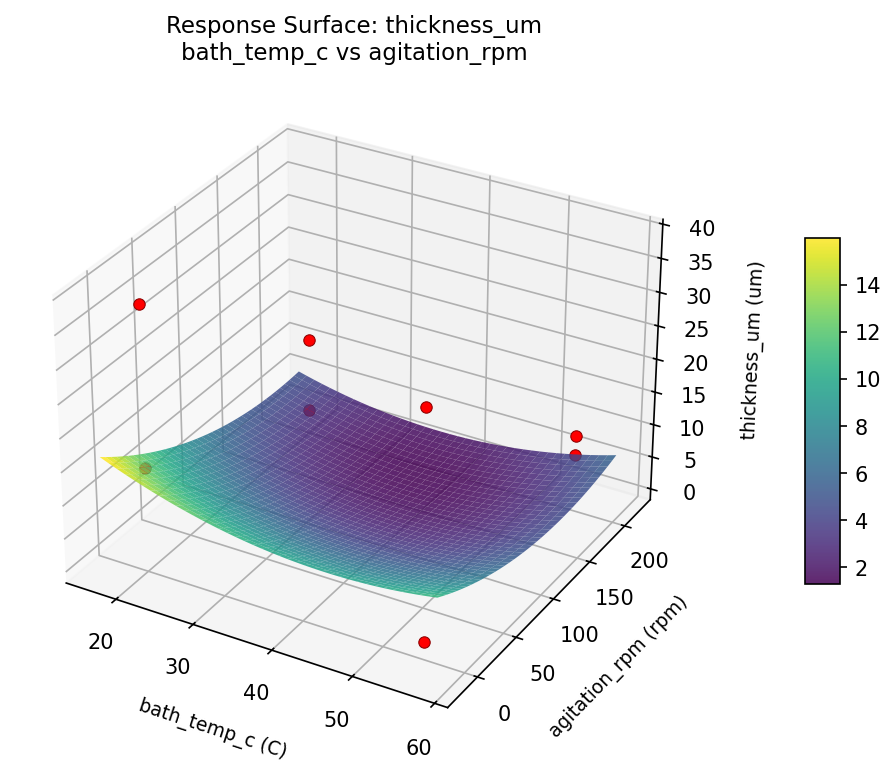
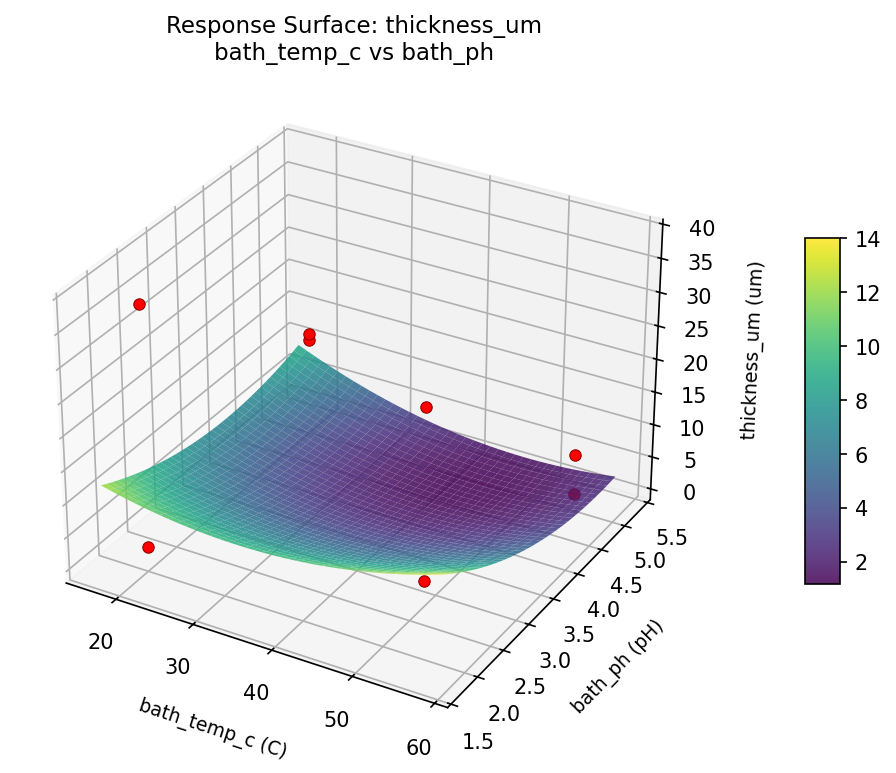
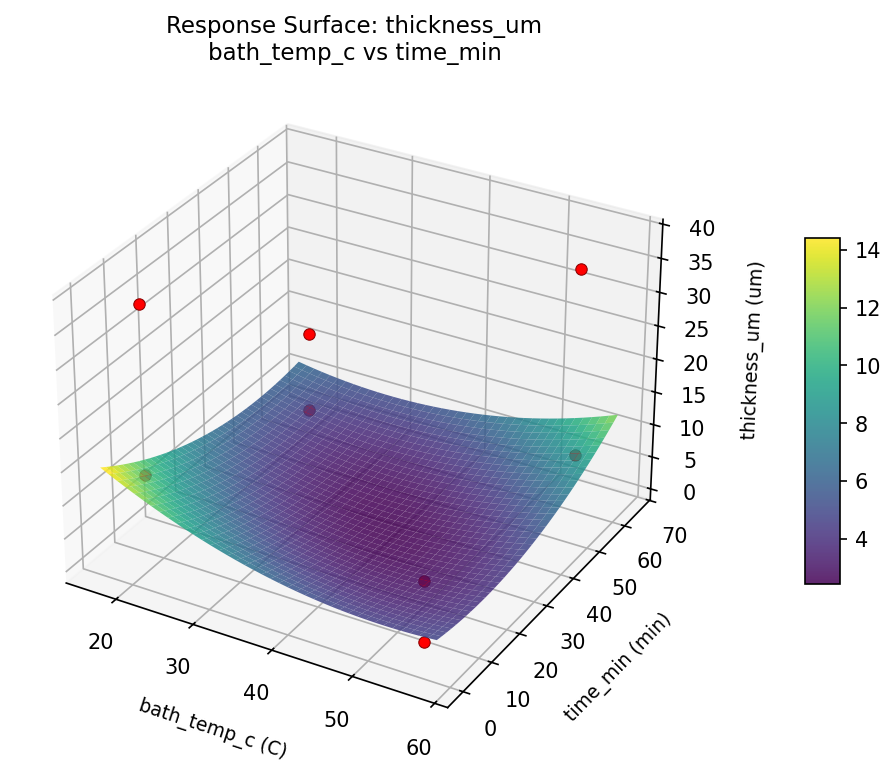
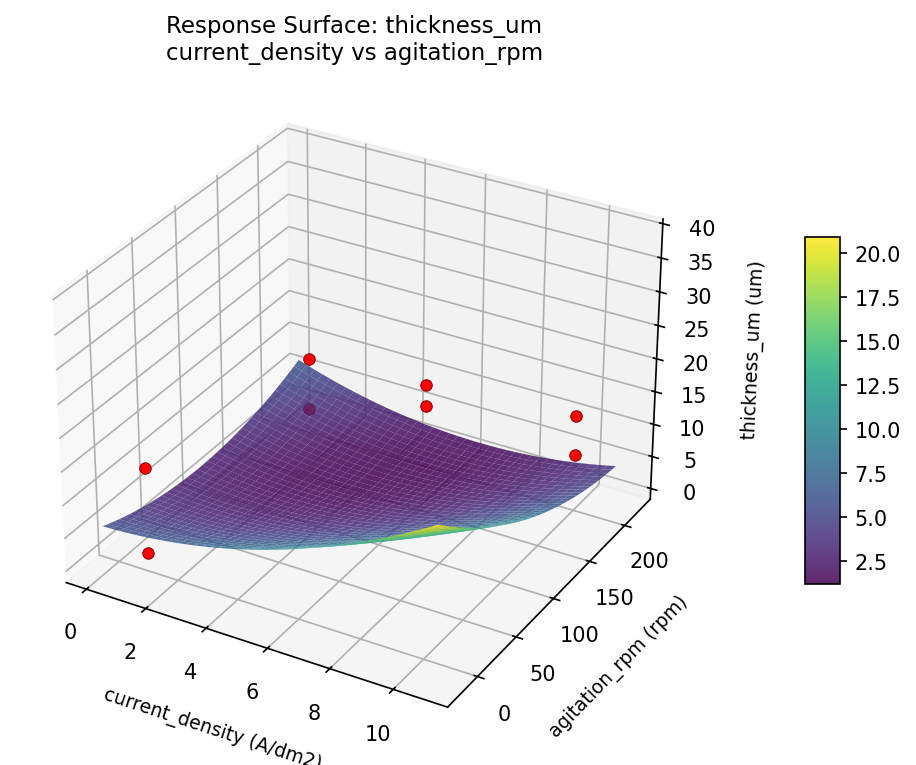
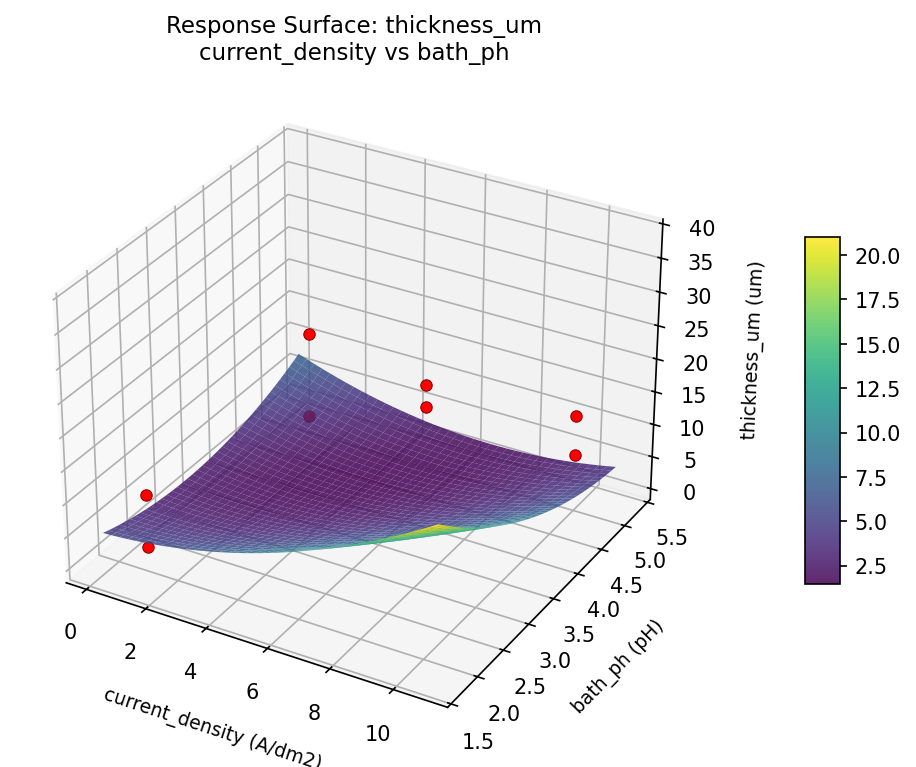
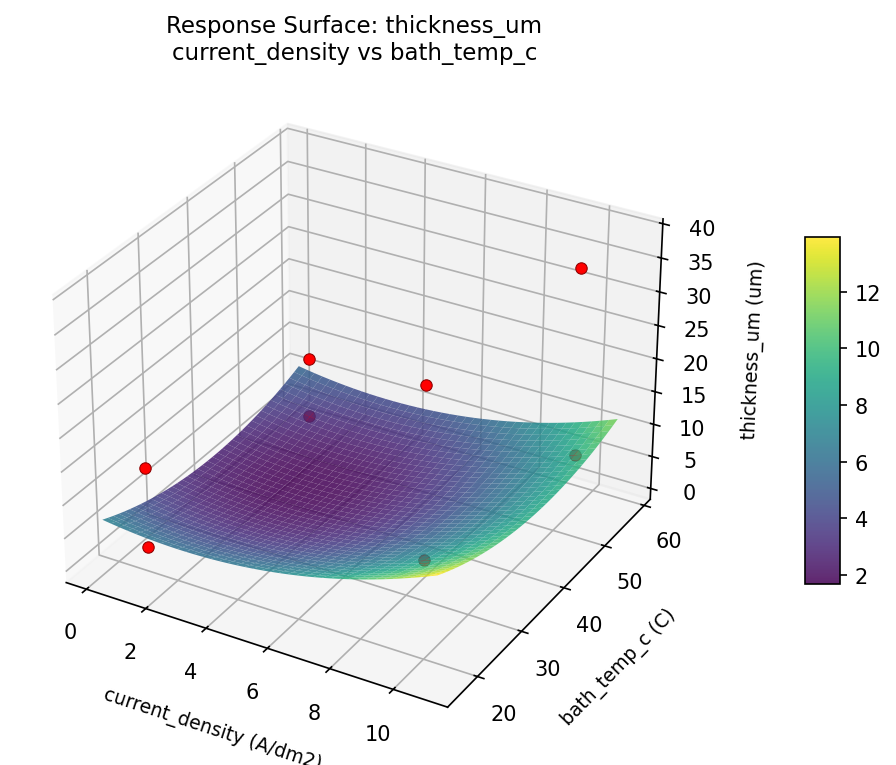
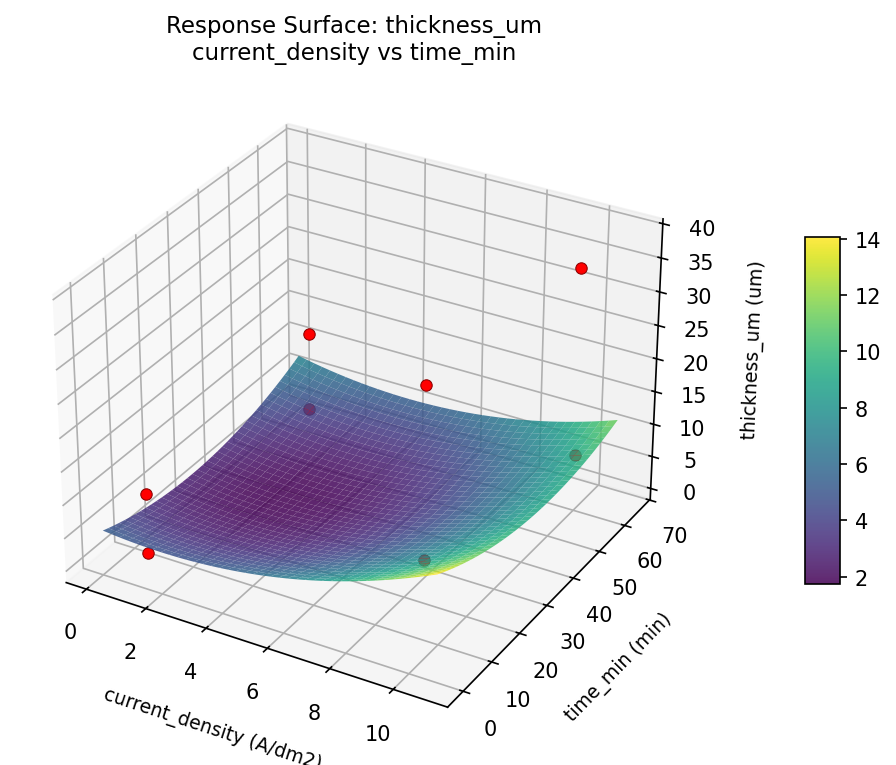
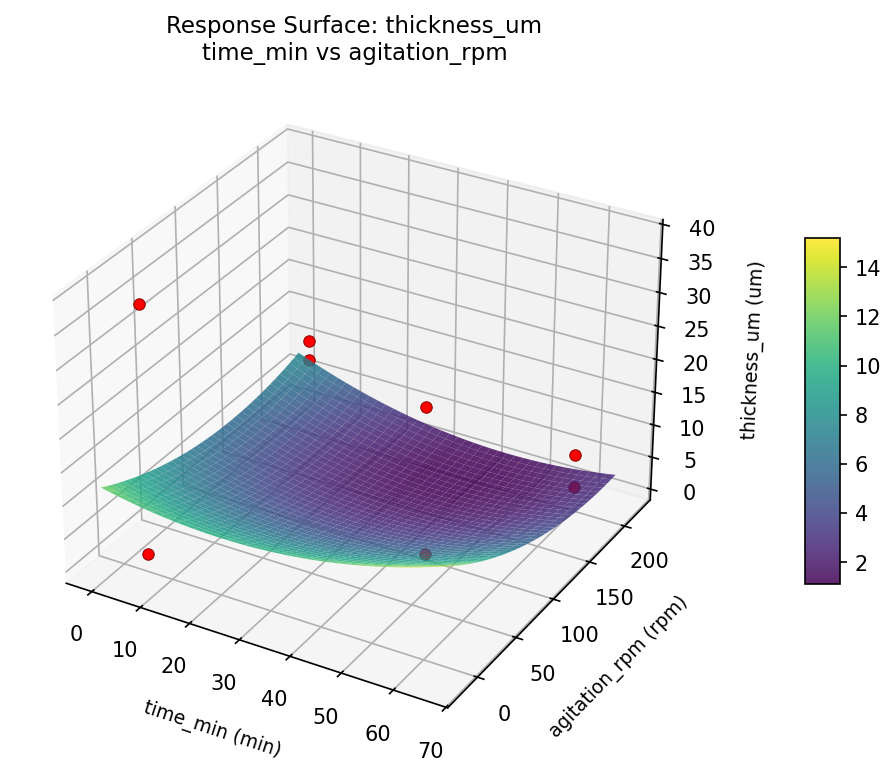
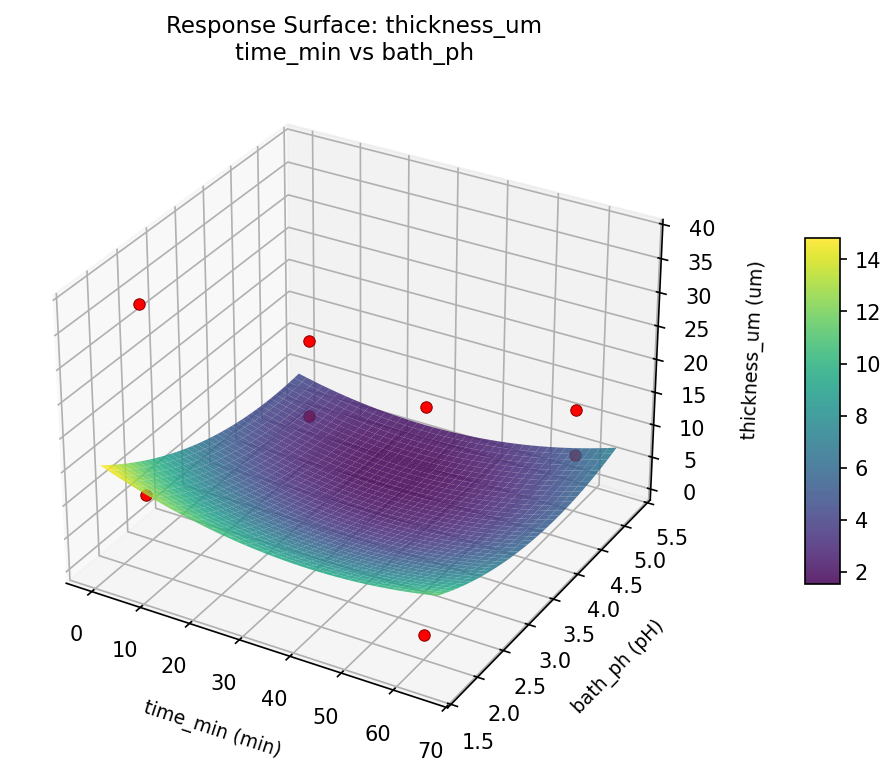
Response Surface Plots
3D surfaces fitted with quadratic RSM. Red dots are observed data points.
adhesion score bath ph vs agitation rpm
adhesion score bath temp c vs agitation rpm
adhesion score bath temp c vs bath ph
adhesion score bath temp c vs time min
adhesion score current density vs agitation rpm
adhesion score current density vs bath ph
adhesion score current density vs bath temp c
adhesion score current density vs time min
adhesion score time min vs agitation rpm
adhesion score time min vs bath ph
thickness um bath ph vs agitation rpm
thickness um bath temp c vs agitation rpm
thickness um bath temp c vs bath ph
thickness um bath temp c vs time min
thickness um current density vs agitation rpm
thickness um current density vs bath ph
thickness um current density vs bath temp c
thickness um current density vs time min
thickness um time min vs agitation rpm
thickness um time min vs bath ph
Multi-Objective Optimization
When responses compete, Derringer–Suich desirability finds the best compromise.
Each response is scaled to a 0–1 desirability, then combined via a weighted geometric mean.
Overall Desirability
D = 0.9545
Per-Response Desirability
| Response | Weight | Desirability | Predicted | Dir |
|---|
thickness_um |
1.0 |
|
38.00 0.9545 38.00 um |
↑ |
adhesion_score |
1.5 |
|
4.40 0.9545 4.40 pts |
↑ |
Recommended Settings
| Factor | Value |
|---|
current_density | 10 A/dm2 |
bath_temp_c | 20 C |
time_min | 5 min |
bath_ph | 5 pH |
agitation_rpm | 200 rpm |
Source: from observed run #4
Trade-off Summary
Sacrifice = how much worse than single-objective best.
| Response | Predicted | Best Observed | Sacrifice |
|---|
adhesion_score | 4.40 | 4.40 | +0.00 |
Top 3 Runs by Desirability
| Run | D | Factor Settings |
|---|
| #1 | 0.5614 | current_density=10, bath_temp_c=55, time_min=60, bath_ph=2, agitation_rpm=0 |
| #2 | 0.4670 | current_density=1, bath_temp_c=55, time_min=5, bath_ph=5, agitation_rpm=0 |
Model Quality
| Response | R² | Type |
|---|
adhesion_score | 0.9878 | linear |
Full Multi-Objective Output
============================================================
MULTI-OBJECTIVE OPTIMIZATION
Method: Derringer-Suich Desirability Function
============================================================
Overall desirability: D = 0.9545
Response Weight Desirability Predicted Direction
---------------------------------------------------------------------
thickness_um 1.0 0.9545 38.00 um ↑
adhesion_score 1.5 0.9545 4.40 pts ↑
Recommended settings:
current_density = 10 A/dm2
bath_temp_c = 20 C
time_min = 5 min
bath_ph = 5 pH
agitation_rpm = 200 rpm
(from observed run #4)
Trade-off summary:
thickness_um: 38.00 (best observed: 38.00, sacrifice: +0.00)
adhesion_score: 4.40 (best observed: 4.40, sacrifice: +0.00)
Model quality:
thickness_um: R² = 0.3325 (linear)
adhesion_score: R² = 0.9878 (linear)
Top 3 observed runs by overall desirability:
1. Run #4 (D=0.9545): current_density=10, bath_temp_c=20, time_min=5, bath_ph=5, agitation_rpm=200
2. Run #1 (D=0.5614): current_density=10, bath_temp_c=55, time_min=60, bath_ph=2, agitation_rpm=0
3. Run #2 (D=0.4670): current_density=1, bath_temp_c=55, time_min=5, bath_ph=5, agitation_rpm=0
Full Analysis Output
=== Main Effects: thickness_um ===
Factor Effect Std Error % Contribution
--------------------------------------------------------------
current_density 20.0000 4.9785 44.4%
time_min 15.0000 4.9785 33.3%
bath_temp_c 8.0000 4.9785 17.8%
bath_ph 1.5000 4.9785 3.3%
agitation_rpm 0.5000 4.9785 1.1%
=== ANOVA Table: thickness_um ===
Source DF SS MS F p-value
-----------------------------------------------------------------------------
current_density 1 800.0000 800.0000 213.333 0.0000
bath_temp_c 1 128.0000 128.0000 34.133 0.0021
time_min 1 450.0000 450.0000 120.000 0.0001
bath_ph 1 4.5000 4.5000 1.200 0.3233
agitation_rpm 1 0.5000 0.5000 0.133 0.7299
current_density*bath_temp_c 1 450.0000 450.0000 120.000 0.0001
current_density*time_min 1 128.0000 128.0000 34.133 0.0021
current_density*bath_ph 1 0.5000 0.5000 0.133 0.7299
current_density*agitation_rpm 1 4.5000 4.5000 1.200 0.3233
bath_temp_c*time_min 1 800.0000 800.0000 213.333 0.0000
bath_temp_c*bath_ph 1 0.5000 0.5000 0.133 0.7299
bath_temp_c*agitation_rpm 1 4.5000 4.5000 1.200 0.3233
time_min*bath_ph 1 4.5000 4.5000 1.200 0.3233
time_min*agitation_rpm 1 0.5000 0.5000 0.133 0.7299
bath_ph*agitation_rpm 1 800.0000 800.0000 213.333 0.0000
Error (Lenth PSE) 5 18.7500 3.7500
Total 7 1388.0000 198.2857
Note: Error estimated using Lenth's pseudo-standard-error (unreplicated design)
=== Interaction Effects: thickness_um ===
Factor A Factor B Interaction % Contribution
------------------------------------------------------------------------
bath_temp_c time_min 20.0000 29.0%
bath_ph agitation_rpm 20.0000 29.0%
current_density bath_temp_c 15.0000 21.7%
current_density time_min 8.0000 11.6%
current_density agitation_rpm 1.5000 2.2%
bath_temp_c agitation_rpm 1.5000 2.2%
time_min bath_ph 1.5000 2.2%
current_density bath_ph 0.5000 0.7%
bath_temp_c bath_ph -0.5000 0.7%
time_min agitation_rpm -0.5000 0.7%
=== Summary Statistics: thickness_um ===
current_density:
Level N Mean Std Min Max
------------------------------------------------------------
1 4 5.0000 4.2426 1.0000 10.0000
10 4 25.0000 13.3417 13.0000 38.0000
bath_temp_c:
Level N Mean Std Min Max
------------------------------------------------------------
20 4 11.0000 3.1623 7.0000 14.0000
55 4 19.0000 20.2485 1.0000 38.0000
time_min:
Level N Mean Std Min Max
------------------------------------------------------------
5 4 7.5000 6.9522 1.0000 14.0000
60 4 22.5000 16.2583 7.0000 38.0000
bath_ph:
Level N Mean Std Min Max
------------------------------------------------------------
2 4 14.2500 14.5459 2.0000 35.0000
5 4 15.7500 15.7982 1.0000 38.0000
agitation_rpm:
Level N Mean Std Min Max
------------------------------------------------------------
0 4 14.7500 14.4309 1.0000 35.0000
200 4 15.2500 15.9452 2.0000 38.0000
=== Main Effects: adhesion_score ===
Factor Effect Std Error % Contribution
--------------------------------------------------------------
bath_temp_c 1.0250 0.3020 35.7%
time_min -0.6250 0.3020 21.7%
bath_ph 0.4750 0.3020 16.5%
current_density 0.4250 0.3020 14.8%
agitation_rpm 0.3250 0.3020 11.3%
=== ANOVA Table: adhesion_score ===
Source DF SS MS F p-value
-----------------------------------------------------------------------------
current_density 1 0.3613 0.3613 0.667 0.4513
bath_temp_c 1 2.1012 2.1012 3.878 0.1060
time_min 1 0.7812 0.7812 1.442 0.2836
bath_ph 1 0.4513 0.4513 0.833 0.4033
agitation_rpm 1 0.2113 0.2113 0.390 0.5598
current_density*bath_temp_c 1 0.7813 0.7813 1.442 0.2836
current_density*time_min 1 2.1012 2.1012 3.878 0.1060
current_density*bath_ph 1 0.2112 0.2112 0.390 0.5598
current_density*agitation_rpm 1 0.4513 0.4513 0.833 0.4033
bath_temp_c*time_min 1 0.3613 0.3613 0.667 0.4513
bath_temp_c*bath_ph 1 0.0012 0.0012 0.002 0.9636
bath_temp_c*agitation_rpm 1 1.2012 1.2012 2.217 0.1967
time_min*bath_ph 1 1.2012 1.2012 2.217 0.1967
time_min*agitation_rpm 1 0.0012 0.0012 0.002 0.9636
bath_ph*agitation_rpm 1 0.3612 0.3612 0.667 0.4513
Error (Lenth PSE) 5 2.7094 0.5419
Total 7 5.1088 0.7298
Note: Error estimated using Lenth's pseudo-standard-error (unreplicated design)
=== Interaction Effects: adhesion_score ===
Factor A Factor B Interaction % Contribution
------------------------------------------------------------------------
current_density time_min 1.0250 20.9%
bath_temp_c agitation_rpm 0.7750 15.8%
time_min bath_ph 0.7750 15.8%
current_density bath_temp_c -0.6250 12.8%
current_density agitation_rpm 0.4750 9.7%
bath_temp_c time_min 0.4250 8.7%
bath_ph agitation_rpm 0.4250 8.7%
current_density bath_ph 0.3250 6.6%
bath_temp_c bath_ph 0.0250 0.5%
time_min agitation_rpm 0.0250 0.5%
=== Summary Statistics: adhesion_score ===
current_density:
Level N Mean Std Min Max
------------------------------------------------------------
1 4 2.9750 1.0500 1.7000 4.1000
10 4 3.4000 0.6928 2.8000 4.4000
bath_temp_c:
Level N Mean Std Min Max
------------------------------------------------------------
20 4 2.6750 0.7089 1.7000 3.2000
55 4 3.7000 0.7071 2.8000 4.4000
time_min:
Level N Mean Std Min Max
------------------------------------------------------------
5 4 3.5000 0.4243 3.2000 4.1000
60 4 2.8750 1.1236 1.7000 4.4000
bath_ph:
Level N Mean Std Min Max
------------------------------------------------------------
2 4 2.9500 0.9950 1.7000 4.1000
5 4 3.4250 0.7500 2.6000 4.4000
agitation_rpm:
Level N Mean Std Min Max
------------------------------------------------------------
0 4 3.0250 0.4031 2.6000 3.5000
200 4 3.3500 1.2124 1.7000 4.4000
Optimization Recommendations
=== Optimization: thickness_um ===
Direction: maximize
Best observed run: #4
current_density = 10
bath_temp_c = 20
time_min = 5
bath_ph = 5
agitation_rpm = 200
Value: 38.0
RSM Model (linear, R² = 0.7716, Adj R² = 0.2006):
Coefficients:
intercept +15.0000
current_density +2.0000
bath_temp_c -8.5000
time_min +3.0000
bath_ph +1.7500
agitation_rpm +6.7500
Predicted optimum (from linear model, at observed points):
current_density = 10
bath_temp_c = 20
time_min = 5
bath_ph = 5
agitation_rpm = 200
Predicted value: 31.0000
Surface optimum (via L-BFGS-B, linear model):
current_density = 10
bath_temp_c = 20
time_min = 60
bath_ph = 5
agitation_rpm = 200
Predicted value: 37.0000
Model quality: Good fit — general trends are captured, some noise remains.
Factor importance:
1. bath_temp_c (effect: -17.0, contribution: 38.6%)
2. agitation_rpm (effect: 13.5, contribution: 30.7%)
3. time_min (effect: 6.0, contribution: 13.6%)
4. current_density (effect: 4.0, contribution: 9.1%)
5. bath_ph (effect: 3.5, contribution: 8.0%)
=== Optimization: adhesion_score ===
Direction: maximize
Best observed run: #4
current_density = 10
bath_temp_c = 20
time_min = 5
bath_ph = 5
agitation_rpm = 200
Value: 4.4
RSM Model (linear, R² = 0.7822, Adj R² = 0.2378):
Coefficients:
intercept +3.1875
current_density -0.2125
bath_temp_c +0.1625
time_min -0.2375
bath_ph +0.5375
agitation_rpm +0.2875
Predicted optimum (from linear model, at observed points):
current_density = 1
bath_temp_c = 55
time_min = 5
bath_ph = 5
agitation_rpm = 0
Predicted value: 4.0500
Surface optimum (via L-BFGS-B, linear model):
current_density = 1
bath_temp_c = 55
time_min = 5
bath_ph = 5
agitation_rpm = 200
Predicted value: 4.6250
Model quality: Good fit — general trends are captured, some noise remains.
Factor importance:
1. bath_ph (effect: 1.1, contribution: 37.4%)
2. agitation_rpm (effect: 0.6, contribution: 20.0%)
3. time_min (effect: -0.5, contribution: 16.5%)
4. current_density (effect: -0.4, contribution: 14.8%)
5. bath_temp_c (effect: 0.3, contribution: 11.3%)