Summary
This experiment investigates table saw cut quality. Central composite design to maximize cut smoothness and minimize tearout by tuning blade speed, feed rate, and blade tooth count.
The design varies 3 factors: blade rpm (rpm), ranging from 3000 to 5000, feed rate (m/min), ranging from 1 to 5, and tooth count (teeth), ranging from 24 to 80. The goal is to optimize 2 responses: smoothness (pts) (maximize) and tearout score (pts) (minimize). Fixed conditions held constant across all runs include blade diam = 10in, material = maple.
A Central Composite Design (CCD) was selected to fit a full quadratic response surface model, including curvature and interaction effects. With 3 factors this produces 22 runs including center points and axial (star) points that extend beyond the factorial range.
Quadratic response surface models were fitted to capture potential curvature and factor interactions. The RSM contour plots below visualize how pairs of factors jointly affect each response.
Key Findings
For smoothness, the most influential factors were feed rate (51.1%), blade rpm (28.7%), tooth count (20.2%). The best observed value was 9.1 (at blade rpm = 3000, feed rate = 5, tooth count = 24).
For tearout score, the most influential factors were blade rpm (40.0%), feed rate (39.7%), tooth count (20.4%). The best observed value was 1.5 (at blade rpm = 3000, feed rate = 5, tooth count = 24).
Recommended Next Steps
- Run confirmation experiments at the predicted optimal settings to validate the model.
- Consider whether any fixed factors should be varied in a future study.
Experimental Setup
Factors
| Factor | Low | High | Unit |
|---|
blade_rpm | 3000 | 5000 | rpm |
feed_rate | 1 | 5 | m/min |
tooth_count | 24 | 80 | teeth |
Fixed: blade_diam = 10in, material = maple
Responses
| Response | Direction | Unit |
|---|
smoothness | ↑ maximize | pts |
tearout_score | ↓ minimize | pts |
Configuration
{
"metadata": {
"name": "Table Saw Cut Quality",
"description": "Central composite design to maximize cut smoothness and minimize tearout by tuning blade speed, feed rate, and blade tooth count"
},
"factors": [
{
"name": "blade_rpm",
"levels": [
"3000",
"5000"
],
"type": "continuous",
"unit": "rpm"
},
{
"name": "feed_rate",
"levels": [
"1",
"5"
],
"type": "continuous",
"unit": "m/min"
},
{
"name": "tooth_count",
"levels": [
"24",
"80"
],
"type": "continuous",
"unit": "teeth"
}
],
"fixed_factors": {
"blade_diam": "10in",
"material": "maple"
},
"responses": [
{
"name": "smoothness",
"optimize": "maximize",
"unit": "pts"
},
{
"name": "tearout_score",
"optimize": "minimize",
"unit": "pts"
}
],
"settings": {
"operation": "central_composite",
"test_script": "use_cases/200_table_saw_cut/sim.sh"
}
}
Experimental Matrix
The Central Composite Design produces 22 runs. Each row is one experiment with specific factor settings.
| Run | blade_rpm | feed_rate | tooth_count |
|---|
| 1 | 4000 | 3 | 52 |
| 2 | 5000 | 1 | 80 |
| 3 | 3000 | 5 | 24 |
| 4 | 4000 | 6.65148 | 52 |
| 5 | 4000 | 3 | 52 |
| 6 | 2174.26 | 3 | 52 |
| 7 | 4000 | 3 | 0.879228 |
| 8 | 4000 | 3 | 52 |
| 9 | 5000 | 5 | 24 |
| 10 | 5825.74 | 3 | 52 |
| 11 | 4000 | 3 | 52 |
| 12 | 4000 | -0.651484 | 52 |
| 13 | 4000 | 3 | 52 |
| 14 | 3000 | 1 | 80 |
| 15 | 4000 | 3 | 52 |
| 16 | 5000 | 1 | 24 |
| 17 | 4000 | 3 | 103.121 |
| 18 | 5000 | 5 | 80 |
| 19 | 4000 | 3 | 52 |
| 20 | 3000 | 1 | 24 |
| 21 | 3000 | 5 | 80 |
| 22 | 4000 | 3 | 52 |
Step-by-Step Workflow
1
Preview the design
$ doe info --config use_cases/200_table_saw_cut/config.json
2
Generate the runner script
$ doe generate --config use_cases/200_table_saw_cut/config.json \
--output use_cases/200_table_saw_cut/results/run.sh --seed 42
3
Execute the experiments
$ bash use_cases/200_table_saw_cut/results/run.sh
4
Analyze results
$ doe analyze --config use_cases/200_table_saw_cut/config.json
5
Get optimization recommendations
$ doe optimize --config use_cases/200_table_saw_cut/config.json
6
Multi-objective optimization
With 2 competing responses, use --multi to find the best compromise via Derringer–Suich desirability.
$ doe optimize --config use_cases/200_table_saw_cut/config.json --multi
7
Generate the HTML report
$ doe report --config use_cases/200_table_saw_cut/config.json \
--output use_cases/200_table_saw_cut/results/report.html
Features Exercised
| Feature | Value |
|---|
| Design type | central_composite |
| Factor types | continuous (all 3) |
| Arg style | double-dash |
| Responses | 2 (smoothness ↑, tearout_score ↓) |
| Total runs | 22 |
Analysis Results
Generated from actual experiment runs using the DOE Helper Tool.
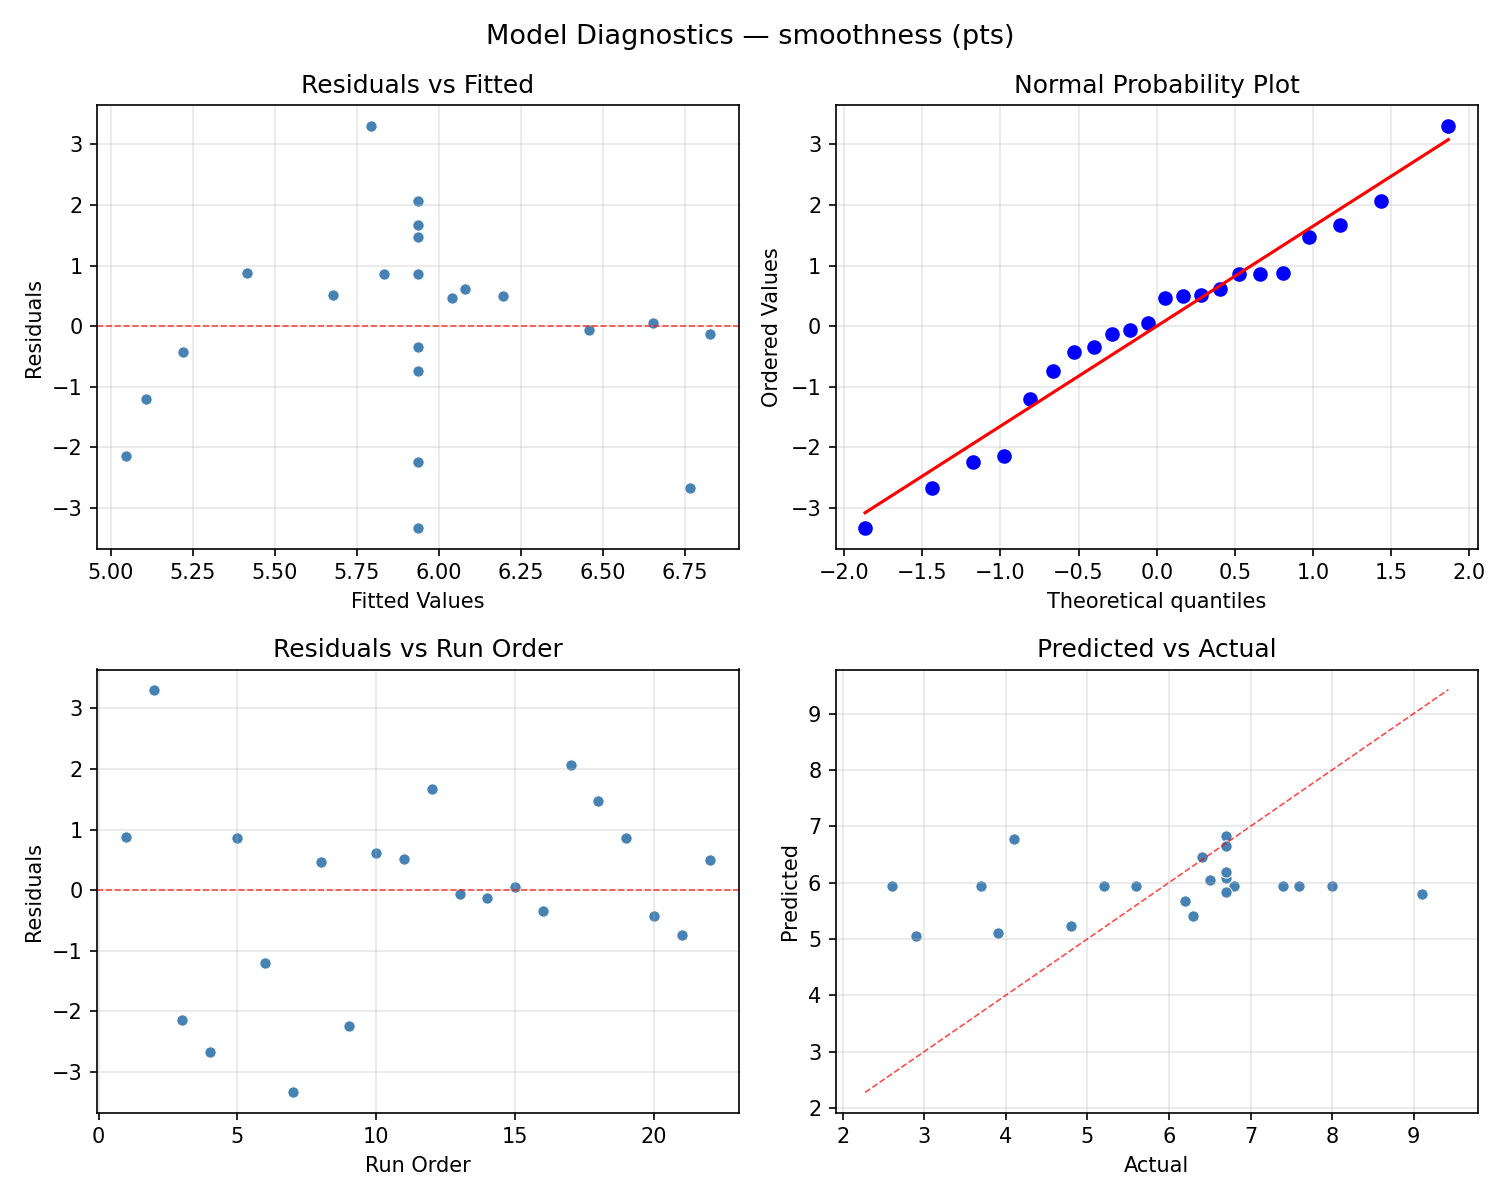
Response: smoothness
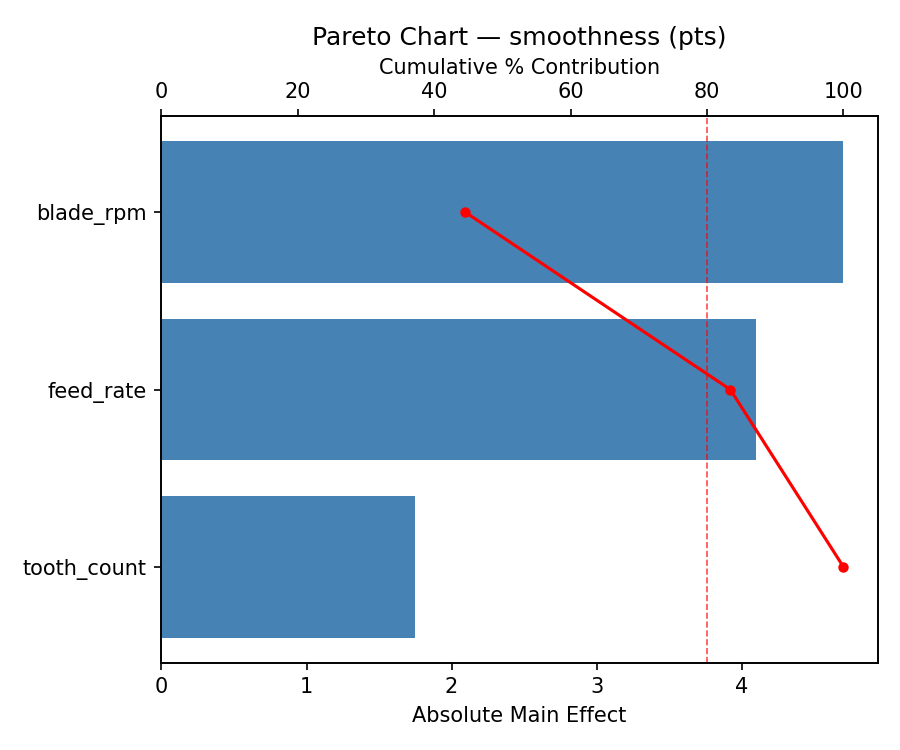
Top factors: feed_rate (51.1%), blade_rpm (28.7%), tooth_count (20.2%).
ANOVA
| Source | DF | SS | MS | F | p-value |
|---|
| Source | DF | SS | MS | F | p-value |
| blade_rpm | 4 | 16.7909 | 4.1977 | 1.892 | 0.1961 |
| feed_rate | 4 | 19.6459 | 4.9115 | 2.214 | 0.1481 |
| tooth_count | 4 | 5.0484 | 1.2621 | 0.569 | 0.6919 |
| Lack | of | Fit | 2 | 1.3769 | 0.6885 |
| Pure | Error | 7 | 15.5287 | | |
| Error | 9 | 16.9057 | 2.2184 | | |
| Total | 21 | 58.3909 | 2.7805 | | |
Pareto Chart
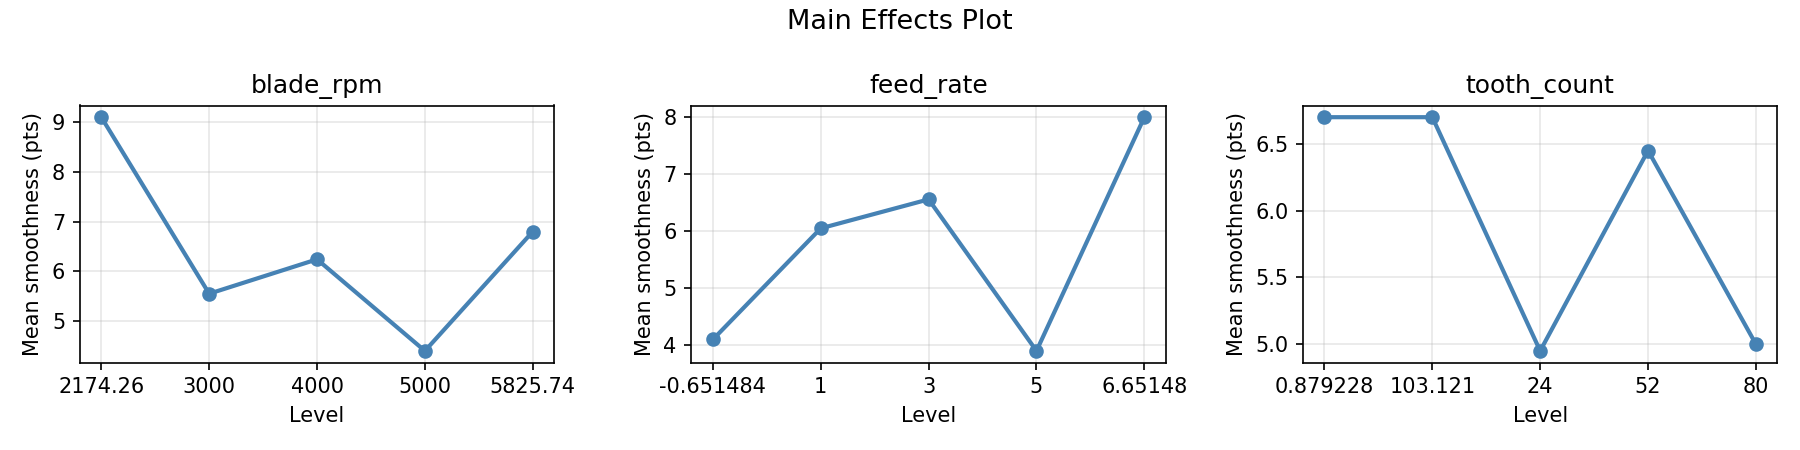
Main Effects Plot
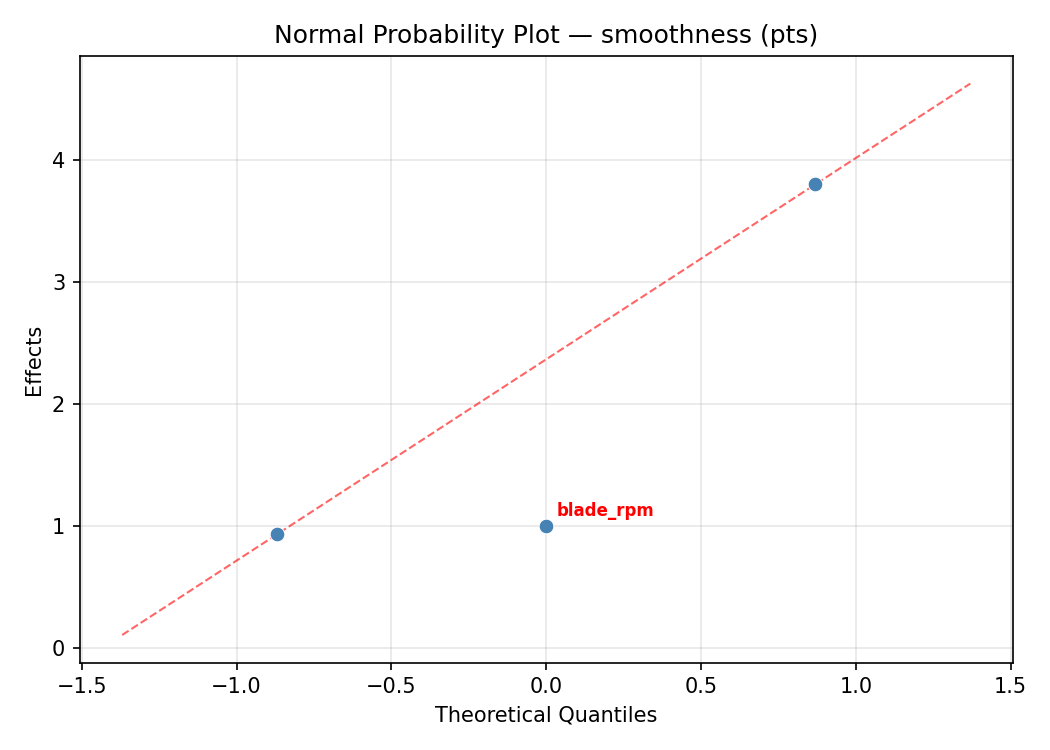
Normal Probability Plot of Effects
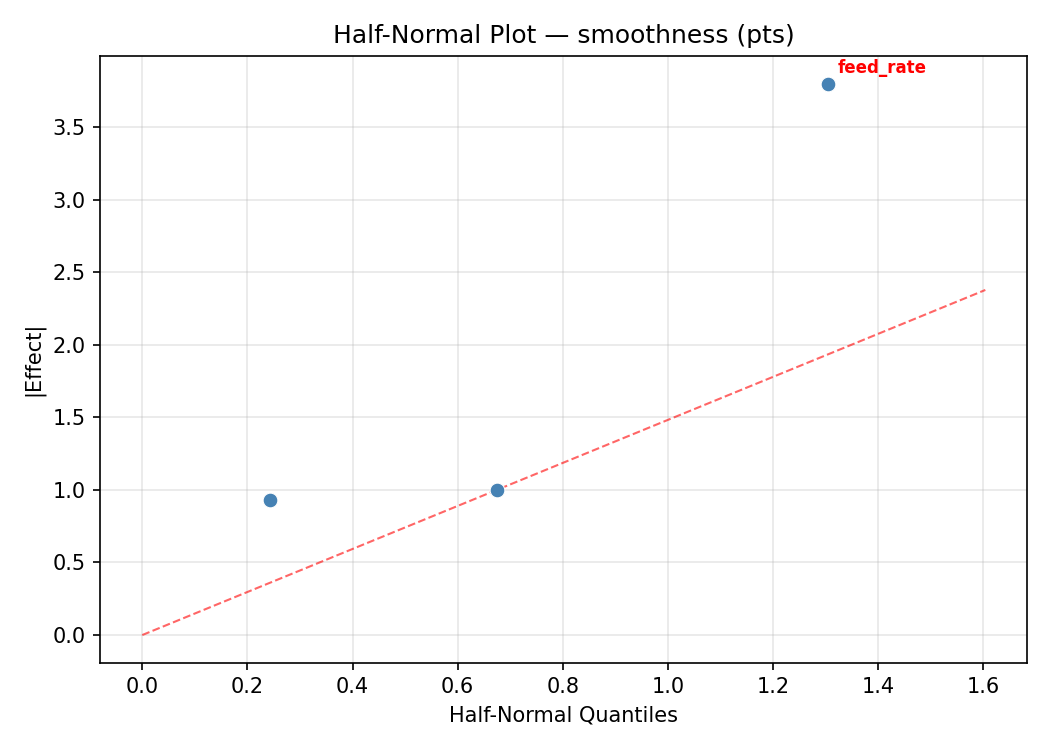
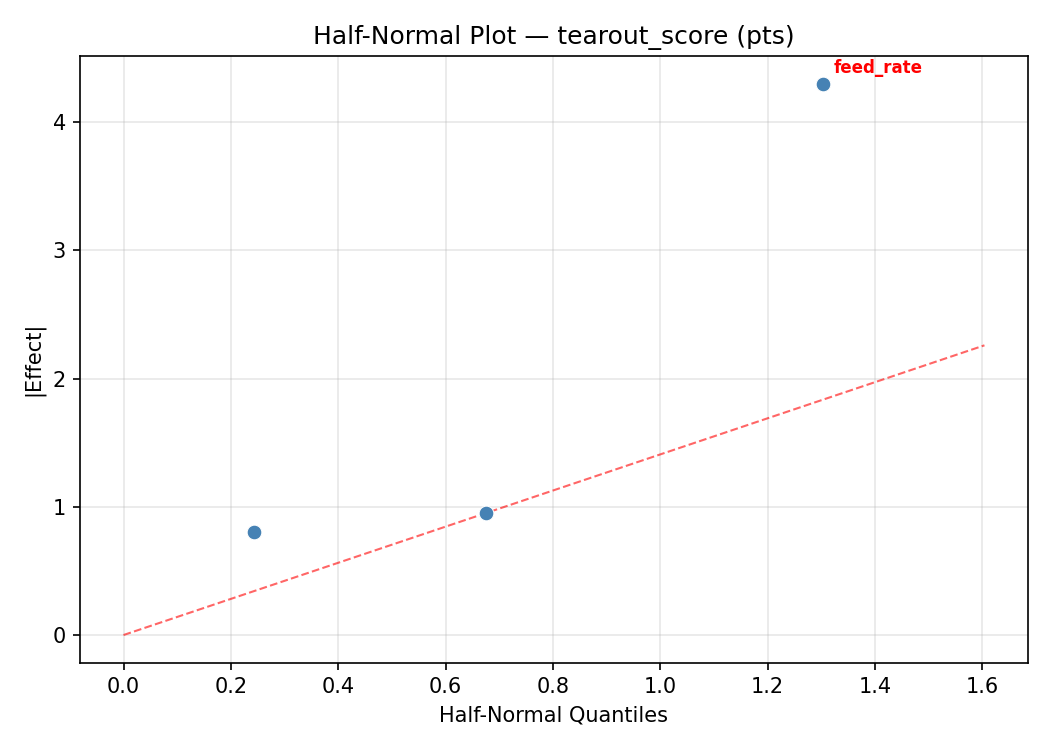
Half-Normal Plot of Effects
Model Diagnostics
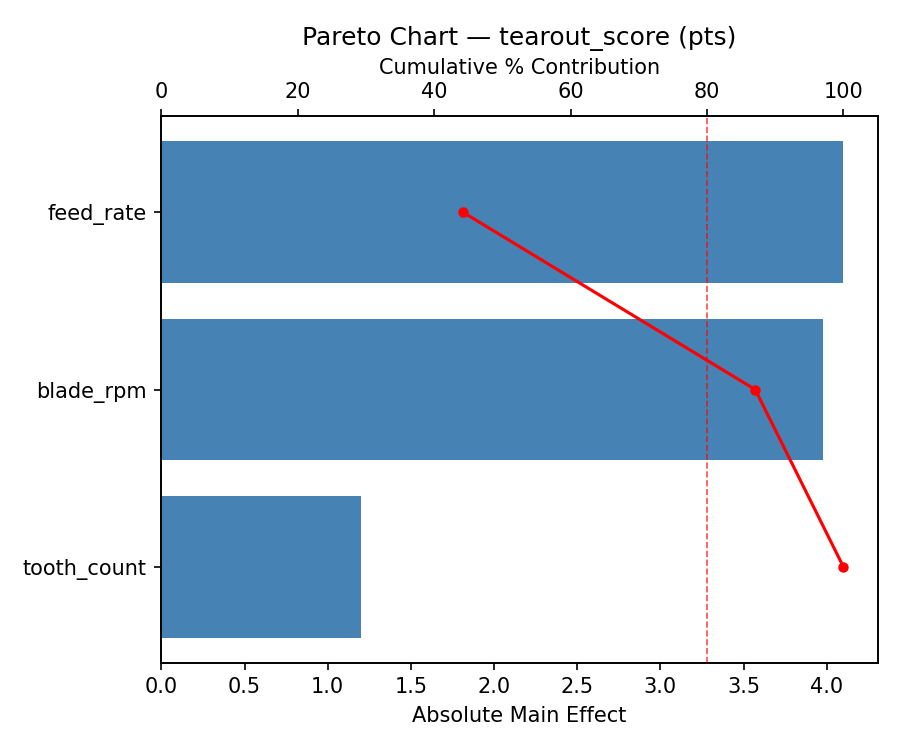
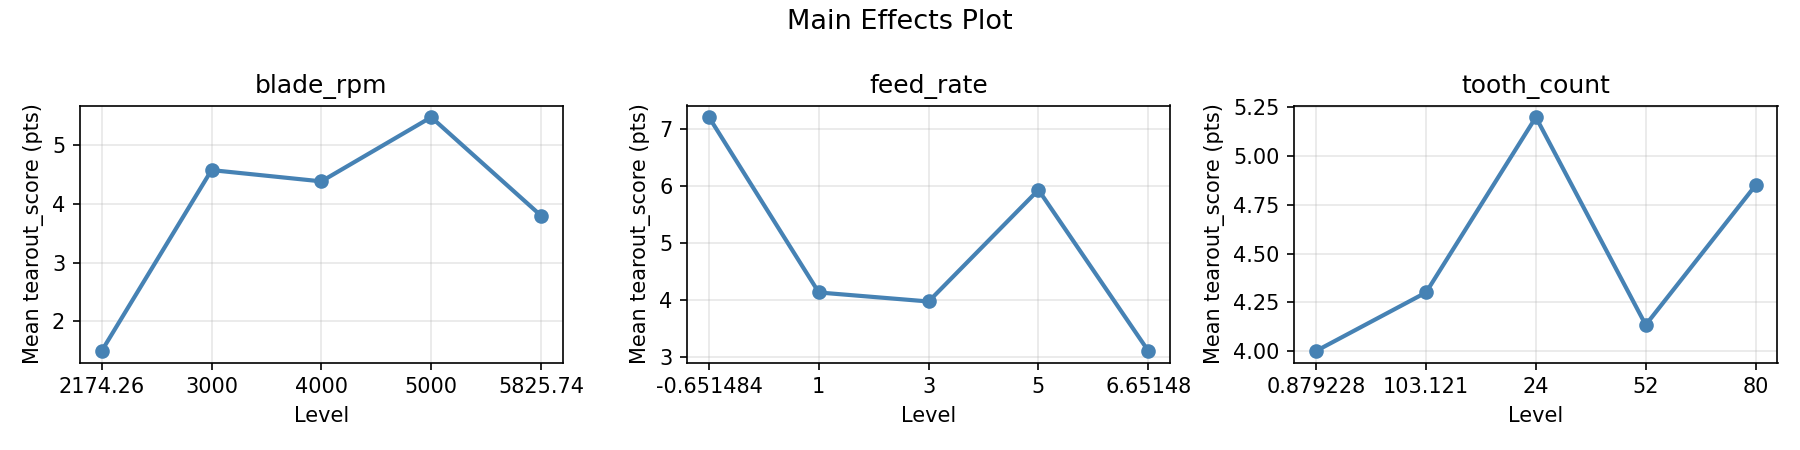
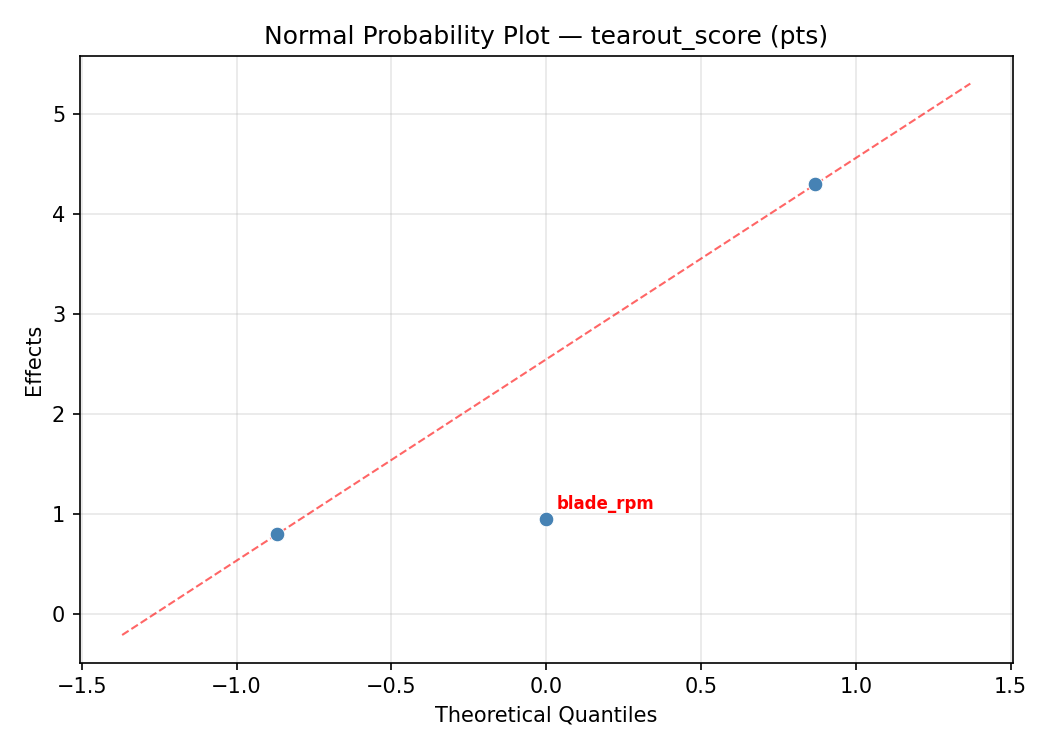
Response: tearout_score
Top factors: blade_rpm (40.0%), feed_rate (39.7%), tooth_count (20.4%).
ANOVA
| Source | DF | SS | MS | F | p-value |
|---|
| Source | DF | SS | MS | F | p-value |
| blade_rpm | 4 | 11.3390 | 2.8348 | 0.957 | 0.4756 |
| feed_rate | 4 | 7.1065 | 1.7766 | 0.600 | 0.6724 |
| tooth_count | 4 | 2.1065 | 0.5266 | 0.178 | 0.9442 |
| Lack | of | Fit | 2 | 2.8611 | 1.4306 |
| Pure | Error | 7 | 20.7400 | | |
| Error | 9 | 23.6011 | 2.9629 | | |
| Total | 21 | 44.1532 | 2.1025 | | |
Pareto Chart
Main Effects Plot
Normal Probability Plot of Effects
Half-Normal Plot of Effects
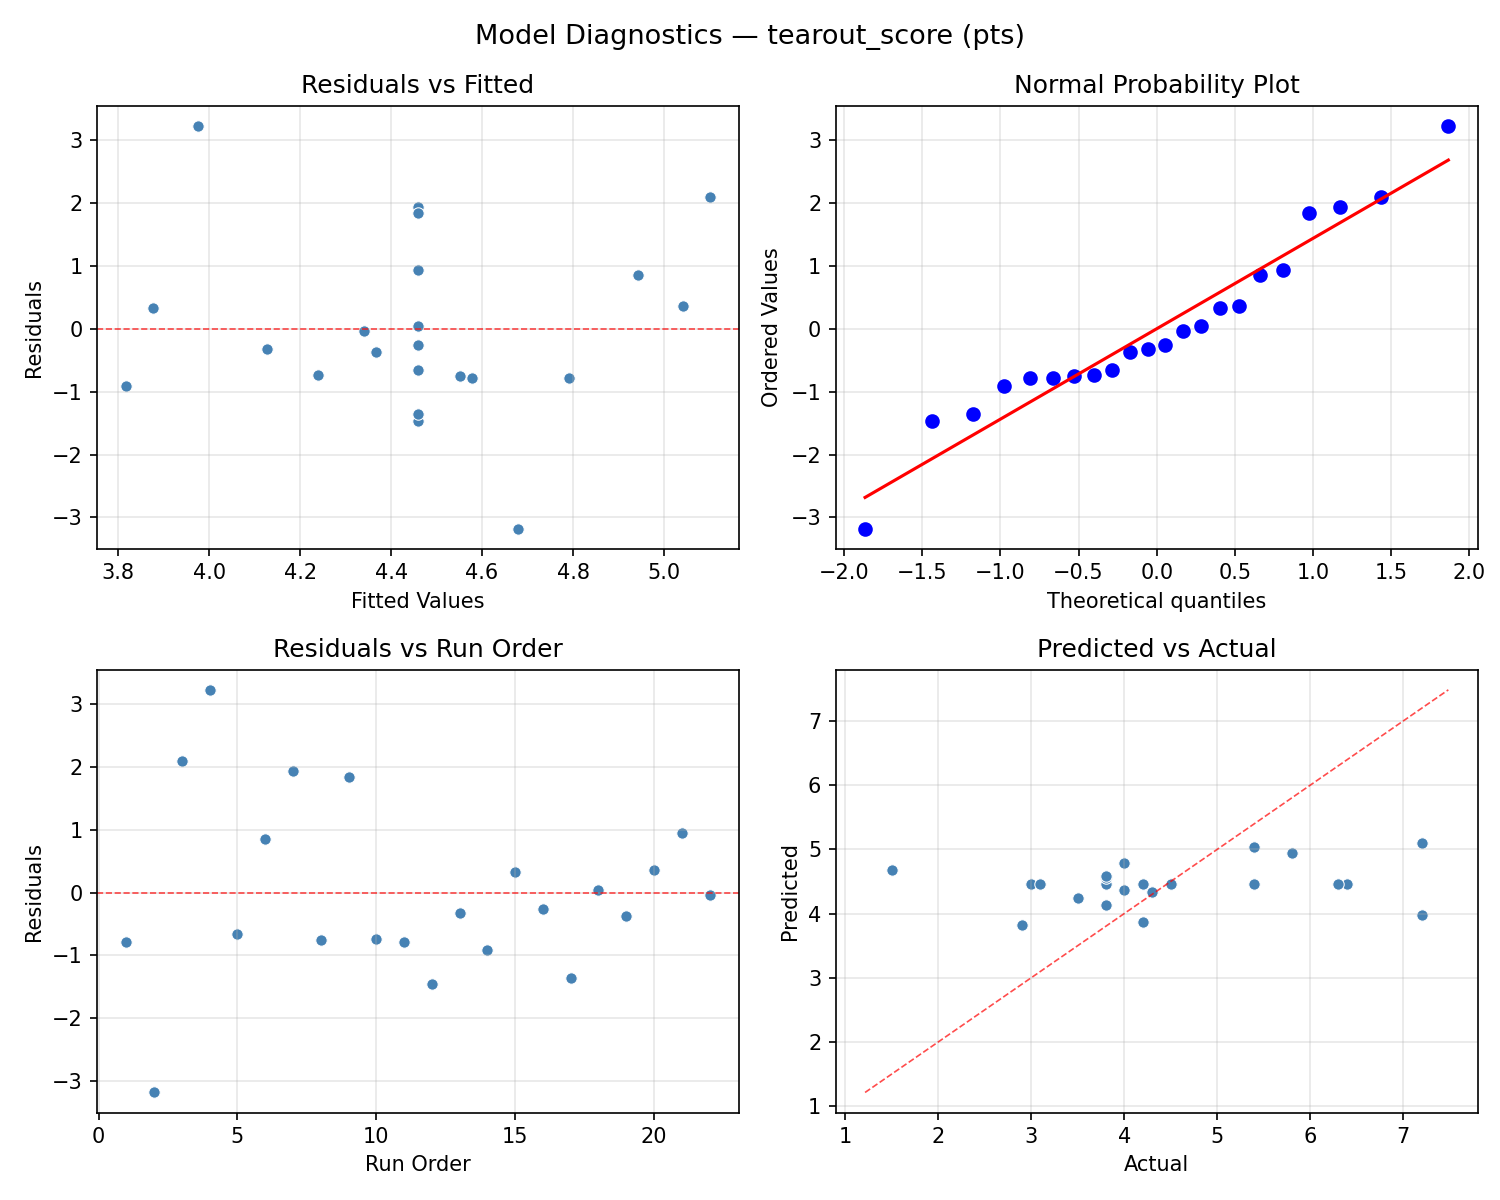
Model Diagnostics
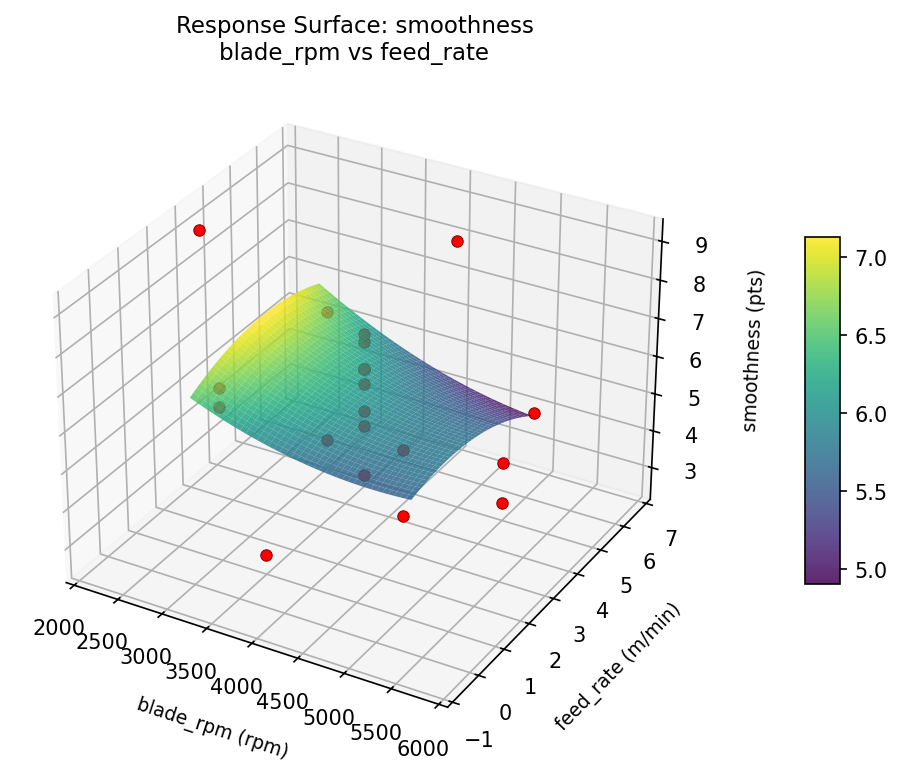
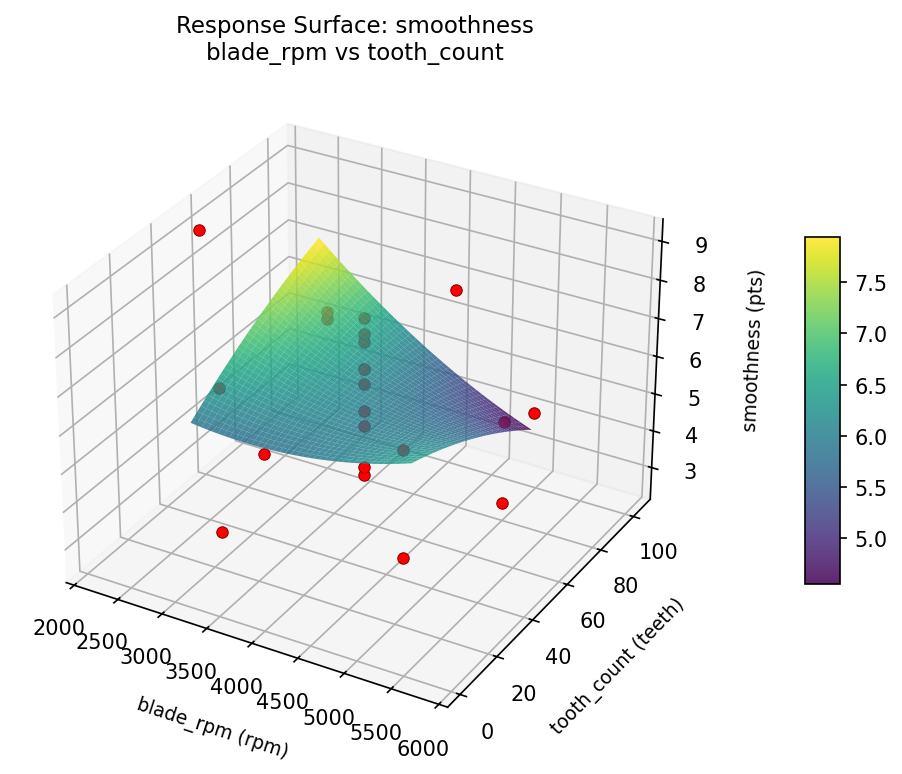
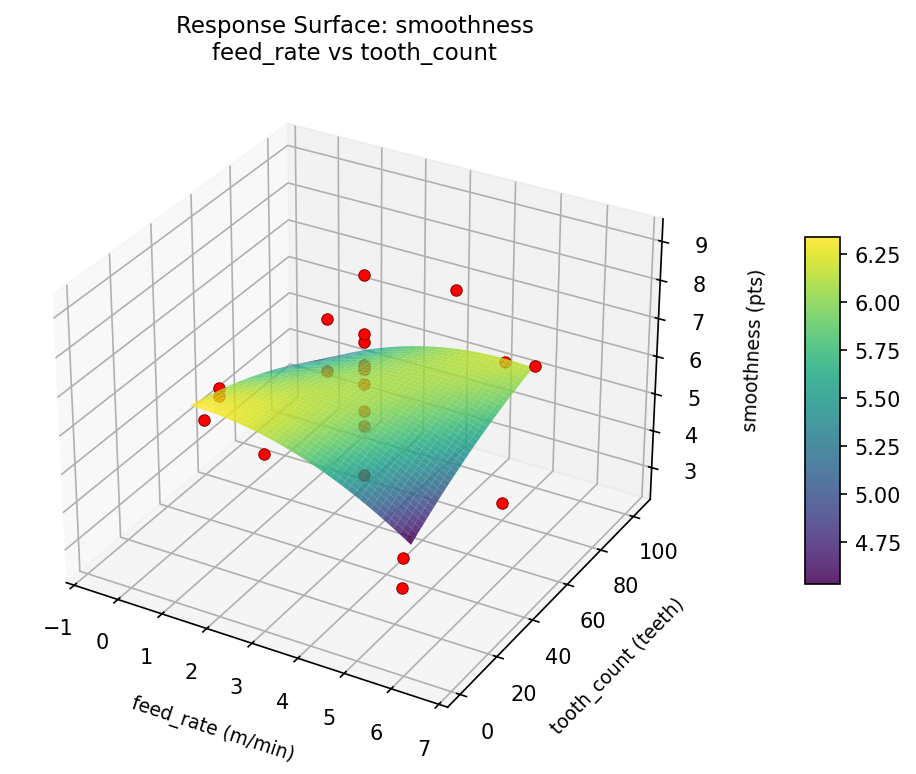
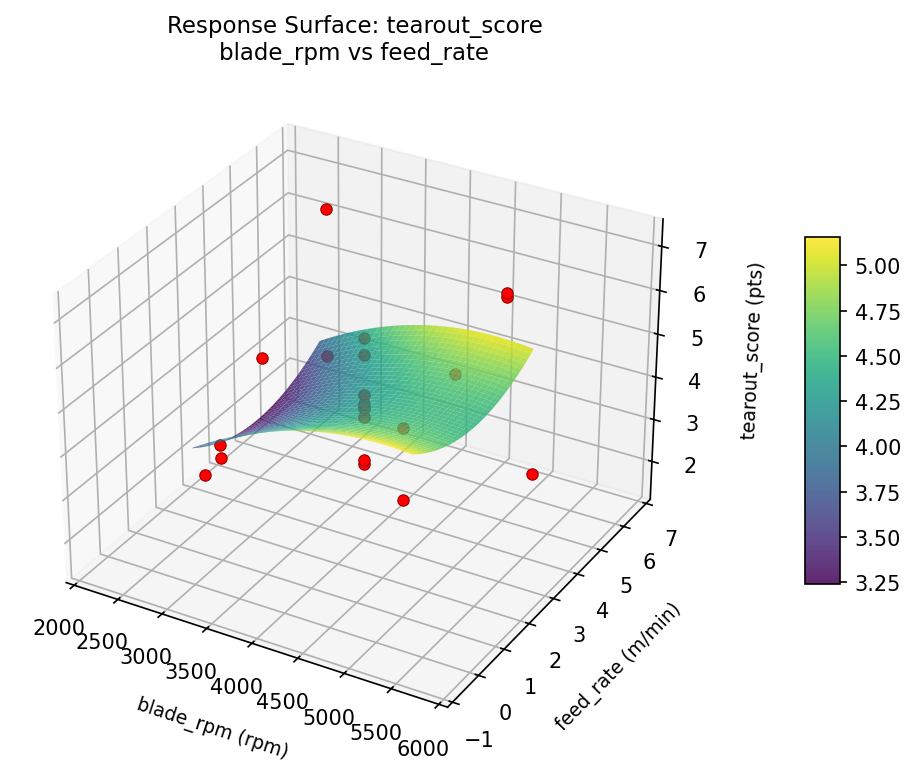
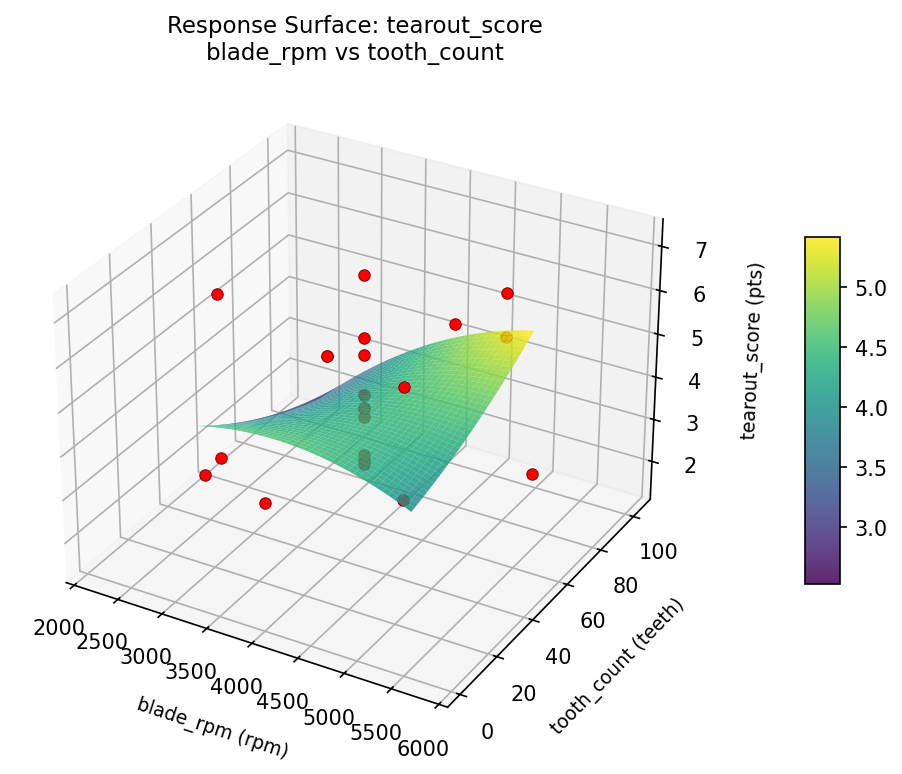
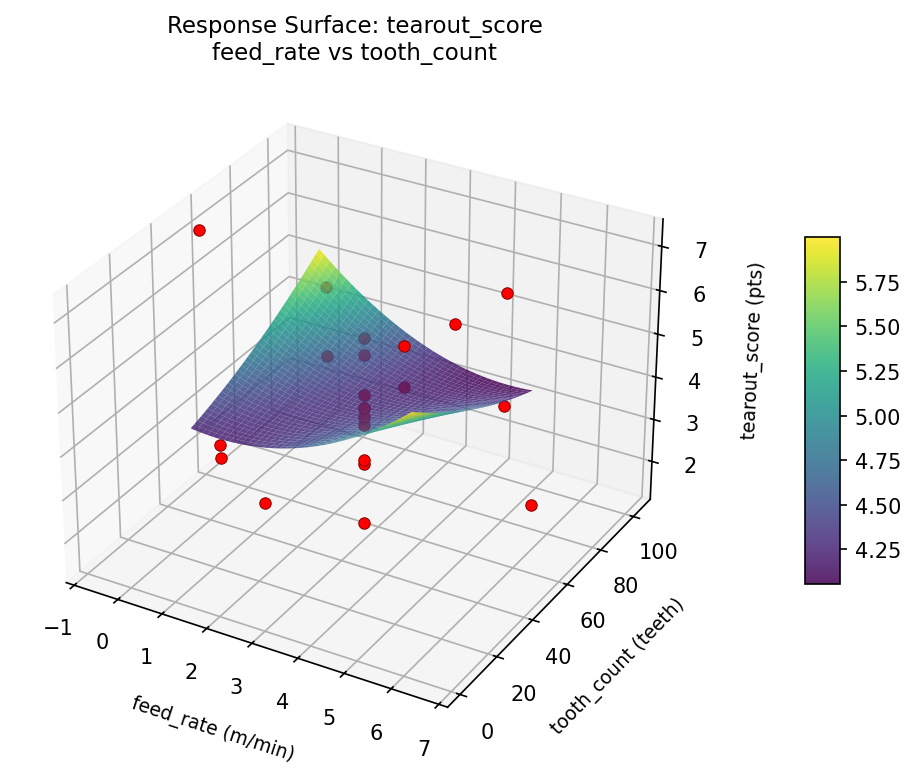
Response Surface Plots
3D surfaces fitted with quadratic RSM. Red dots are observed data points.
smoothness blade rpm vs feed rate
smoothness blade rpm vs tooth count
smoothness feed rate vs tooth count
tearout score blade rpm vs feed rate
tearout score blade rpm vs tooth count
tearout score feed rate vs tooth count
Multi-Objective Optimization
When responses compete, Derringer–Suich desirability finds the best compromise.
Each response is scaled to a 0–1 desirability, then combined via a weighted geometric mean.
Overall Desirability
D = 0.9545
Per-Response Desirability
| Response | Weight | Desirability | Predicted | Dir |
|---|
smoothness |
1.0 |
|
9.10 0.9545 9.10 pts |
↑ |
tearout_score |
1.5 |
|
1.50 0.9545 1.50 pts |
↓ |
Recommended Settings
| Factor | Value |
|---|
blade_rpm | 4000 rpm |
feed_rate | 3 m/min |
tooth_count | 52 teeth |
Source: from observed run #2
Trade-off Summary
Sacrifice = how much worse than single-objective best.
| Response | Predicted | Best Observed | Sacrifice |
|---|
tearout_score | 1.50 | 1.50 | +0.00 |
Top 3 Runs by Desirability
| Run | D | Factor Settings |
|---|
| #17 | 0.7383 | blade_rpm=5000, feed_rate=1, tooth_count=24 |
| #12 | 0.7269 | blade_rpm=4000, feed_rate=3, tooth_count=52 |
Model Quality
| Response | R² | Type |
|---|
tearout_score | 0.0811 | linear |
Full Multi-Objective Output
============================================================
MULTI-OBJECTIVE OPTIMIZATION
Method: Derringer-Suich Desirability Function
============================================================
Overall desirability: D = 0.9545
Response Weight Desirability Predicted Direction
---------------------------------------------------------------------
smoothness 1.0 0.9545 9.10 pts ↑
tearout_score 1.5 0.9545 1.50 pts ↓
Recommended settings:
blade_rpm = 4000 rpm
feed_rate = 3 m/min
tooth_count = 52 teeth
(from observed run #2)
Trade-off summary:
smoothness: 9.10 (best observed: 9.10, sacrifice: +0.00)
tearout_score: 1.50 (best observed: 1.50, sacrifice: +0.00)
Model quality:
smoothness: R² = 0.4304 (quadratic)
tearout_score: R² = 0.0811 (linear)
Top 3 observed runs by overall desirability:
1. Run #2 (D=0.9545): blade_rpm=4000, feed_rate=3, tooth_count=52
2. Run #17 (D=0.7383): blade_rpm=5000, feed_rate=1, tooth_count=24
3. Run #12 (D=0.7269): blade_rpm=4000, feed_rate=3, tooth_count=52
Full Analysis Output
=== Main Effects: smoothness ===
Factor Effect Std Error % Contribution
--------------------------------------------------------------
feed_rate 4.8000 0.3555 51.1%
blade_rpm 2.7000 0.3555 28.7%
tooth_count 1.9000 0.3555 20.2%
=== ANOVA Table: smoothness ===
Source DF SS MS F p-value
-----------------------------------------------------------------------------
blade_rpm 4 16.7909 4.1977 1.892 0.1961
feed_rate 4 19.6459 4.9115 2.214 0.1481
tooth_count 4 5.0484 1.2621 0.569 0.6919
Lack of Fit 2 1.3769 0.6885 0.310 0.7428
Pure Error 7 15.5287 2.2184
Error 9 16.9057 2.2184
Total 21 58.3909 2.7805
=== Summary Statistics: smoothness ===
blade_rpm:
Level N Mean Std Min Max
------------------------------------------------------------
2174.26 1 5.6000 0.0000 5.6000 5.6000
3000 4 4.2000 1.4652 2.9000 6.3000
4000 12 6.2000 1.7451 2.6000 9.1000
5000 4 6.9000 0.7439 6.4000 8.0000
5825.74 1 6.2000 0.0000 6.2000 6.2000
feed_rate:
Level N Mean Std Min Max
------------------------------------------------------------
-0.651484 1 2.6000 0.0000 2.6000 2.6000
1 4 4.9250 1.8081 2.9000 6.5000
3 12 6.3500 1.3208 4.1000 9.1000
5 4 6.1750 1.8025 3.7000 8.0000
6.65148 1 7.4000 0.0000 7.4000 7.4000
tooth_count:
Level N Mean Std Min Max
------------------------------------------------------------
0.879228 1 4.8000 0.0000 4.8000 4.8000
103.121 1 6.7000 0.0000 6.7000 6.7000
24 4 5.2000 1.6207 3.7000 6.7000
52 12 6.2250 1.6961 2.6000 9.1000
80 4 5.9000 2.1463 2.9000 8.0000
=== Main Effects: tearout_score ===
Factor Effect Std Error % Contribution
--------------------------------------------------------------
blade_rpm 2.2750 0.3091 40.0%
feed_rate 2.2583 0.3091 39.7%
tooth_count 1.1583 0.3091 20.4%
=== ANOVA Table: tearout_score ===
Source DF SS MS F p-value
-----------------------------------------------------------------------------
blade_rpm 4 11.3390 2.8348 0.957 0.4756
feed_rate 4 7.1065 1.7766 0.600 0.6724
tooth_count 4 2.1065 0.5266 0.178 0.9442
Lack of Fit 2 2.8611 1.4306 0.483 0.6362
Pure Error 7 20.7400 2.9629
Error 9 23.6011 2.9629
Total 21 44.1532 2.1025
=== Summary Statistics: tearout_score ===
blade_rpm:
Level N Mean Std Min Max
------------------------------------------------------------
2174.26 1 4.2000 0.0000 4.2000 4.2000
3000 4 5.8250 1.3475 4.0000 7.2000
4000 12 4.3833 1.5678 1.5000 7.2000
5000 4 3.5500 0.3317 3.1000 3.8000
5825.74 1 3.8000 0.0000 3.8000 3.8000
feed_rate:
Level N Mean Std Min Max
------------------------------------------------------------
-0.651484 1 6.4000 0.0000 6.4000 6.4000
1 4 5.1500 1.6603 3.8000 7.2000
3 12 4.1417 1.4343 1.5000 7.2000
5 4 4.2250 1.4315 3.1000 6.3000
6.65148 1 4.5000 0.0000 4.5000 4.5000
tooth_count:
Level N Mean Std Min Max
------------------------------------------------------------
0.879228 1 5.4000 0.0000 5.4000 5.4000
103.121 1 4.3000 0.0000 4.3000 4.3000
24 4 4.8500 1.4059 3.5000 6.3000
52 12 4.2417 1.5412 1.5000 7.2000
80 4 4.5250 1.8246 3.1000 7.2000
Optimization Recommendations
=== Optimization: smoothness ===
Direction: maximize
Best observed run: #2
blade_rpm = 3000
feed_rate = 5
tooth_count = 24
Value: 9.1
RSM Model (linear, R² = 0.1636, Adj R² = 0.0242):
Coefficients:
intercept +5.9364
blade_rpm -0.2022
feed_rate +0.7576
tooth_count +0.1909
RSM Model (quadratic, R² = 0.6070, Adj R² = 0.3123):
Coefficients:
intercept +5.3022
blade_rpm -0.2022
feed_rate +0.7576
tooth_count +0.1909
blade_rpm*feed_rate +0.1500
blade_rpm*tooth_count +0.5000
feed_rate*tooth_count -1.5250
blade_rpm^2 +0.3071
feed_rate^2 +0.3071
tooth_count^2 +0.3371
Curvature analysis:
tooth_count coef=+0.3371 convex (has a minimum)
blade_rpm coef=+0.3071 convex (has a minimum)
feed_rate coef=+0.3071 convex (has a minimum)
Notable interactions:
feed_rate*tooth_count coef=-1.5250 (antagonistic)
blade_rpm*tooth_count coef=+0.5000 (synergistic)
Predicted optimum (from quadratic model, at observed points):
blade_rpm = 3000
feed_rate = 5
tooth_count = 24
Predicted value: 8.8974
Surface optimum (via L-BFGS-B, quadratic model):
blade_rpm = 3000
feed_rate = 5
tooth_count = 24
Predicted value: 8.8974
Model quality: Moderate fit — use predictions directionally, not precisely.
Factor importance:
1. feed_rate (effect: 2.8, contribution: 58.0%)
2. tooth_count (effect: 1.0, contribution: 21.2%)
3. blade_rpm (effect: 1.0, contribution: 20.7%)
=== Optimization: tearout_score ===
Direction: minimize
Best observed run: #2
blade_rpm = 3000
feed_rate = 5
tooth_count = 24
Value: 1.5
RSM Model (linear, R² = 0.1941, Adj R² = 0.0598):
Coefficients:
intercept +4.4591
blade_rpm +0.3439
feed_rate -0.6818
tooth_count -0.0356
RSM Model (quadratic, R² = 0.6370, Adj R² = 0.3647):
Coefficients:
intercept +5.0696
blade_rpm +0.3439
feed_rate -0.6818
tooth_count -0.0356
blade_rpm*feed_rate -0.2500
blade_rpm*tooth_count -0.5000
feed_rate*tooth_count +1.2000
blade_rpm^2 -0.4453
feed_rate^2 -0.1753
tooth_count^2 -0.2953
Curvature analysis:
blade_rpm coef=-0.4453 concave (has a maximum)
tooth_count coef=-0.2953 concave (has a maximum)
feed_rate coef=-0.1753 concave (has a maximum)
Notable interactions:
feed_rate*tooth_count coef=+1.2000 (synergistic)
blade_rpm*tooth_count coef=-0.5000 (antagonistic)
Predicted optimum (from quadratic model, at observed points):
blade_rpm = 5000
feed_rate = 1
tooth_count = 24
Predicted value: 7.1650
Surface optimum (via L-BFGS-B, quadratic model):
blade_rpm = 3000
feed_rate = 5
tooth_count = 24
Predicted value: 1.7138
Model quality: Moderate fit — use predictions directionally, not precisely.
Factor importance:
1. feed_rate (effect: 2.3, contribution: 43.3%)
2. blade_rpm (effect: 1.9, contribution: 35.3%)
3. tooth_count (effect: 1.1, contribution: 21.4%)