Summary
This experiment investigates plywood layup optimization. Full factorial of veneer thickness, glue weight, press temperature, and press time to maximize bending strength and minimize delamination.
The design varies 4 factors: veneer mm (mm), ranging from 1.0 to 3.0, glue g m2 (g/m2), ranging from 120 to 220, press temp c (C), ranging from 100 to 150, and press min (min), ranging from 3 to 10. The goal is to optimize 2 responses: bend strength mpa (MPa) (maximize) and delam score (pts) (minimize). Fixed conditions held constant across all runs include species = birch, layers = 5.
A full factorial design was used to explore all 16 possible combinations of the 4 factors at two levels. This guarantees that every main effect and interaction can be estimated independently, at the cost of a larger experiment (16 runs).
Quadratic response surface models were fitted to capture potential curvature and factor interactions. The RSM contour plots below visualize how pairs of factors jointly affect each response.
Key Findings
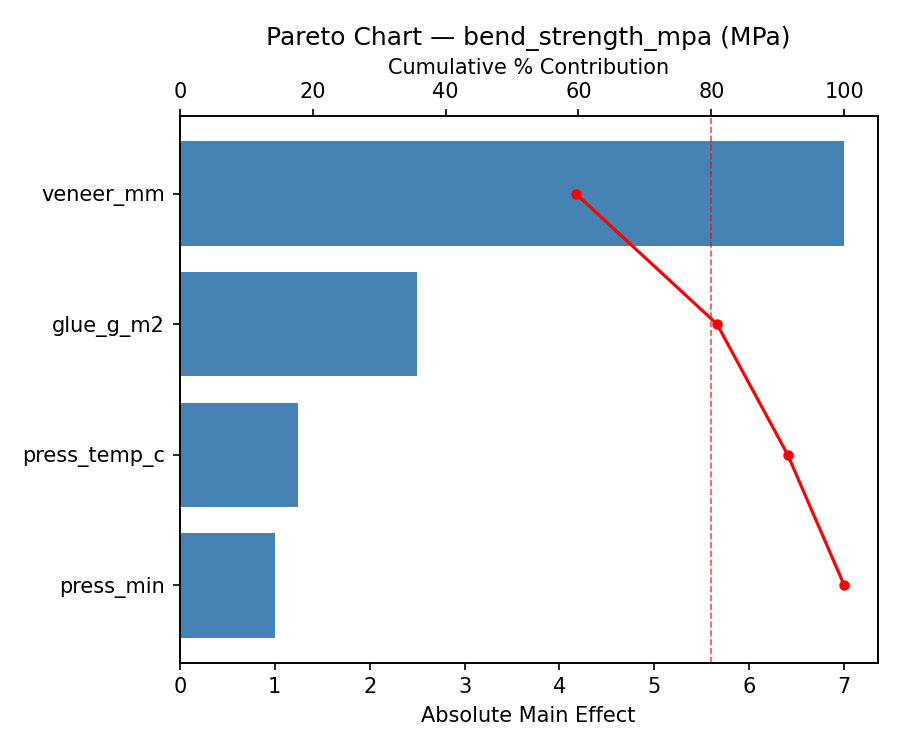
For bend strength mpa, the most influential factors were glue g m2 (48.2%), veneer mm (31.8%), press min (11.8%). The best observed value was 75.0 (at veneer mm = 3.0, glue g m2 = 120, press temp c = 100).
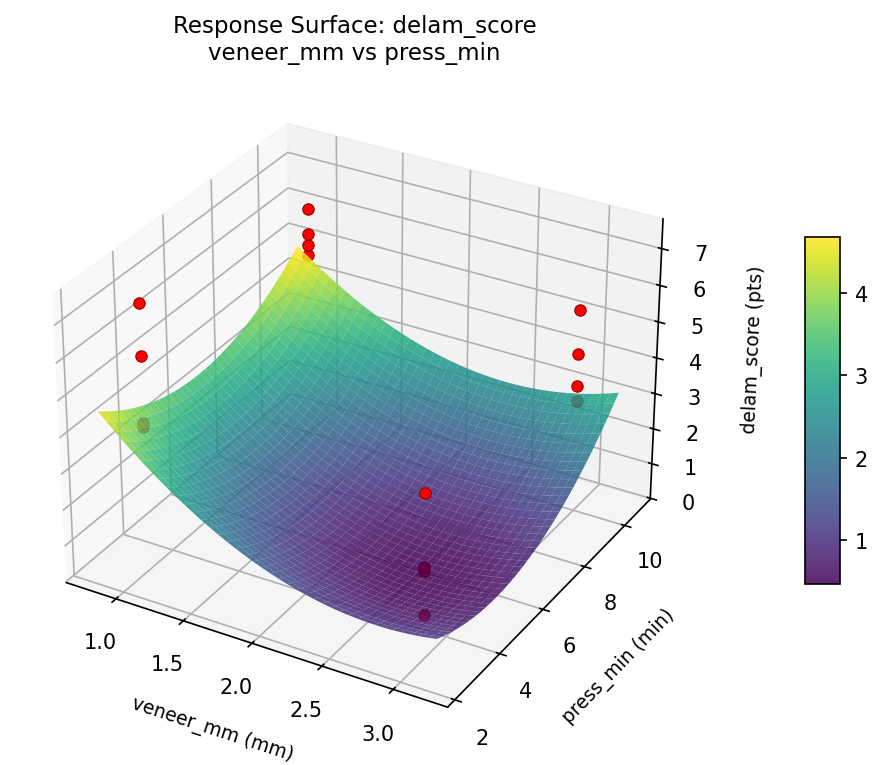
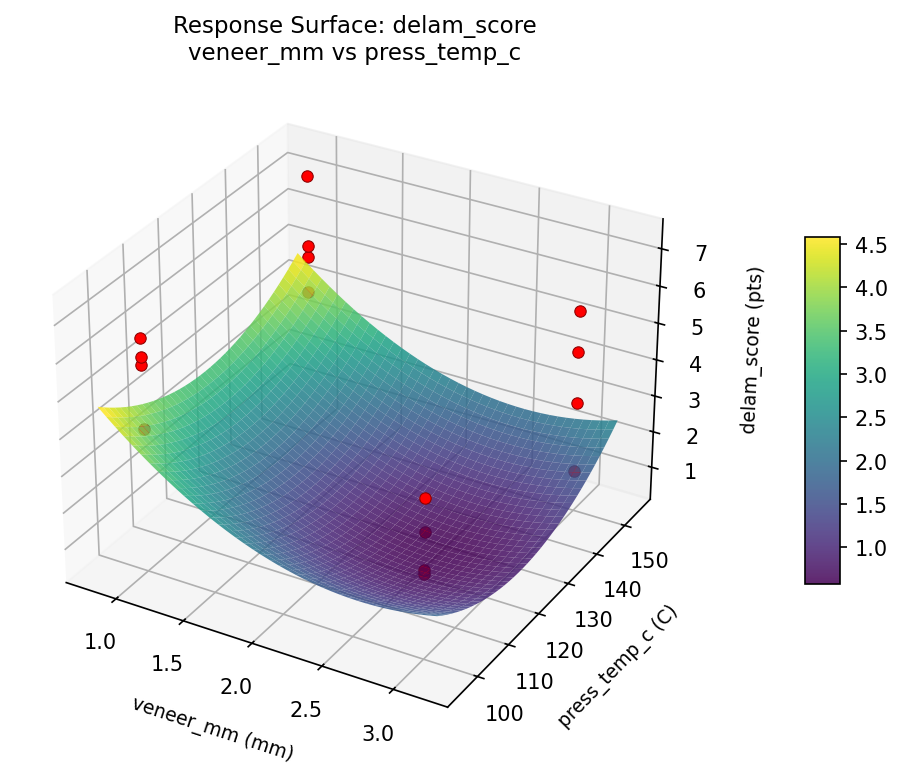
For delam score, the most influential factors were veneer mm (33.8%), glue g m2 (32.2%), press min (22.4%). The best observed value was 1.2 (at veneer mm = 3.0, glue g m2 = 120, press temp c = 100).
Recommended Next Steps
- Consider whether any fixed factors should be varied in a future study.
Experimental Setup
Factors
| Factor | Low | High | Unit |
|---|
veneer_mm | 1.0 | 3.0 | mm |
glue_g_m2 | 120 | 220 | g/m2 |
press_temp_c | 100 | 150 | C |
press_min | 3 | 10 | min |
Fixed: species = birch, layers = 5
Responses
| Response | Direction | Unit |
|---|
bend_strength_mpa | ↑ maximize | MPa |
delam_score | ↓ minimize | pts |
Configuration
{
"metadata": {
"name": "Plywood Layup Optimization",
"description": "Full factorial of veneer thickness, glue weight, press temperature, and press time to maximize bending strength and minimize delamination"
},
"factors": [
{
"name": "veneer_mm",
"levels": [
"1.0",
"3.0"
],
"type": "continuous",
"unit": "mm"
},
{
"name": "glue_g_m2",
"levels": [
"120",
"220"
],
"type": "continuous",
"unit": "g/m2"
},
{
"name": "press_temp_c",
"levels": [
"100",
"150"
],
"type": "continuous",
"unit": "C"
},
{
"name": "press_min",
"levels": [
"3",
"10"
],
"type": "continuous",
"unit": "min"
}
],
"fixed_factors": {
"species": "birch",
"layers": "5"
},
"responses": [
{
"name": "bend_strength_mpa",
"optimize": "maximize",
"unit": "MPa"
},
{
"name": "delam_score",
"optimize": "minimize",
"unit": "pts"
}
],
"settings": {
"operation": "full_factorial",
"test_script": "use_cases/208_plywood_layup/sim.sh"
}
}
Experimental Matrix
The Full Factorial Design produces 16 runs. Each row is one experiment with specific factor settings.
| Run | veneer_mm | glue_g_m2 | press_temp_c | press_min |
|---|
| 1 | 1.0 | 220 | 150 | 10 |
| 2 | 3.0 | 120 | 100 | 10 |
| 3 | 1.0 | 220 | 100 | 10 |
| 4 | 1.0 | 220 | 150 | 3 |
| 5 | 3.0 | 220 | 150 | 3 |
| 6 | 3.0 | 120 | 150 | 3 |
| 7 | 3.0 | 220 | 100 | 3 |
| 8 | 3.0 | 120 | 100 | 3 |
| 9 | 1.0 | 120 | 100 | 10 |
| 10 | 1.0 | 120 | 150 | 3 |
| 11 | 3.0 | 220 | 100 | 10 |
| 12 | 3.0 | 220 | 150 | 10 |
| 13 | 1.0 | 220 | 100 | 3 |
| 14 | 3.0 | 120 | 150 | 10 |
| 15 | 1.0 | 120 | 100 | 3 |
| 16 | 1.0 | 120 | 150 | 10 |
Step-by-Step Workflow
1
Preview the design
$ doe info --config use_cases/208_plywood_layup/config.json
2
Generate the runner script
$ doe generate --config use_cases/208_plywood_layup/config.json \
--output use_cases/208_plywood_layup/results/run.sh --seed 42
3
Execute the experiments
$ bash use_cases/208_plywood_layup/results/run.sh
4
Analyze results
$ doe analyze --config use_cases/208_plywood_layup/config.json
5
Get optimization recommendations
$ doe optimize --config use_cases/208_plywood_layup/config.json
6
Multi-objective optimization
With 2 competing responses, use --multi to find the best compromise via Derringer–Suich desirability.
$ doe optimize --config use_cases/208_plywood_layup/config.json --multi
7
Generate the HTML report
$ doe report --config use_cases/208_plywood_layup/config.json \
--output use_cases/208_plywood_layup/results/report.html
Features Exercised
| Feature | Value |
|---|
| Design type | full_factorial |
| Factor types | continuous (all 4) |
| Arg style | double-dash |
| Responses | 2 (bend_strength_mpa ↑, delam_score ↓) |
| Total runs | 16 |
Analysis Results
Generated from actual experiment runs using the DOE Helper Tool.
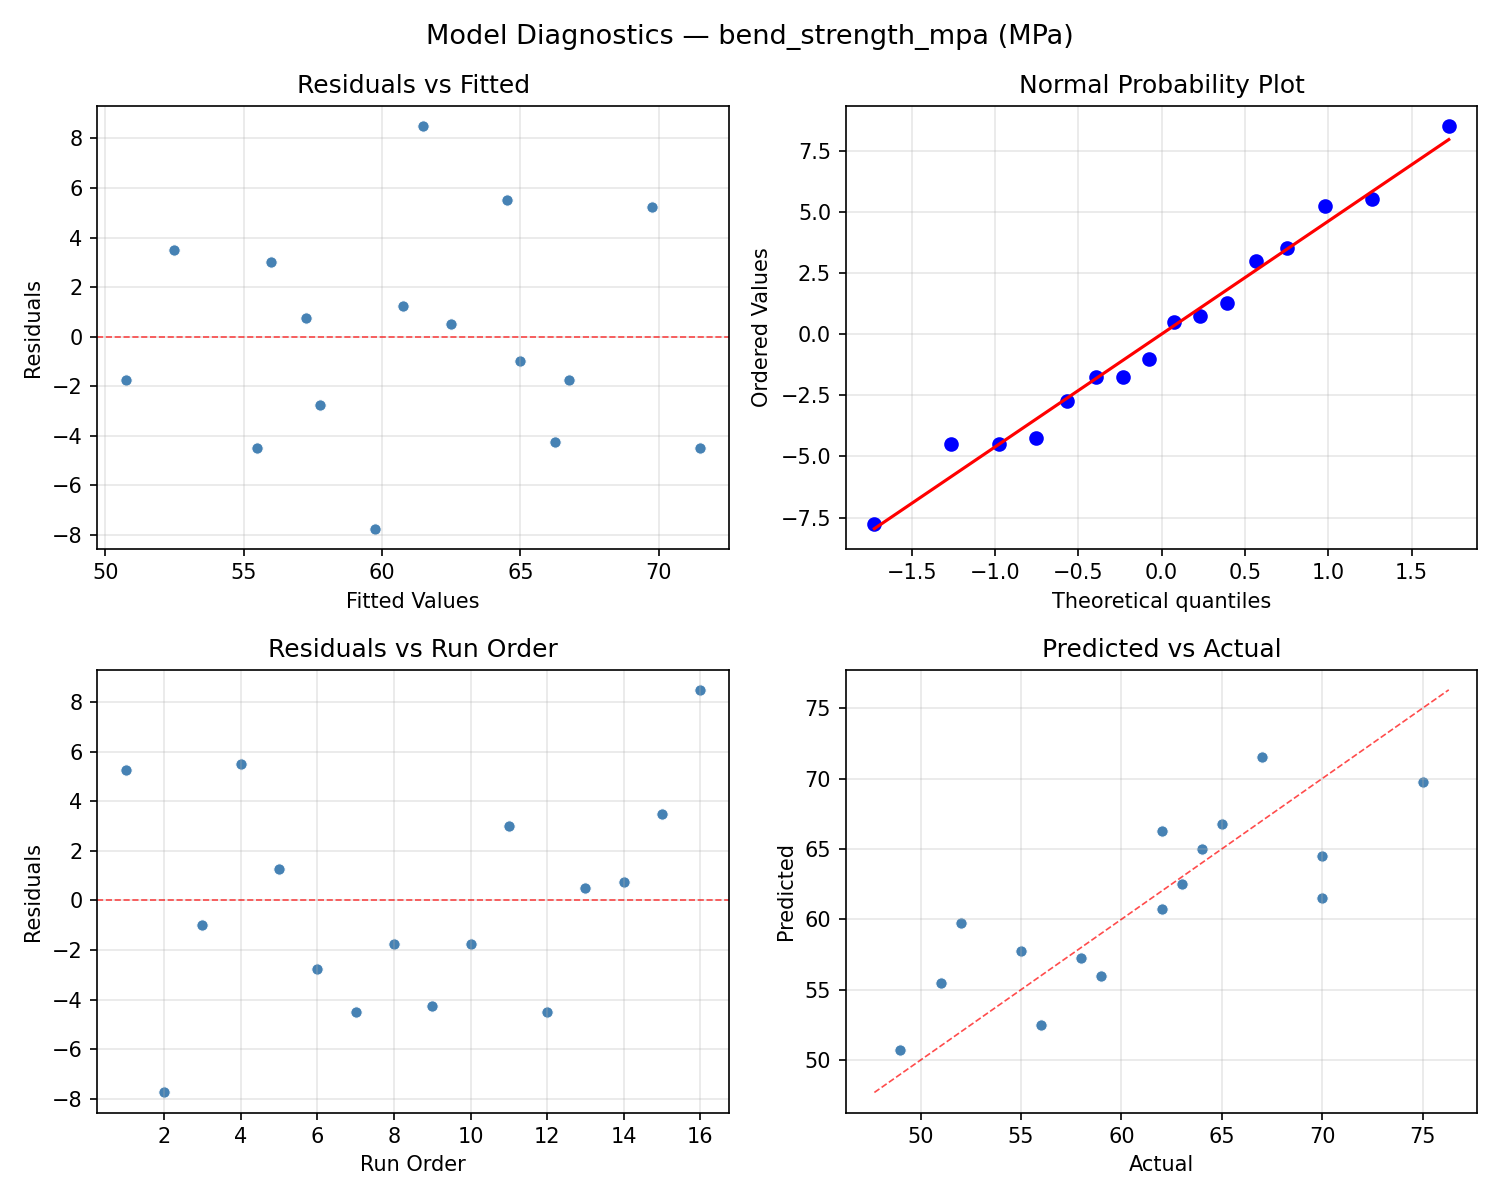
Response: bend_strength_mpa
Top factors: glue_g_m2 (48.2%), veneer_mm (31.8%), press_min (11.8%).
ANOVA
| Source | DF | SS | MS | F | p-value |
|---|
| Source | DF | SS | MS | F | p-value |
| veneer_mm | 1 | 182.2500 | 182.2500 | 8.046 | 0.0364 |
| glue_g_m2 | 1 | 420.2500 | 420.2500 | 18.554 | 0.0077 |
| press_temp_c | 1 | 12.2500 | 12.2500 | 0.541 | 0.4951 |
| press_min | 1 | 25.0000 | 25.0000 | 1.104 | 0.3415 |
| veneer_mm*glue_g_m2 | 1 | 12.2500 | 12.2500 | 0.541 | 0.4951 |
| veneer_mm*press_temp_c | 1 | 2.2500 | 2.2500 | 0.099 | 0.7654 |
| veneer_mm*press_min | 1 | 16.0000 | 16.0000 | 0.706 | 0.4390 |
| glue_g_m2*press_temp_c | 1 | 0.2500 | 0.2500 | 0.011 | 0.9204 |
| glue_g_m2*press_min | 1 | 4.0000 | 4.0000 | 0.177 | 0.6918 |
| press_temp_c*press_min | 1 | 36.0000 | 36.0000 | 1.589 | 0.2630 |
| Error | 5 | 113.2500 | 22.6500 | | |
| Total | 15 | 823.7500 | 54.9167 | | |
Pareto Chart
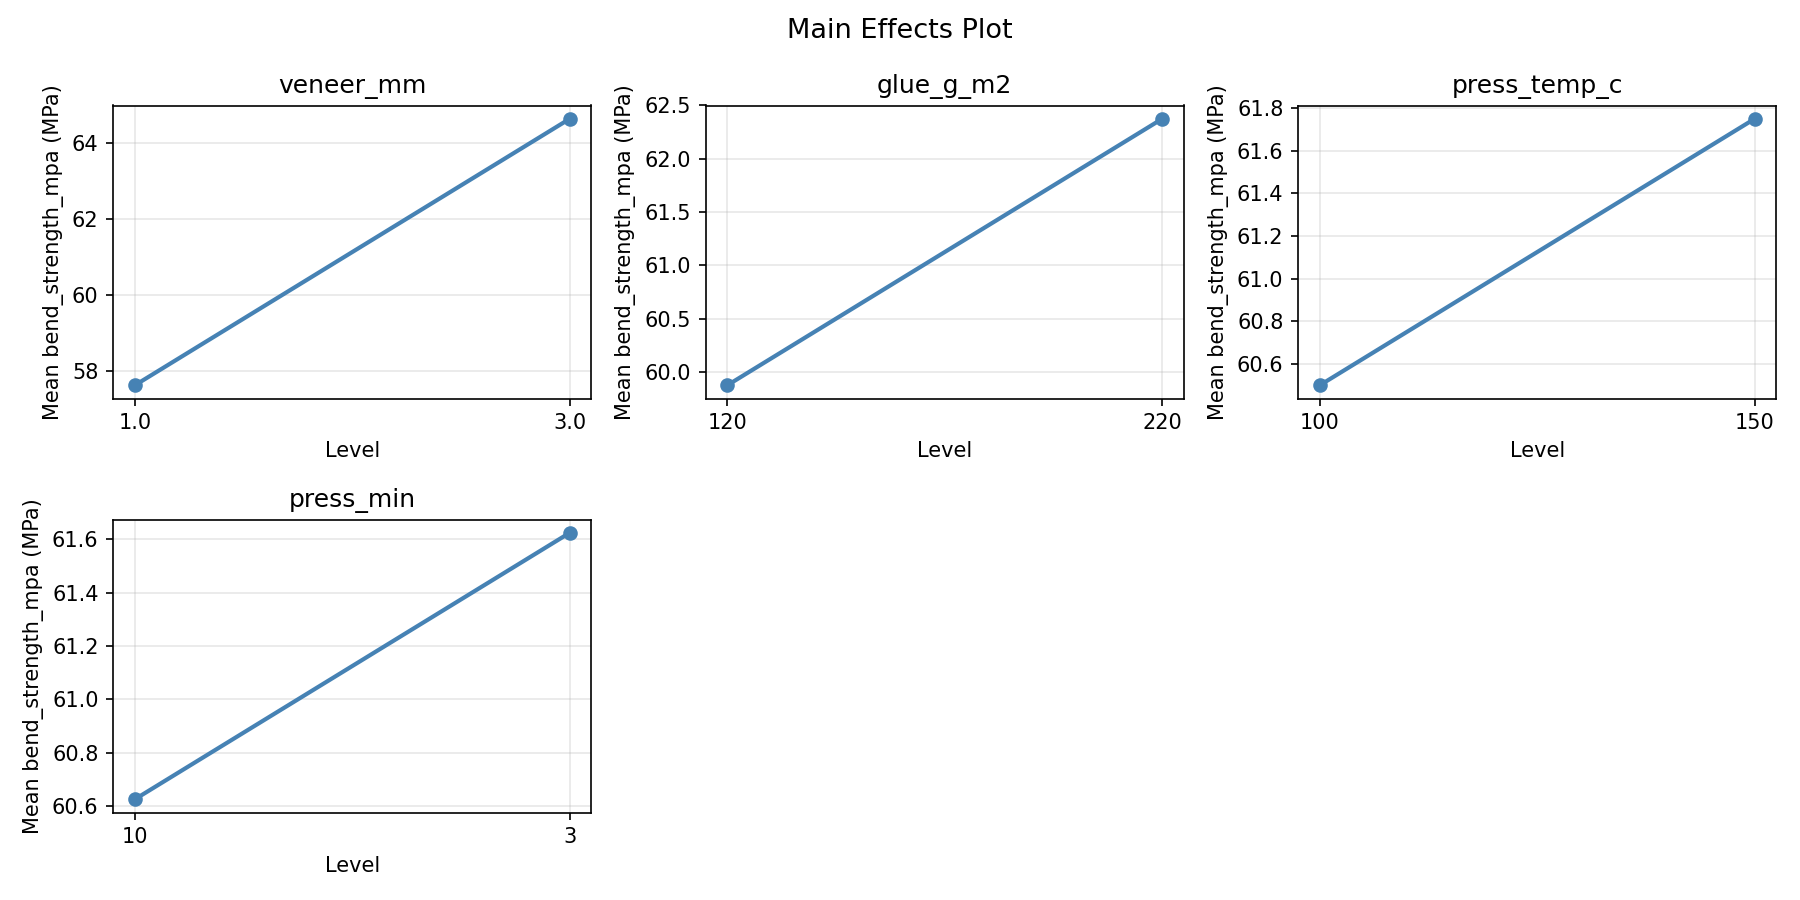
Main Effects Plot
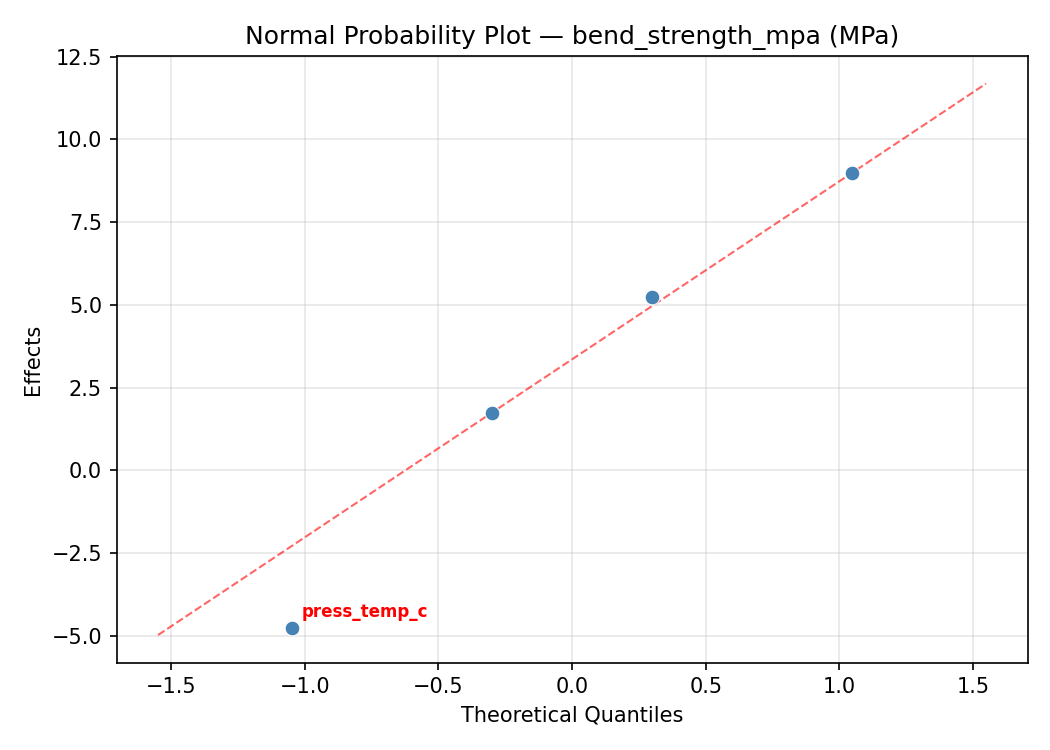
Normal Probability Plot of Effects
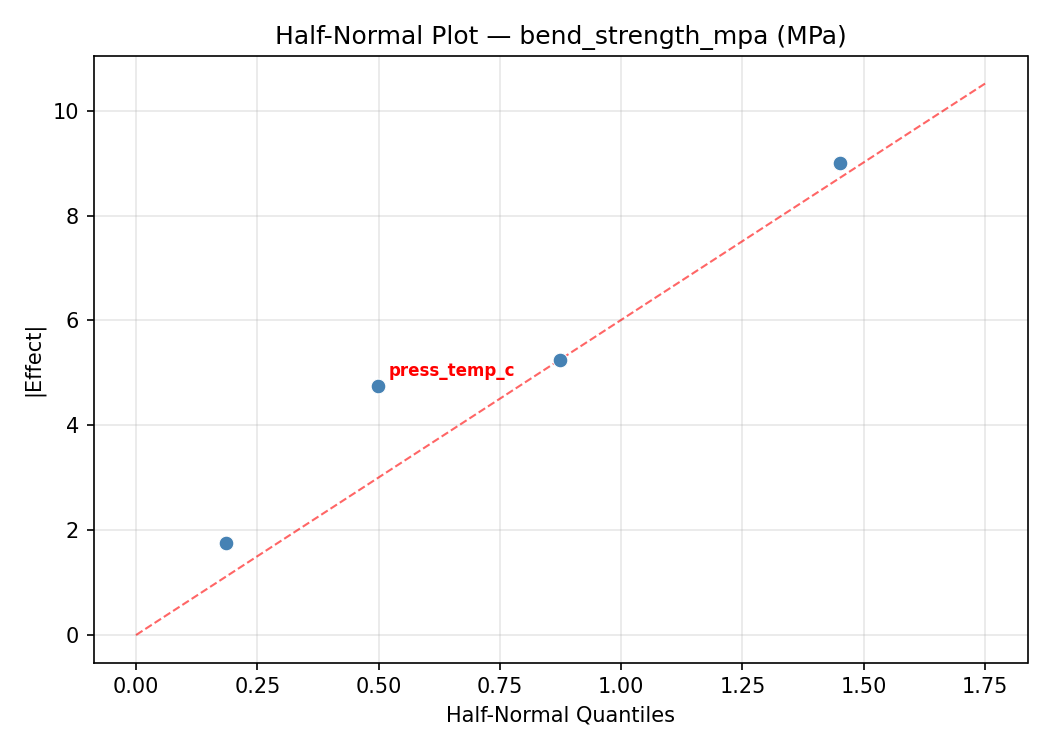
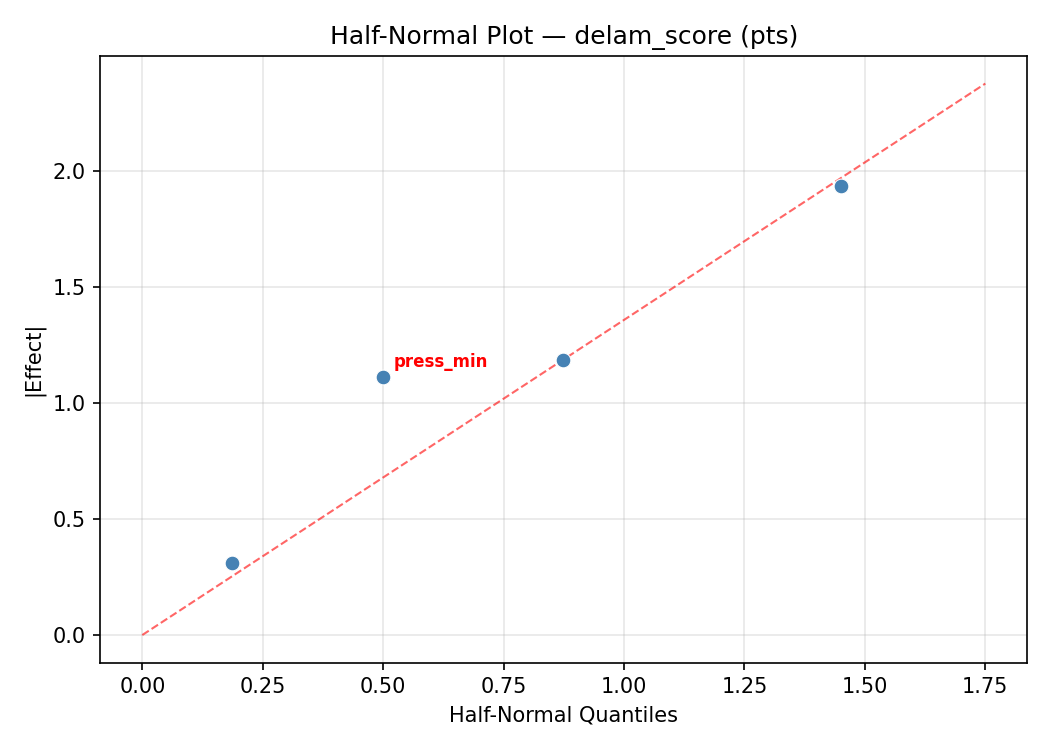
Half-Normal Plot of Effects
Model Diagnostics
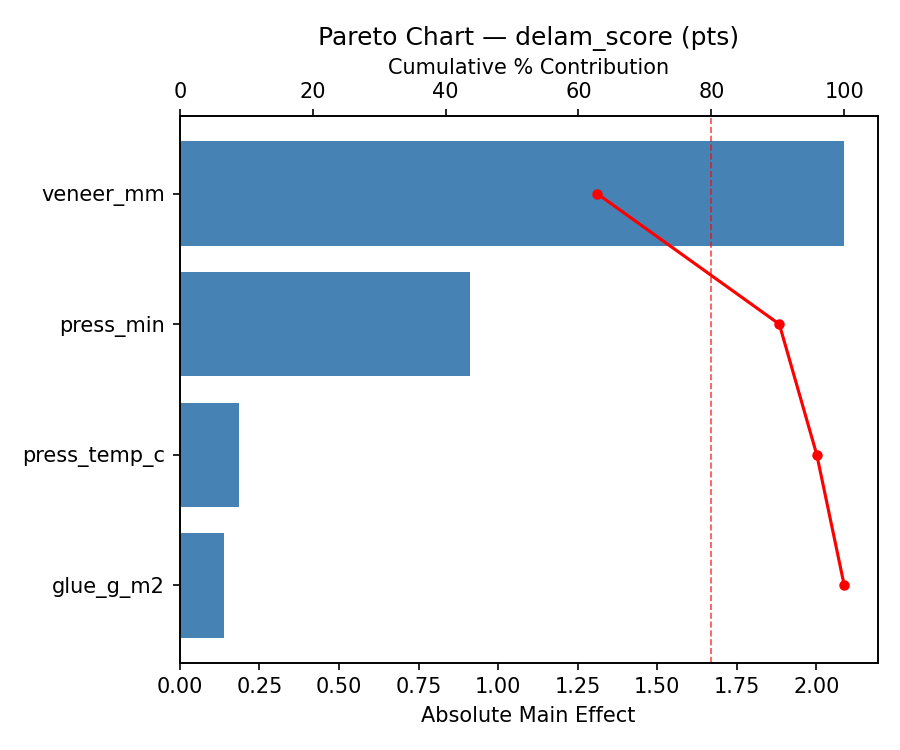
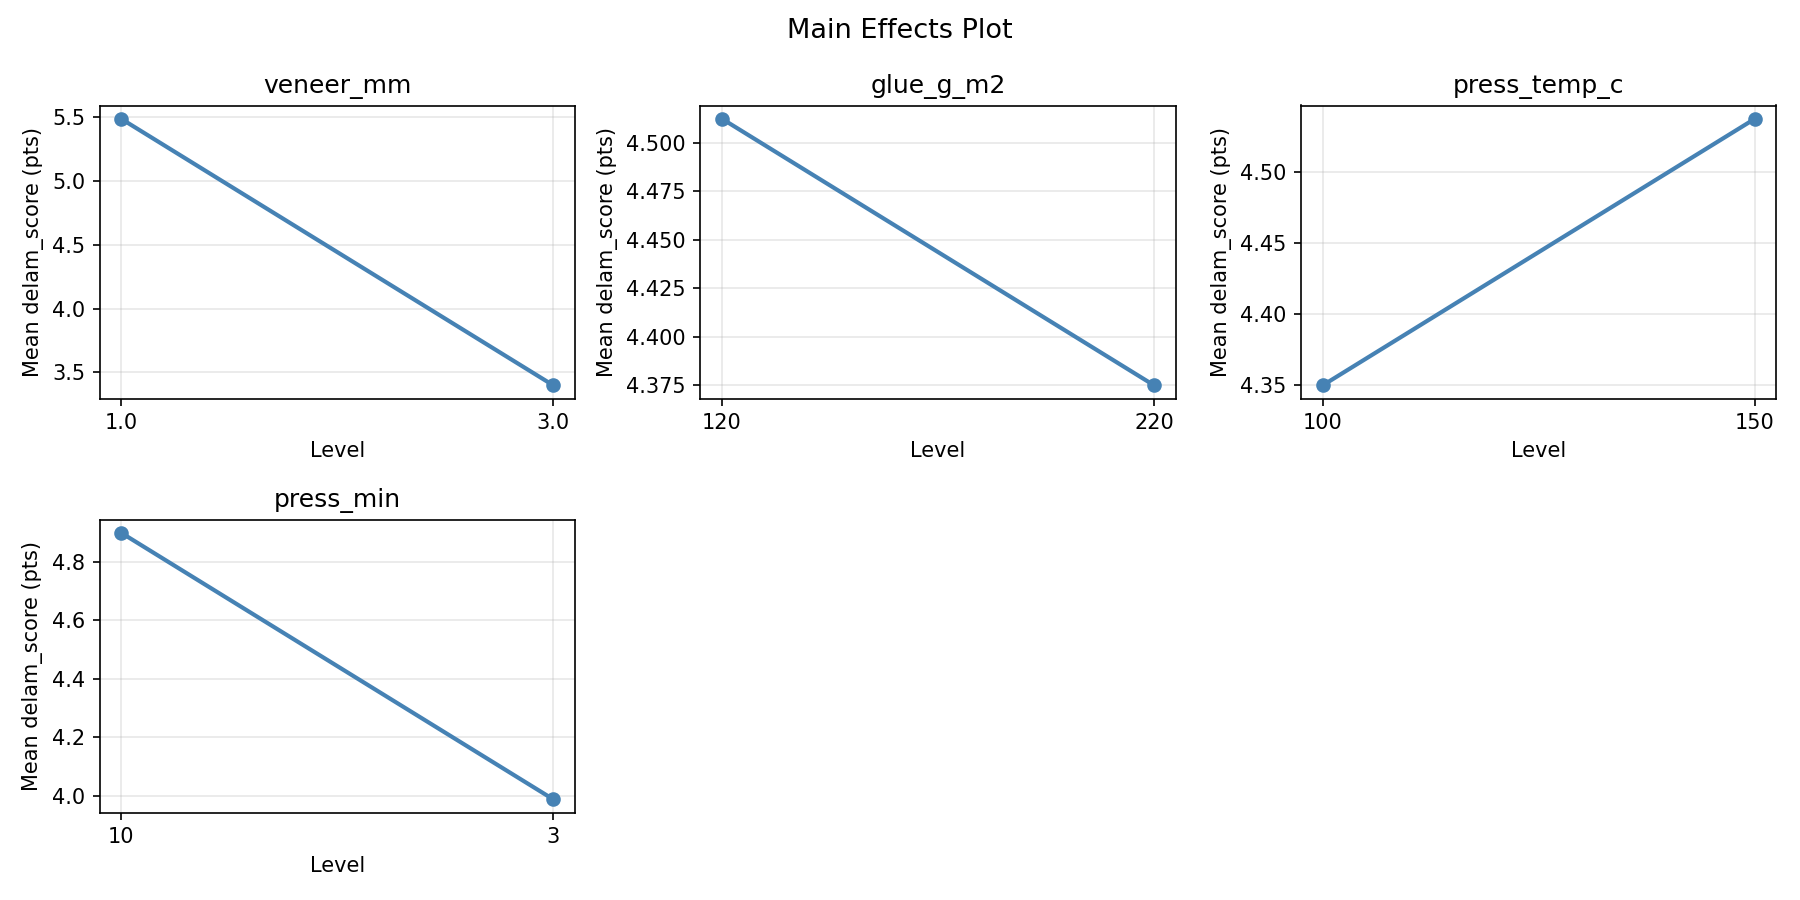
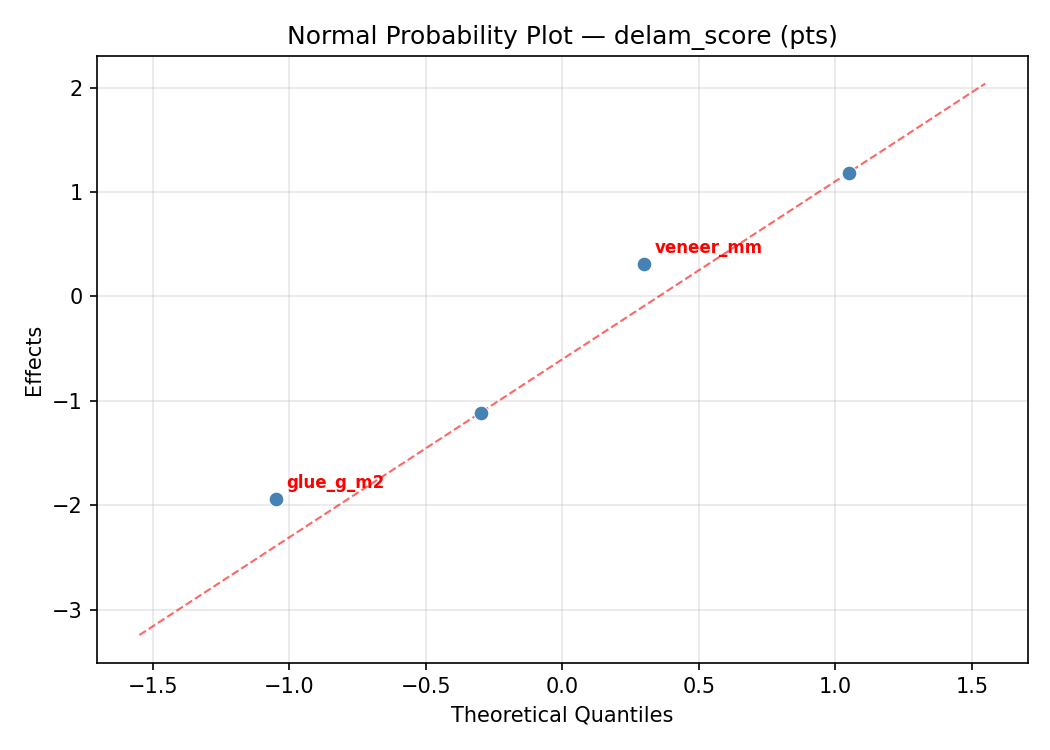
Response: delam_score
Top factors: veneer_mm (33.8%), glue_g_m2 (32.2%), press_min (22.4%).
ANOVA
| Source | DF | SS | MS | F | p-value |
|---|
| Source | DF | SS | MS | F | p-value |
| veneer_mm | 1 | 9.7656 | 9.7656 | 5.308 | 0.0694 |
| glue_g_m2 | 1 | 8.8506 | 8.8506 | 4.811 | 0.0798 |
| press_temp_c | 1 | 1.1556 | 1.1556 | 0.628 | 0.4640 |
| press_min | 1 | 4.3056 | 4.3056 | 2.340 | 0.1866 |
| veneer_mm*glue_g_m2 | 1 | 0.3906 | 0.3906 | 0.212 | 0.6643 |
| veneer_mm*press_temp_c | 1 | 1.6256 | 1.6256 | 0.884 | 0.3904 |
| veneer_mm*press_min | 1 | 3.3306 | 3.3306 | 1.810 | 0.2362 |
| glue_g_m2*press_temp_c | 1 | 0.2756 | 0.2756 | 0.150 | 0.7146 |
| glue_g_m2*press_min | 1 | 0.8556 | 0.8556 | 0.465 | 0.5256 |
| press_temp_c*press_min | 1 | 0.1056 | 0.1056 | 0.057 | 0.8201 |
| Error | 5 | 9.1981 | 1.8396 | | |
| Total | 15 | 39.8594 | 2.6573 | | |
Pareto Chart
Main Effects Plot
Normal Probability Plot of Effects
Half-Normal Plot of Effects
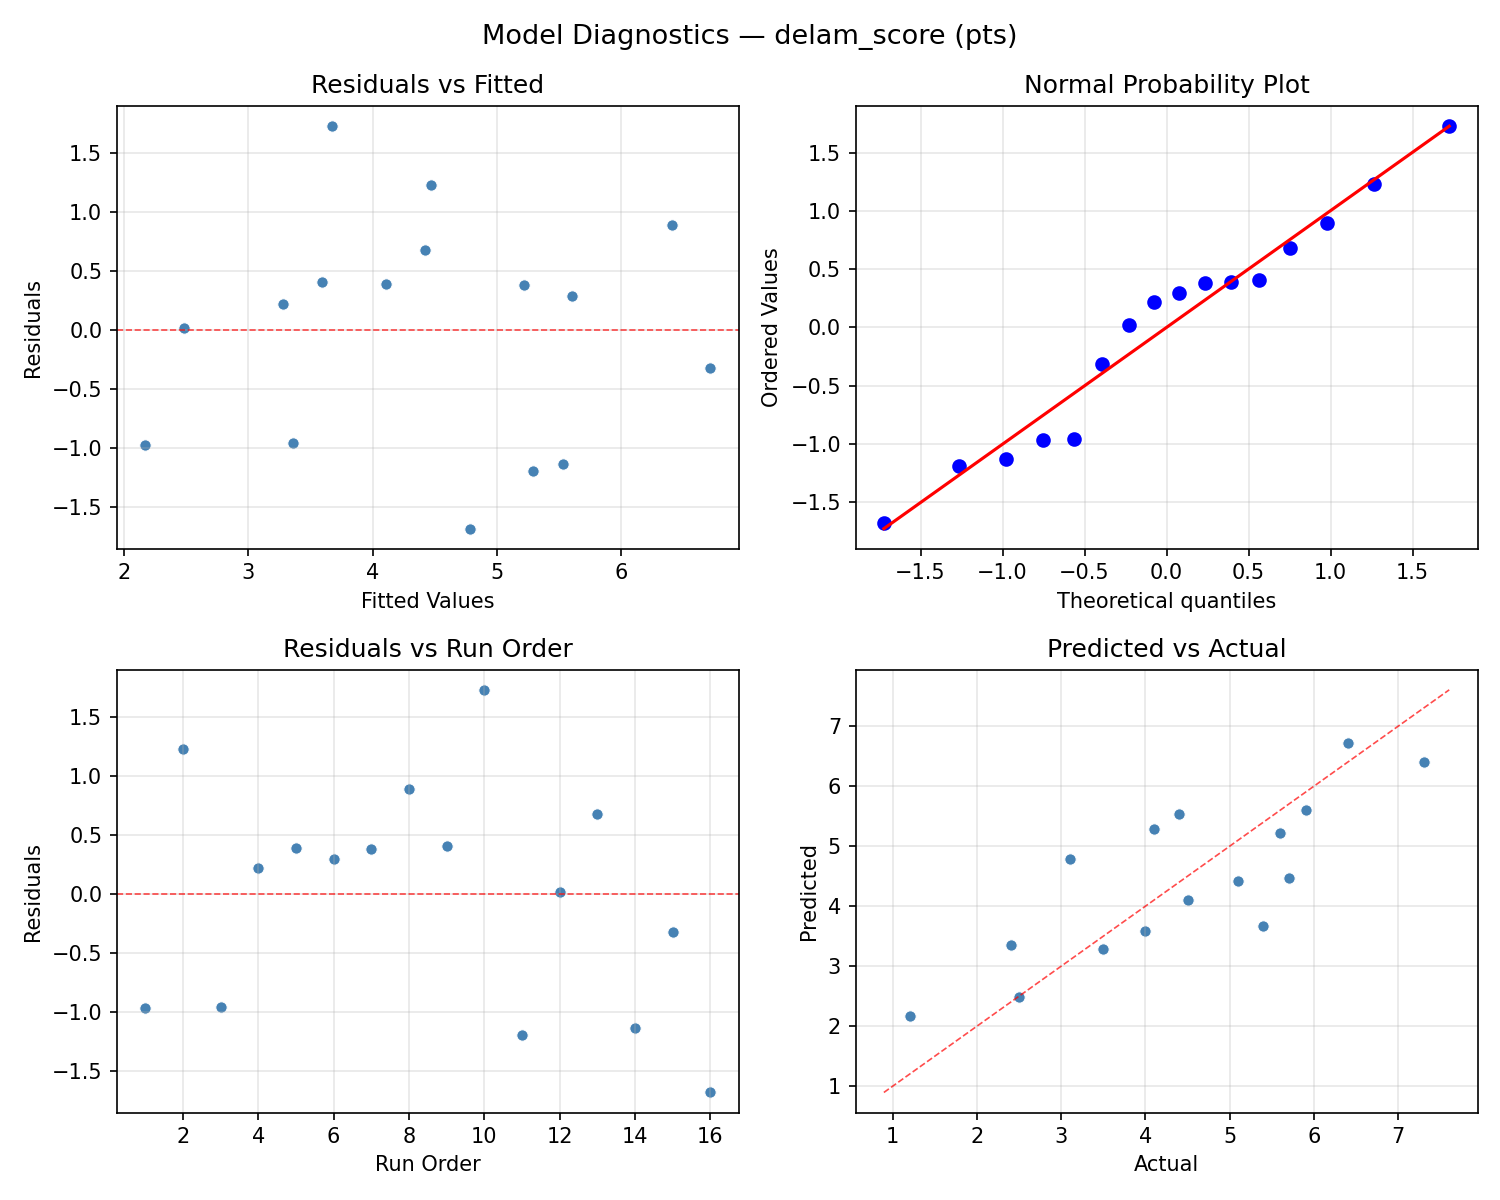
Model Diagnostics
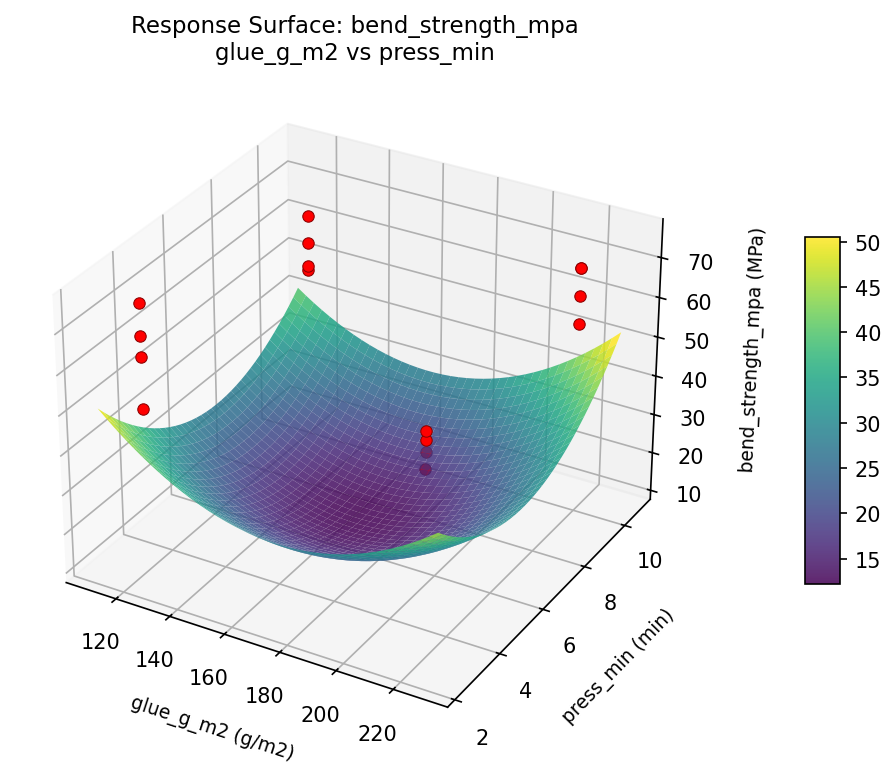
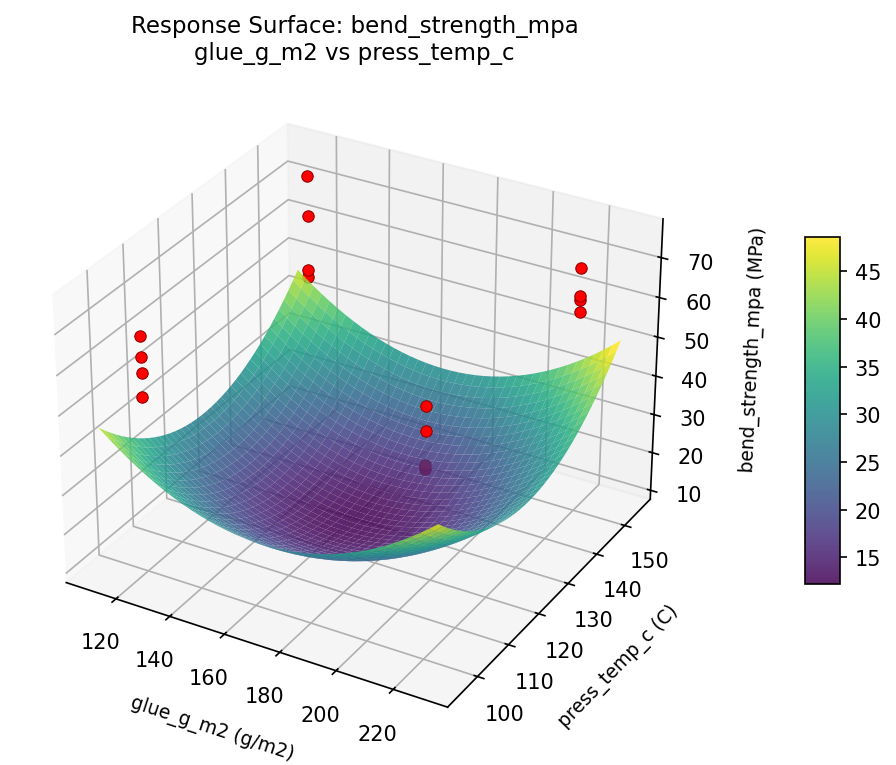
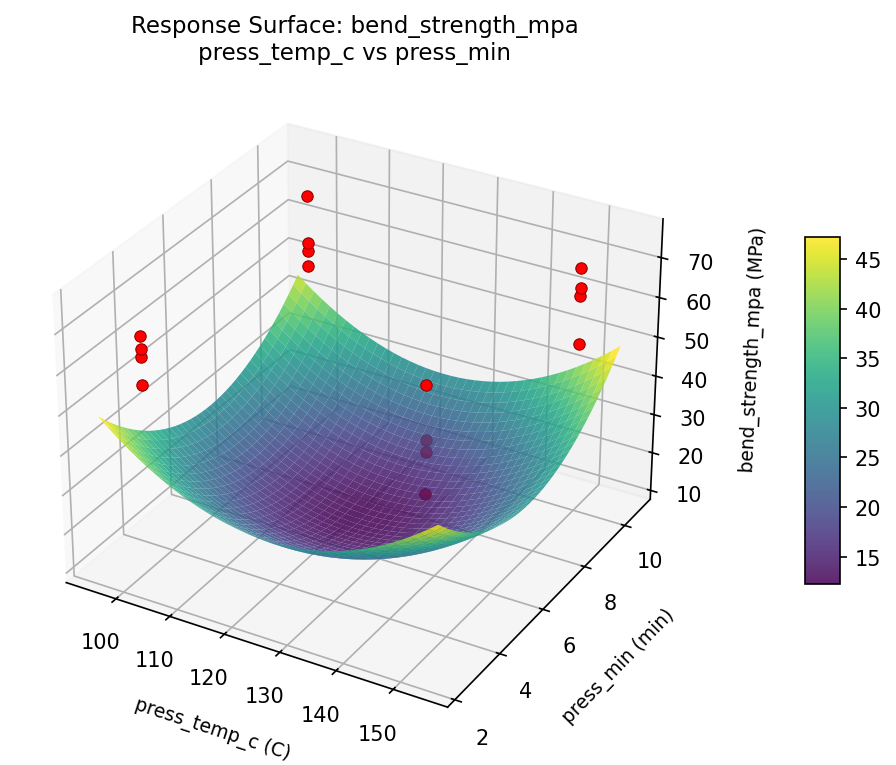
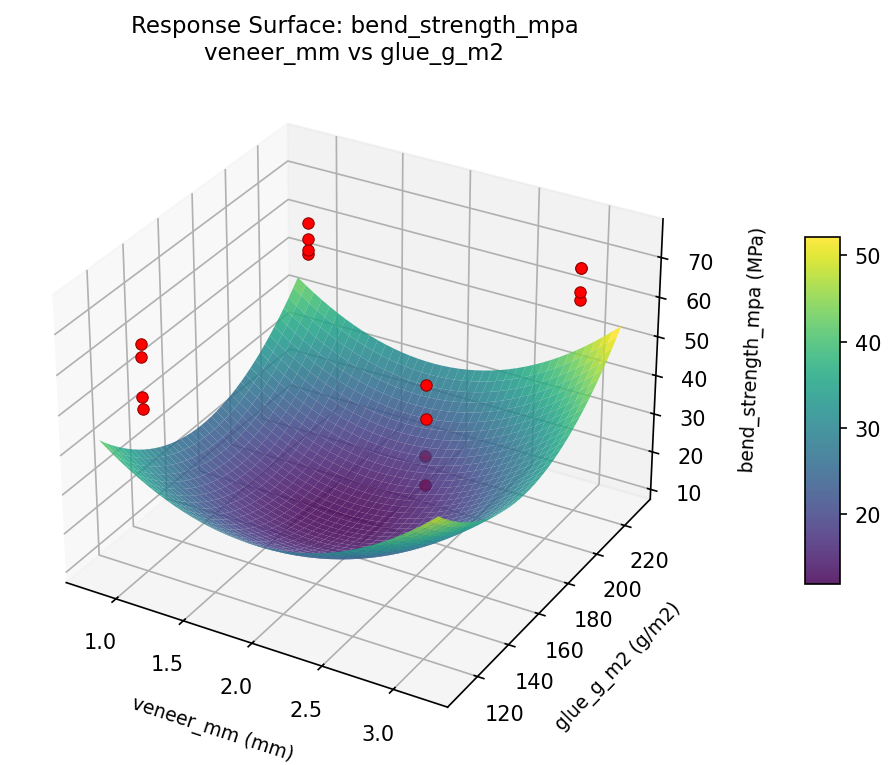
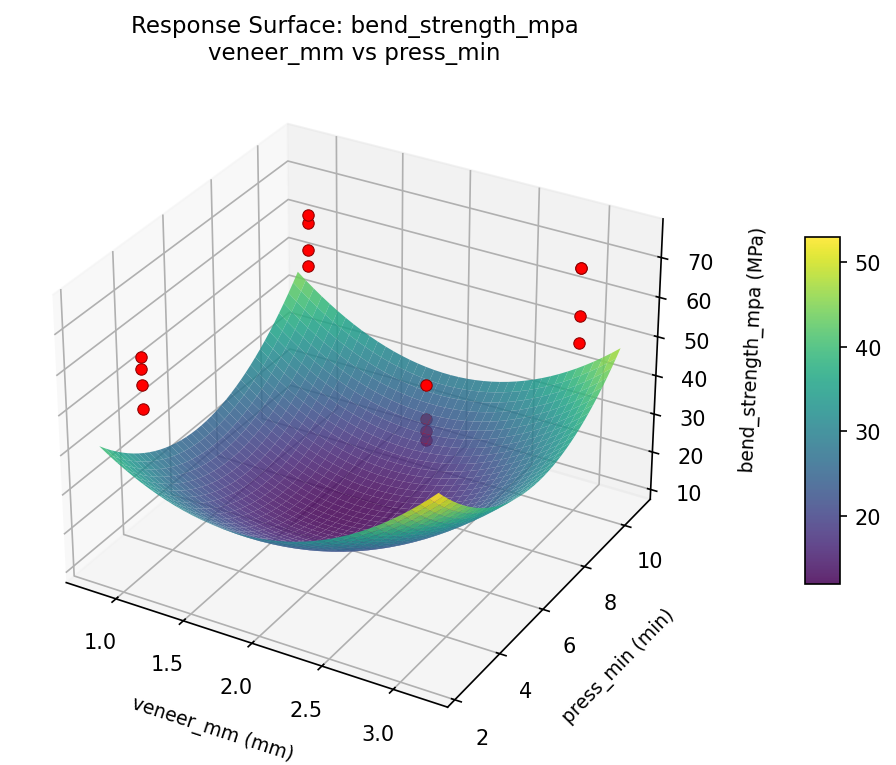
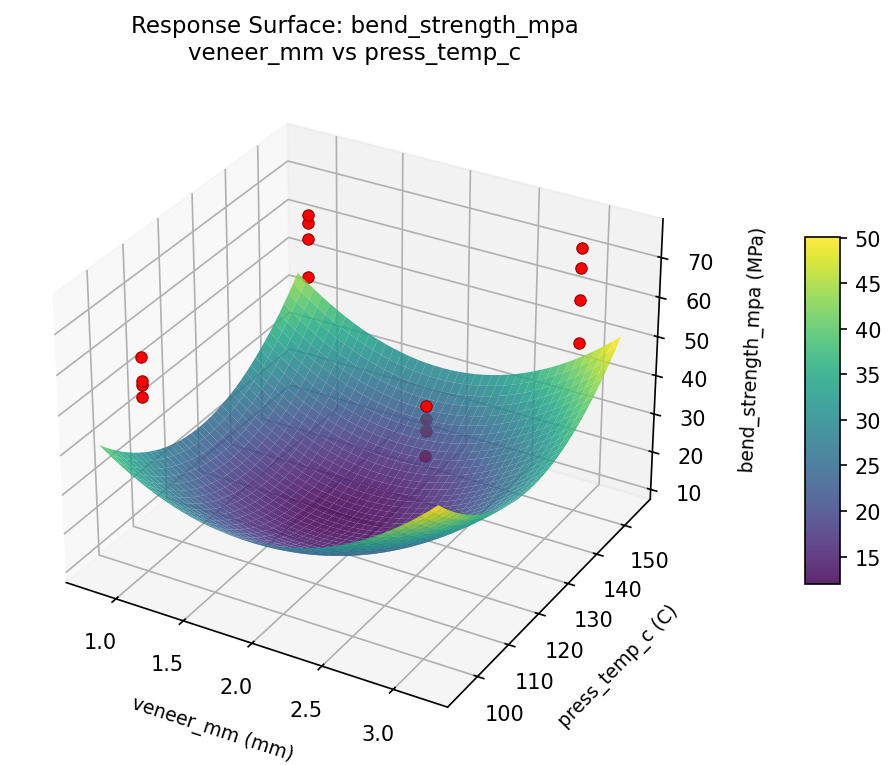
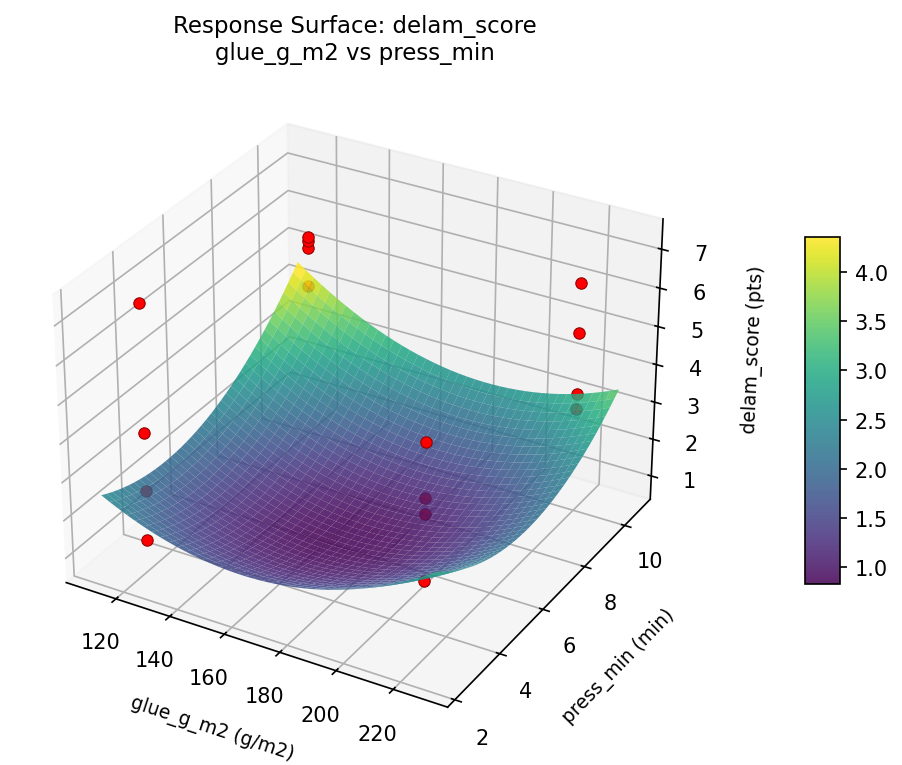
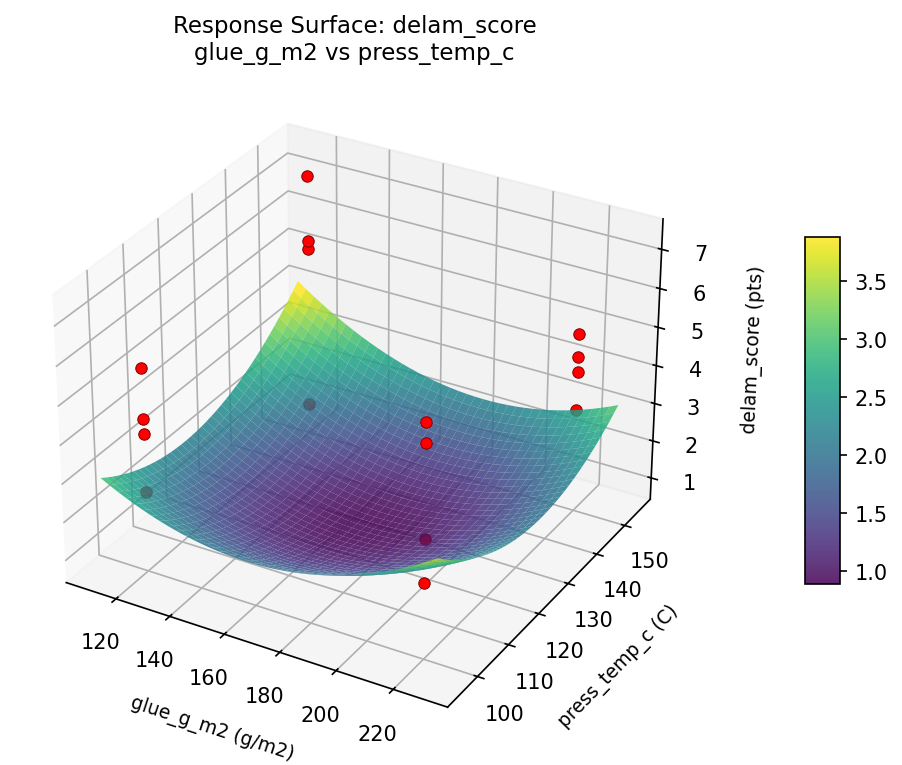
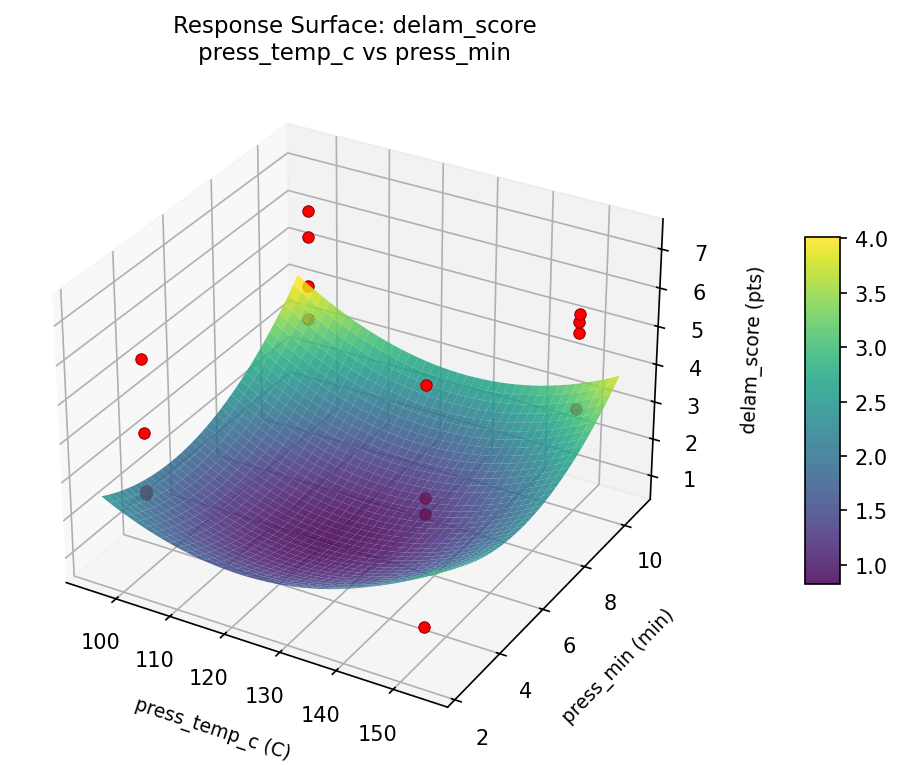
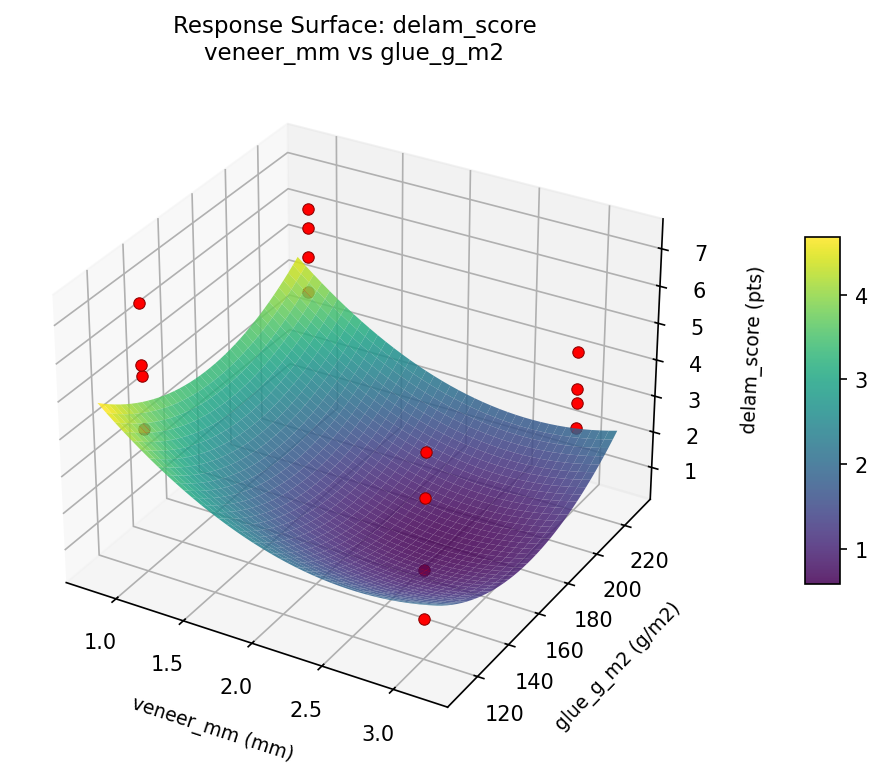
Response Surface Plots
3D surfaces fitted with quadratic RSM. Red dots are observed data points.
bend strength mpa glue g m2 vs press min
bend strength mpa glue g m2 vs press temp c
bend strength mpa press temp c vs press min
bend strength mpa veneer mm vs glue g m2
bend strength mpa veneer mm vs press min
bend strength mpa veneer mm vs press temp c
delam score glue g m2 vs press min
delam score glue g m2 vs press temp c
delam score press temp c vs press min
delam score veneer mm vs glue g m2
delam score veneer mm vs press min
delam score veneer mm vs press temp c
Multi-Objective Optimization
When responses compete, Derringer–Suich desirability finds the best compromise.
Each response is scaled to a 0–1 desirability, then combined via a weighted geometric mean.
Overall Desirability
D = 0.9545
Per-Response Desirability
| Response | Weight | Desirability | Predicted | Dir |
|---|
bend_strength_mpa |
1.5 |
|
75.00 0.9545 75.00 MPa |
↑ |
delam_score |
2.0 |
|
1.20 0.9545 1.20 pts |
↓ |
Recommended Settings
| Factor | Value |
|---|
veneer_mm | 3.0 mm |
glue_g_m2 | 220 g/m2 |
press_temp_c | 100 C |
press_min | 3 min |
Source: from observed run #1
Trade-off Summary
Sacrifice = how much worse than single-objective best.
| Response | Predicted | Best Observed | Sacrifice |
|---|
delam_score | 1.20 | 1.20 | +0.00 |
Top 3 Runs by Desirability
| Run | D | Factor Settings |
|---|
| #12 | 0.7227 | veneer_mm=3.0, glue_g_m2=120, press_temp_c=150, press_min=3 |
| #16 | 0.7158 | veneer_mm=1.0, glue_g_m2=120, press_temp_c=150, press_min=3 |
Model Quality
| Response | R² | Type |
|---|
delam_score | 0.2883 | linear |
Full Multi-Objective Output
============================================================
MULTI-OBJECTIVE OPTIMIZATION
Method: Derringer-Suich Desirability Function
============================================================
Overall desirability: D = 0.9545
Response Weight Desirability Predicted Direction
---------------------------------------------------------------------
bend_strength_mpa 1.5 0.9545 75.00 MPa ↑
delam_score 2.0 0.9545 1.20 pts ↓
Recommended settings:
veneer_mm = 3.0 mm
glue_g_m2 = 220 g/m2
press_temp_c = 100 C
press_min = 3 min
(from observed run #1)
Trade-off summary:
bend_strength_mpa: 75.00 (best observed: 75.00, sacrifice: +0.00)
delam_score: 1.20 (best observed: 1.20, sacrifice: +0.00)
Model quality:
bend_strength_mpa: R² = 0.1785 (linear)
delam_score: R² = 0.2883 (linear)
Top 3 observed runs by overall desirability:
1. Run #1 (D=0.9545): veneer_mm=3.0, glue_g_m2=220, press_temp_c=100, press_min=3
2. Run #12 (D=0.7227): veneer_mm=3.0, glue_g_m2=120, press_temp_c=150, press_min=3
3. Run #16 (D=0.7158): veneer_mm=1.0, glue_g_m2=120, press_temp_c=150, press_min=3
Full Analysis Output
=== Main Effects: bend_strength_mpa ===
Factor Effect Std Error % Contribution
--------------------------------------------------------------
glue_g_m2 -10.2500 1.8526 48.2%
veneer_mm 6.7500 1.8526 31.8%
press_min 2.5000 1.8526 11.8%
press_temp_c -1.7500 1.8526 8.2%
=== ANOVA Table: bend_strength_mpa ===
Source DF SS MS F p-value
-----------------------------------------------------------------------------
veneer_mm 1 182.2500 182.2500 8.046 0.0364
glue_g_m2 1 420.2500 420.2500 18.554 0.0077
press_temp_c 1 12.2500 12.2500 0.541 0.4951
press_min 1 25.0000 25.0000 1.104 0.3415
veneer_mm*glue_g_m2 1 12.2500 12.2500 0.541 0.4951
veneer_mm*press_temp_c 1 2.2500 2.2500 0.099 0.7654
veneer_mm*press_min 1 16.0000 16.0000 0.706 0.4390
glue_g_m2*press_temp_c 1 0.2500 0.2500 0.011 0.9204
glue_g_m2*press_min 1 4.0000 4.0000 0.177 0.6918
press_temp_c*press_min 1 36.0000 36.0000 1.589 0.2630
Error 5 113.2500 22.6500
Total 15 823.7500 54.9167
=== Interaction Effects: bend_strength_mpa ===
Factor A Factor B Interaction % Contribution
------------------------------------------------------------------------
press_temp_c press_min -3.0000 34.3%
veneer_mm press_min -2.0000 22.9%
veneer_mm glue_g_m2 1.7500 20.0%
glue_g_m2 press_min -1.0000 11.4%
veneer_mm press_temp_c -0.7500 8.6%
glue_g_m2 press_temp_c -0.2500 2.9%
=== Summary Statistics: bend_strength_mpa ===
veneer_mm:
Level N Mean Std Min Max
------------------------------------------------------------
1.0 8 57.7500 7.6298 49.0000 70.0000
3.0 8 64.5000 5.7817 58.0000 75.0000
glue_g_m2:
Level N Mean Std Min Max
------------------------------------------------------------
120 8 66.2500 5.7009 56.0000 75.0000
220 8 56.0000 5.0143 49.0000 62.0000
press_temp_c:
Level N Mean Std Min Max
------------------------------------------------------------
100 8 62.0000 8.0356 52.0000 75.0000
150 8 60.2500 7.1664 49.0000 70.0000
press_min:
Level N Mean Std Min Max
------------------------------------------------------------
10 8 59.8750 7.3957 49.0000 70.0000
3 8 62.3750 7.7078 51.0000 75.0000
=== Main Effects: delam_score ===
Factor Effect Std Error % Contribution
--------------------------------------------------------------
veneer_mm -1.5625 0.4075 33.8%
glue_g_m2 1.4875 0.4075 32.2%
press_min -1.0375 0.4075 22.4%
press_temp_c 0.5375 0.4075 11.6%
=== ANOVA Table: delam_score ===
Source DF SS MS F p-value
-----------------------------------------------------------------------------
veneer_mm 1 9.7656 9.7656 5.308 0.0694
glue_g_m2 1 8.8506 8.8506 4.811 0.0798
press_temp_c 1 1.1556 1.1556 0.628 0.4640
press_min 1 4.3056 4.3056 2.340 0.1866
veneer_mm*glue_g_m2 1 0.3906 0.3906 0.212 0.6643
veneer_mm*press_temp_c 1 1.6256 1.6256 0.884 0.3904
veneer_mm*press_min 1 3.3306 3.3306 1.810 0.2362
glue_g_m2*press_temp_c 1 0.2756 0.2756 0.150 0.7146
glue_g_m2*press_min 1 0.8556 0.8556 0.465 0.5256
press_temp_c*press_min 1 0.1056 0.1056 0.057 0.8201
Error 5 9.1981 1.8396
Total 15 39.8594 2.6573
=== Interaction Effects: delam_score ===
Factor A Factor B Interaction % Contribution
------------------------------------------------------------------------
veneer_mm press_min 0.9125 33.2%
veneer_mm press_temp_c 0.6375 23.2%
glue_g_m2 press_min 0.4625 16.8%
veneer_mm glue_g_m2 -0.3125 11.4%
glue_g_m2 press_temp_c -0.2625 9.5%
press_temp_c press_min 0.1625 5.9%
=== Summary Statistics: delam_score ===
veneer_mm:
Level N Mean Std Min Max
------------------------------------------------------------
1.0 8 5.2250 1.6490 2.4000 7.3000
3.0 8 3.6625 1.2569 1.2000 5.1000
glue_g_m2:
Level N Mean Std Min Max
------------------------------------------------------------
120 8 3.7000 1.7696 1.2000 6.4000
220 8 5.1875 1.1395 4.0000 7.3000
press_temp_c:
Level N Mean Std Min Max
------------------------------------------------------------
100 8 4.1750 1.8195 1.2000 6.4000
150 8 4.7125 1.4894 2.4000 7.3000
press_min:
Level N Mean Std Min Max
------------------------------------------------------------
10 8 4.9625 1.5583 2.5000 7.3000
3 8 3.9250 1.6281 1.2000 5.9000
Optimization Recommendations
=== Optimization: bend_strength_mpa ===
Direction: maximize
Best observed run: #1
veneer_mm = 3.0
glue_g_m2 = 120
press_temp_c = 100
press_min = 10
Value: 75.0
RSM Model (linear, R² = 0.1062, Adj R² = -0.2188):
Coefficients:
intercept +61.1250
veneer_mm +1.5000
glue_g_m2 -0.1250
press_temp_c +1.6250
press_min +0.7500
RSM Model (quadratic, R² = 0.8036, Adj R² = -1.9454):
Coefficients:
intercept +12.2250
veneer_mm +1.5000
glue_g_m2 -0.1250
press_temp_c +1.6250
press_min +0.7500
veneer_mm*glue_g_m2 -1.7500
veneer_mm*press_temp_c -5.0000
veneer_mm*press_min +2.3750
glue_g_m2*press_temp_c +1.3750
glue_g_m2*press_min +0.2500
press_temp_c*press_min -0.5000
veneer_mm^2 +12.2250
glue_g_m2^2 +12.2250
press_temp_c^2 +12.2250
press_min^2 +12.2250
Curvature analysis:
veneer_mm coef=+12.2250 convex (has a minimum)
glue_g_m2 coef=+12.2250 convex (has a minimum)
press_temp_c coef=+12.2250 convex (has a minimum)
press_min coef=+12.2250 convex (has a minimum)
Notable interactions:
veneer_mm*press_temp_c coef=-5.0000 (antagonistic)
veneer_mm*press_min coef=+2.3750 (synergistic)
veneer_mm*glue_g_m2 coef=-1.7500 (antagonistic)
glue_g_m2*press_temp_c coef=+1.3750 (synergistic)
press_temp_c*press_min coef=-0.5000 (antagonistic)
Predicted optimum (from linear model, at observed points):
veneer_mm = 3.0
glue_g_m2 = 120
press_temp_c = 150
press_min = 10
Predicted value: 65.1250
Surface optimum (via L-BFGS-B, linear model):
veneer_mm = 3
glue_g_m2 = 120
press_temp_c = 150
press_min = 10
Predicted value: 65.1250
Model quality: Weak fit — consider adding center points or using a different design.
Factor importance:
1. press_temp_c (effect: 3.2, contribution: 40.6%)
2. veneer_mm (effect: 3.0, contribution: 37.5%)
3. press_min (effect: -1.5, contribution: 18.8%)
4. glue_g_m2 (effect: -0.2, contribution: 3.1%)
=== Optimization: delam_score ===
Direction: minimize
Best observed run: #1
veneer_mm = 3.0
glue_g_m2 = 120
press_temp_c = 100
press_min = 10
Value: 1.2
RSM Model (linear, R² = 0.1894, Adj R² = -0.1054):
Coefficients:
intercept +4.4438
veneer_mm -0.4062
glue_g_m2 +0.4062
press_temp_c -0.3063
press_min -0.2187
RSM Model (quadratic, R² = 0.9245, Adj R² = -0.1320):
Coefficients:
intercept +0.8888
veneer_mm -0.4063
glue_g_m2 +0.4063
press_temp_c -0.3062
press_min -0.2187
veneer_mm*glue_g_m2 +0.1813
veneer_mm*press_temp_c +1.1688
veneer_mm*press_min -0.5437
glue_g_m2*press_temp_c -0.1437
glue_g_m2*press_min -0.0812
press_temp_c*press_min +0.3313
veneer_mm^2 +0.8888
glue_g_m2^2 +0.8888
press_temp_c^2 +0.8888
press_min^2 +0.8888
Curvature analysis:
veneer_mm coef=+0.8888 convex (has a minimum)
glue_g_m2 coef=+0.8888 convex (has a minimum)
press_min coef=+0.8888 convex (has a minimum)
press_temp_c coef=+0.8888 convex (has a minimum)
Notable interactions:
veneer_mm*press_temp_c coef=+1.1688 (synergistic)
veneer_mm*press_min coef=-0.5437 (antagonistic)
press_temp_c*press_min coef=+0.3313 (synergistic)
Predicted optimum (from linear model, at observed points):
veneer_mm = 1.0
glue_g_m2 = 220
press_temp_c = 100
press_min = 3
Predicted value: 5.7813
Surface optimum (via L-BFGS-B, linear model):
veneer_mm = 3
glue_g_m2 = 120
press_temp_c = 150
press_min = 10
Predicted value: 3.1063
Model quality: Weak fit — consider adding center points or using a different design.
Factor importance:
1. veneer_mm (effect: -0.8, contribution: 30.4%)
2. glue_g_m2 (effect: 0.8, contribution: 30.4%)
3. press_temp_c (effect: -0.6, contribution: 22.9%)
4. press_min (effect: 0.4, contribution: 16.4%)