Summary
This experiment investigates natural deodorant efficacy. Fractional factorial screening of baking soda, arrowroot powder, coconut oil, essential oil blend, and beeswax for odor control and skin sensitivity.
The design varies 5 factors: baking soda pct (%), ranging from 5 to 25, arrowroot pct (%), ranging from 10 to 30, coconut oil pct (%), ranging from 20 to 50, eo drops (drops/oz), ranging from 5 to 20, and beeswax pct (%), ranging from 2 to 10. The goal is to optimize 2 responses: odor control hrs (hrs) (maximize) and sensitivity score (pts) (minimize). Fixed conditions held constant across all runs include container = twist_up, batch size = 4oz.
A fractional factorial design reduces the number of runs from 32 to 8 by deliberately confounding higher-order interactions. This is ideal for screening — identifying which of the 5 factors matter most before investing in a full study.
Key Findings
For odor control hrs, the most influential factors were arrowroot pct (33.3%), eo drops (24.2%), baking soda pct (21.2%). The best observed value was 13.0 (at baking soda pct = 5, arrowroot pct = 30, coconut oil pct = 50).
For sensitivity score, the most influential factors were eo drops (27.4%), arrowroot pct (27.4%), coconut oil pct (20.2%). The best observed value was 0.8 (at baking soda pct = 25, arrowroot pct = 30, coconut oil pct = 50).
Recommended Next Steps
- Follow up with a response surface design (CCD or Box-Behnken) on the top 3–4 factors to model curvature and find the true optimum.
- Consider whether any fixed factors should be varied in a future study.
- The screening results can guide factor reduction — drop factors contributing less than 5% and re-run with a smaller, more focused design.
Experimental Setup
Factors
| Factor | Low | High | Unit |
|---|
baking_soda_pct | 5 | 25 | % |
arrowroot_pct | 10 | 30 | % |
coconut_oil_pct | 20 | 50 | % |
eo_drops | 5 | 20 | drops/oz |
beeswax_pct | 2 | 10 | % |
Fixed: container = twist_up, batch_size = 4oz
Responses
| Response | Direction | Unit |
|---|
odor_control_hrs | ↑ maximize | hrs |
sensitivity_score | ↓ minimize | pts |
Configuration
{
"metadata": {
"name": "Natural Deodorant Efficacy",
"description": "Fractional factorial screening of baking soda, arrowroot powder, coconut oil, essential oil blend, and beeswax for odor control and skin sensitivity"
},
"factors": [
{
"name": "baking_soda_pct",
"levels": [
"5",
"25"
],
"type": "continuous",
"unit": "%"
},
{
"name": "arrowroot_pct",
"levels": [
"10",
"30"
],
"type": "continuous",
"unit": "%"
},
{
"name": "coconut_oil_pct",
"levels": [
"20",
"50"
],
"type": "continuous",
"unit": "%"
},
{
"name": "eo_drops",
"levels": [
"5",
"20"
],
"type": "continuous",
"unit": "drops/oz"
},
{
"name": "beeswax_pct",
"levels": [
"2",
"10"
],
"type": "continuous",
"unit": "%"
}
],
"fixed_factors": {
"container": "twist_up",
"batch_size": "4oz"
},
"responses": [
{
"name": "odor_control_hrs",
"optimize": "maximize",
"unit": "hrs"
},
{
"name": "sensitivity_score",
"optimize": "minimize",
"unit": "pts"
}
],
"settings": {
"operation": "fractional_factorial",
"test_script": "use_cases/226_deodorant_efficacy/sim.sh"
}
}
Experimental Matrix
The Fractional Factorial Design produces 8 runs. Each row is one experiment with specific factor settings.
| Run | baking_soda_pct | arrowroot_pct | coconut_oil_pct | eo_drops | beeswax_pct |
|---|
| 1 | 5 | 30 | 50 | 5 | 2 |
| 2 | 25 | 10 | 20 | 5 | 2 |
| 3 | 25 | 30 | 20 | 20 | 2 |
| 4 | 25 | 30 | 50 | 20 | 10 |
| 5 | 5 | 30 | 20 | 5 | 10 |
| 6 | 25 | 10 | 50 | 5 | 10 |
| 7 | 5 | 10 | 20 | 20 | 10 |
| 8 | 5 | 10 | 50 | 20 | 2 |
Step-by-Step Workflow
1
Preview the design
$ doe info --config use_cases/226_deodorant_efficacy/config.json
2
Generate the runner script
$ doe generate --config use_cases/226_deodorant_efficacy/config.json \
--output use_cases/226_deodorant_efficacy/results/run.sh --seed 42
3
Execute the experiments
$ bash use_cases/226_deodorant_efficacy/results/run.sh
4
Analyze results
$ doe analyze --config use_cases/226_deodorant_efficacy/config.json
5
Get optimization recommendations
$ doe optimize --config use_cases/226_deodorant_efficacy/config.json
6
Multi-objective optimization
With 2 competing responses, use --multi to find the best compromise via Derringer–Suich desirability.
$ doe optimize --config use_cases/226_deodorant_efficacy/config.json --multi
7
Generate the HTML report
$ doe report --config use_cases/226_deodorant_efficacy/config.json \
--output use_cases/226_deodorant_efficacy/results/report.html
Features Exercised
| Feature | Value |
|---|
| Design type | fractional_factorial |
| Factor types | continuous (all 5) |
| Arg style | double-dash |
| Responses | 2 (odor_control_hrs ↑, sensitivity_score ↓) |
| Total runs | 8 |
Analysis Results
Generated from actual experiment runs using the DOE Helper Tool.
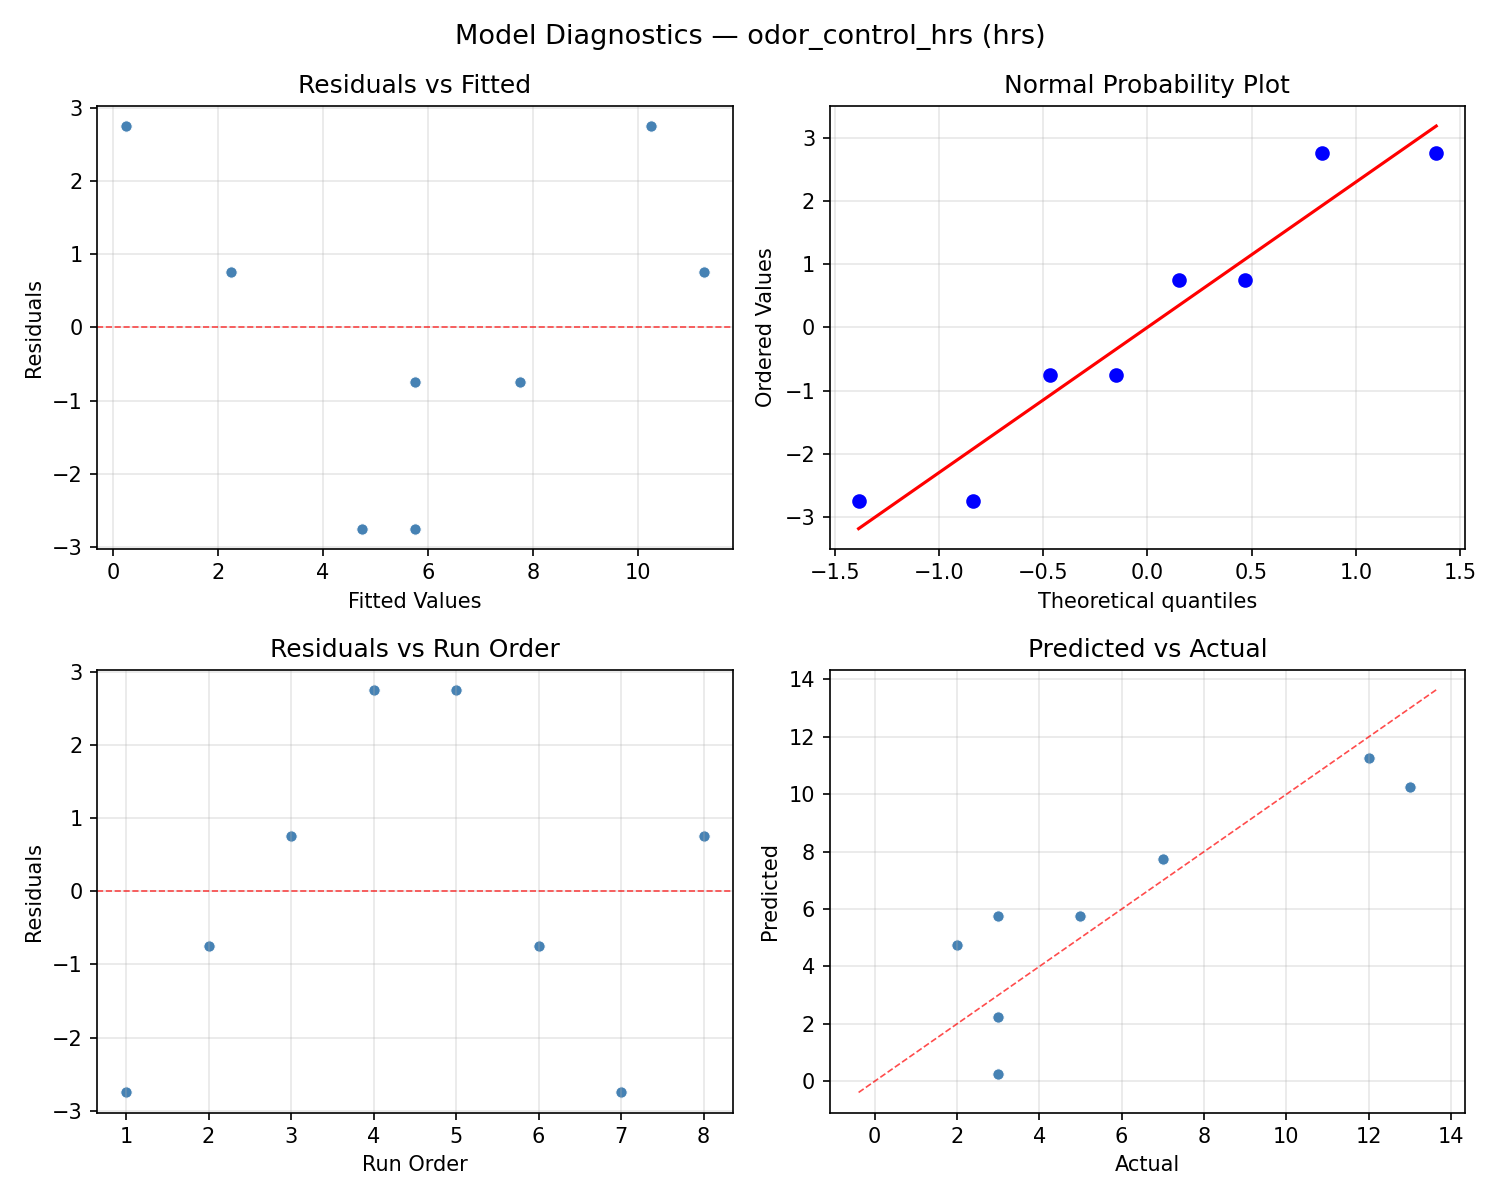
Response: odor_control_hrs
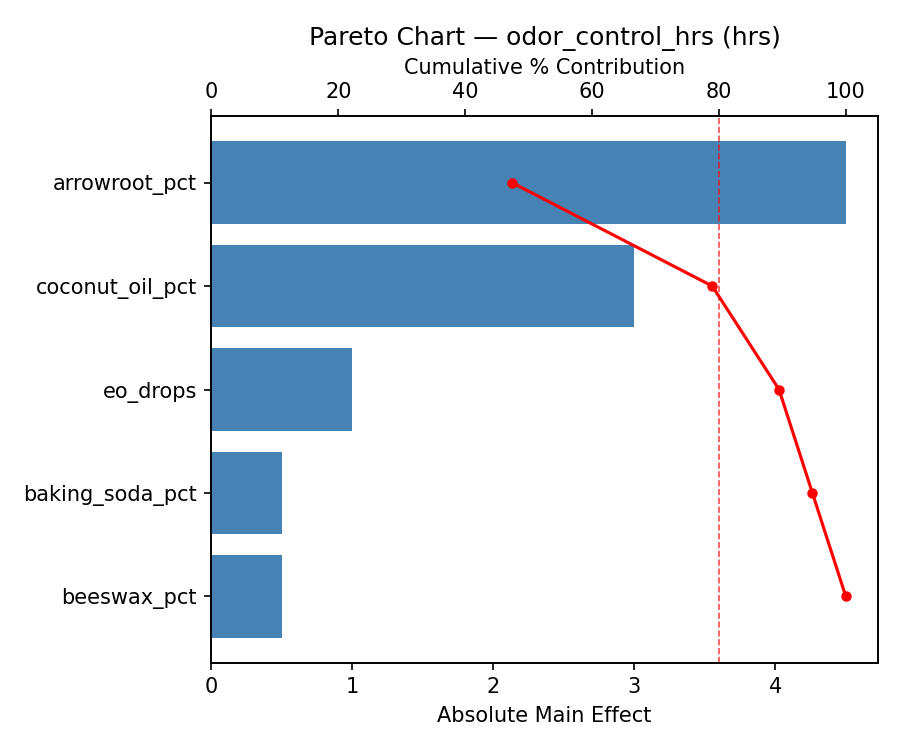
Top factors: arrowroot_pct (33.3%), eo_drops (24.2%), baking_soda_pct (21.2%).
ANOVA
| Source | DF | SS | MS | F | p-value |
|---|
| Source | DF | SS | MS | F | p-value |
| baking_soda_pct | 1 | 24.5000 | 24.5000 | 3.630 | 0.1151 |
| arrowroot_pct | 1 | 60.5000 | 60.5000 | 8.963 | 0.0303 |
| coconut_oil_pct | 1 | 4.5000 | 4.5000 | 0.667 | 0.4513 |
| eo_drops | 1 | 32.0000 | 32.0000 | 4.741 | 0.0814 |
| beeswax_pct | 1 | 8.0000 | 8.0000 | 1.185 | 0.3260 |
| baking_soda_pct*arrowroot_pct | 1 | 32.0000 | 32.0000 | 4.741 | 0.0814 |
| baking_soda_pct*coconut_oil_pct | 1 | 8.0000 | 8.0000 | 1.185 | 0.3260 |
| baking_soda_pct*eo_drops | 1 | 60.5000 | 60.5000 | 8.963 | 0.0303 |
| baking_soda_pct*beeswax_pct | 1 | 4.5000 | 4.5000 | 0.667 | 0.4513 |
| arrowroot_pct*coconut_oil_pct | 1 | 0.0000 | 0.0000 | 0.000 | 1.0000 |
| arrowroot_pct*eo_drops | 1 | 24.5000 | 24.5000 | 3.630 | 0.1151 |
| arrowroot_pct*beeswax_pct | 1 | 0.5000 | 0.5000 | 0.074 | 0.7964 |
| coconut_oil_pct*eo_drops | 1 | 0.5000 | 0.5000 | 0.074 | 0.7964 |
| coconut_oil_pct*beeswax_pct | 1 | 24.5000 | 24.5000 | 3.630 | 0.1151 |
| eo_drops*beeswax_pct | 1 | 0.0000 | 0.0000 | 0.000 | 1.0000 |
| Error | (Lenth | PSE) | 5 | 33.7500 | 6.7500 |
| Total | 7 | 130.0000 | 18.5714 | | |
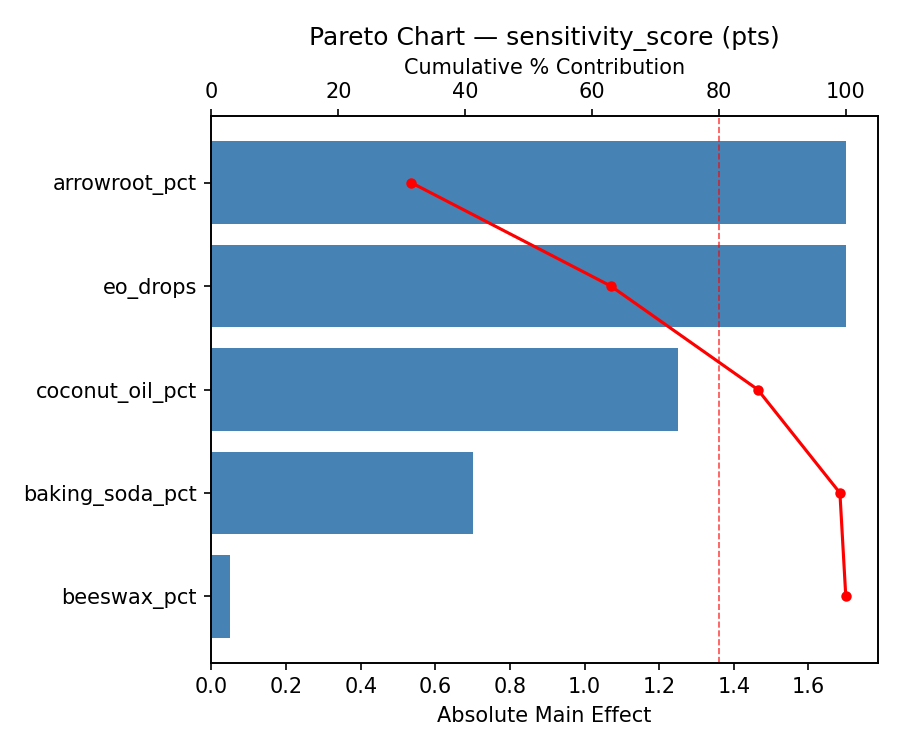
Pareto Chart
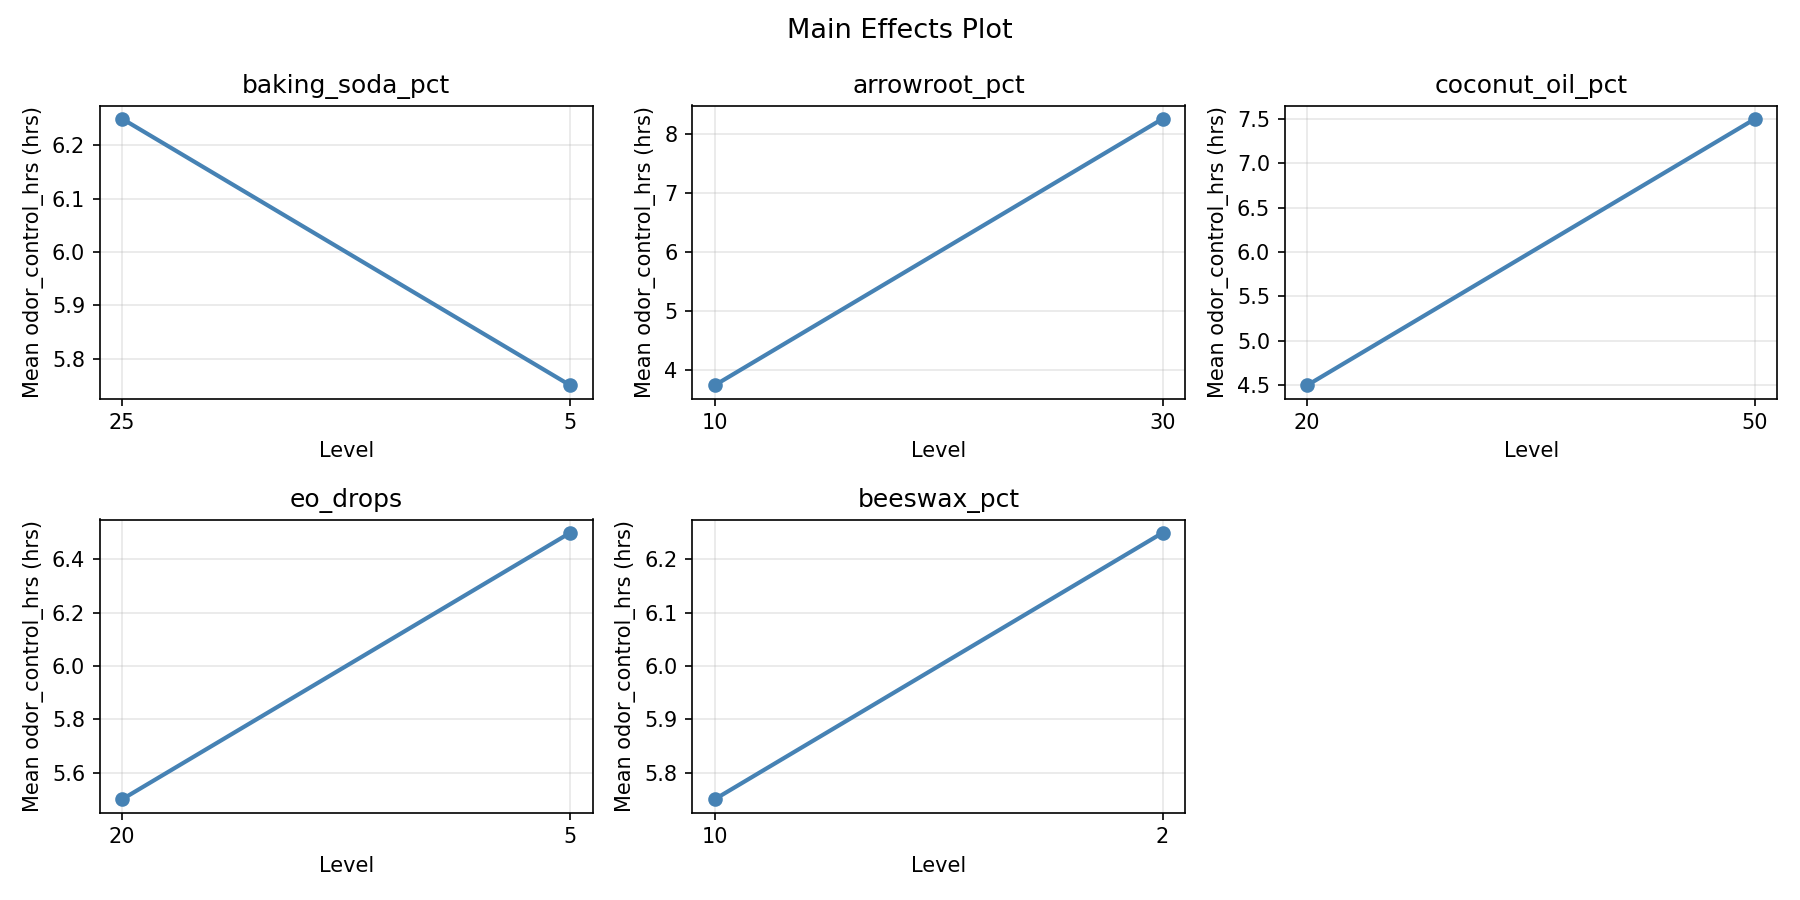
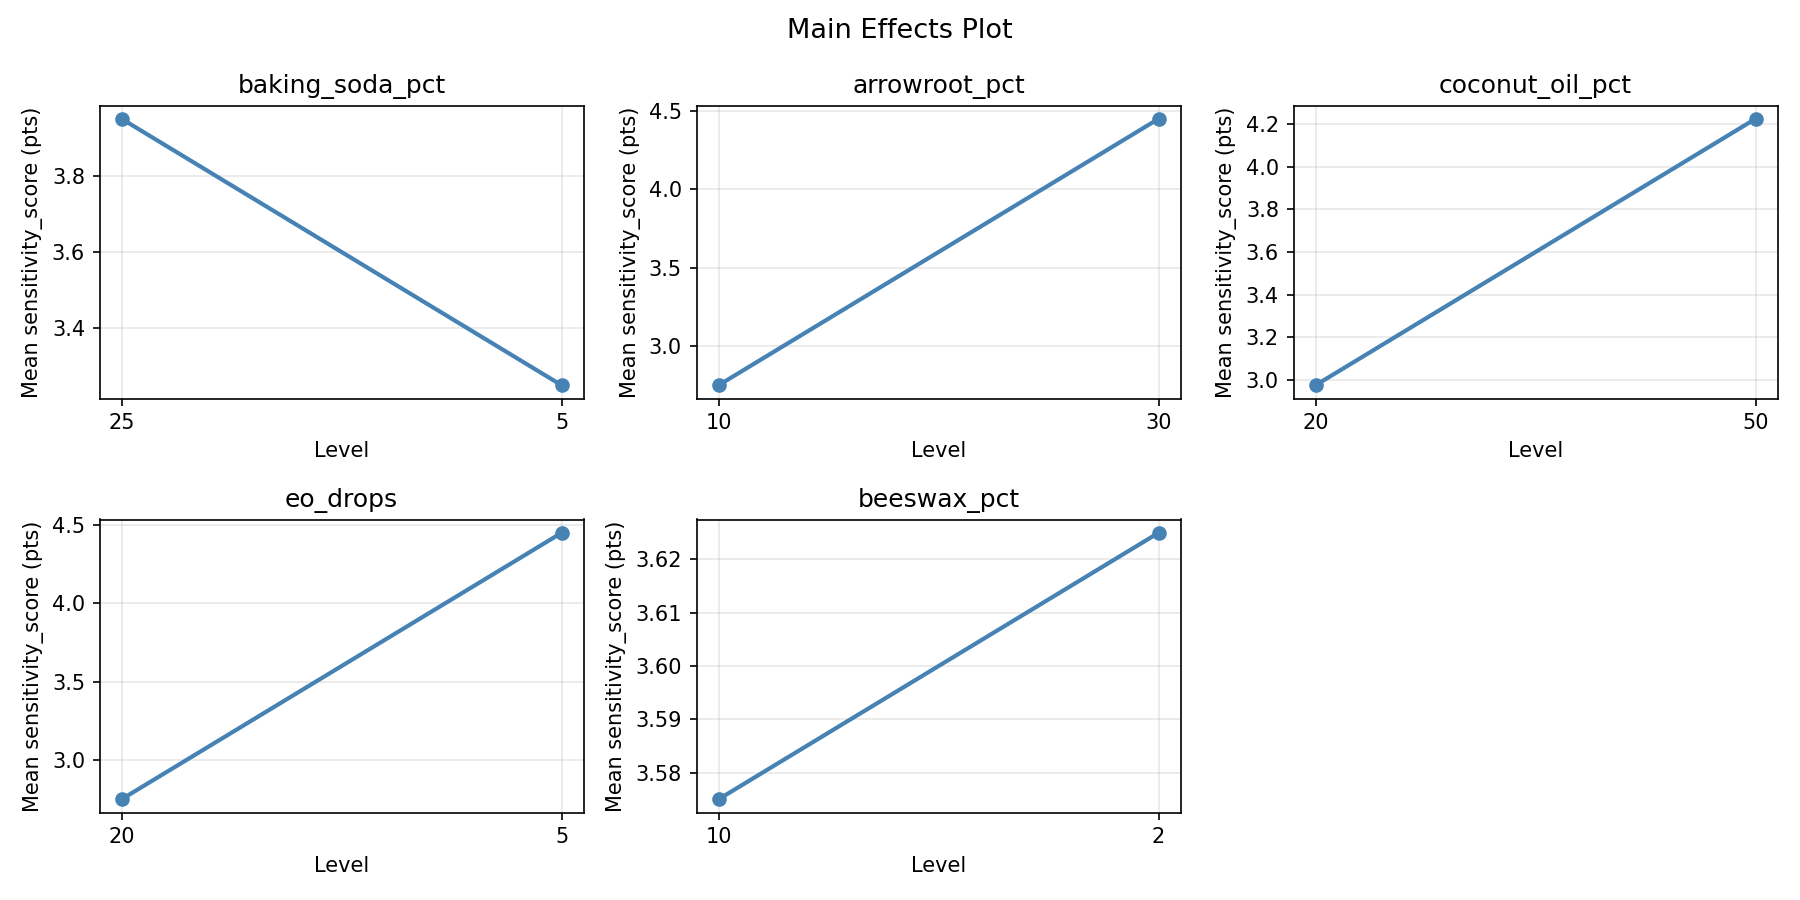
Main Effects Plot
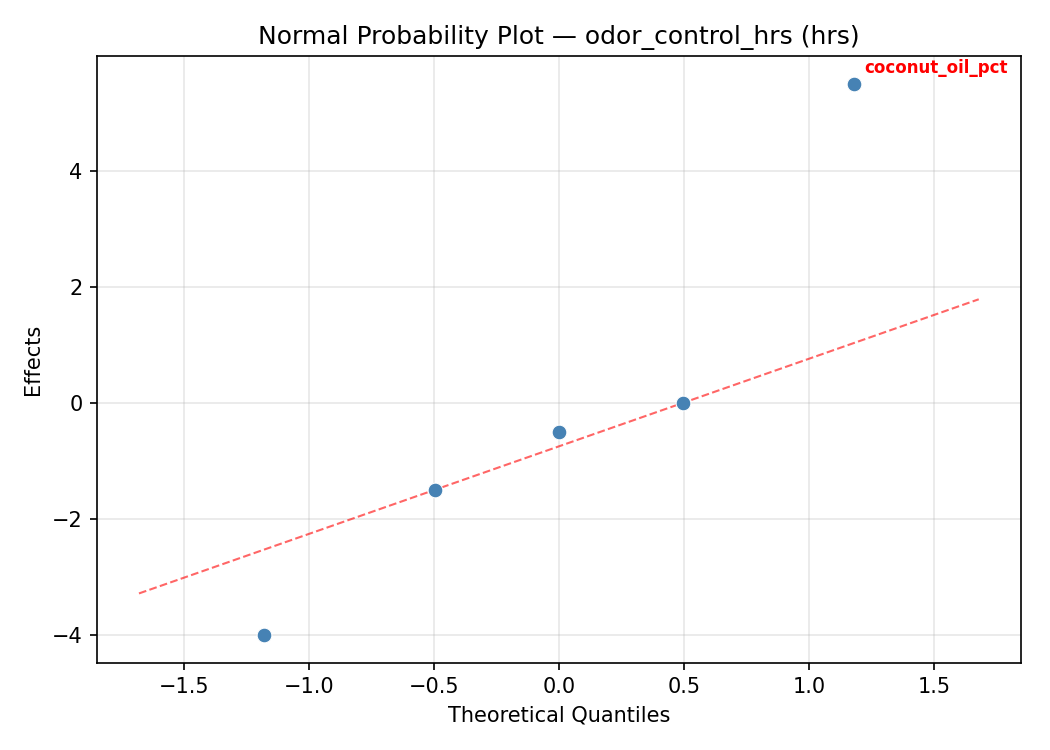
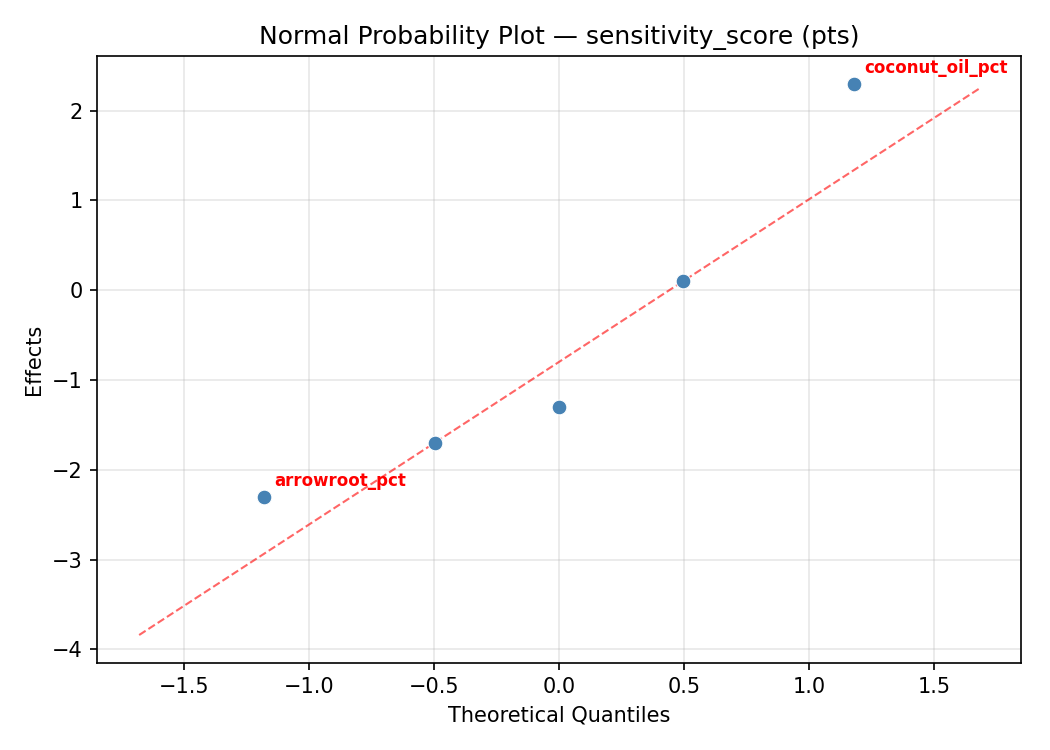
Normal Probability Plot of Effects
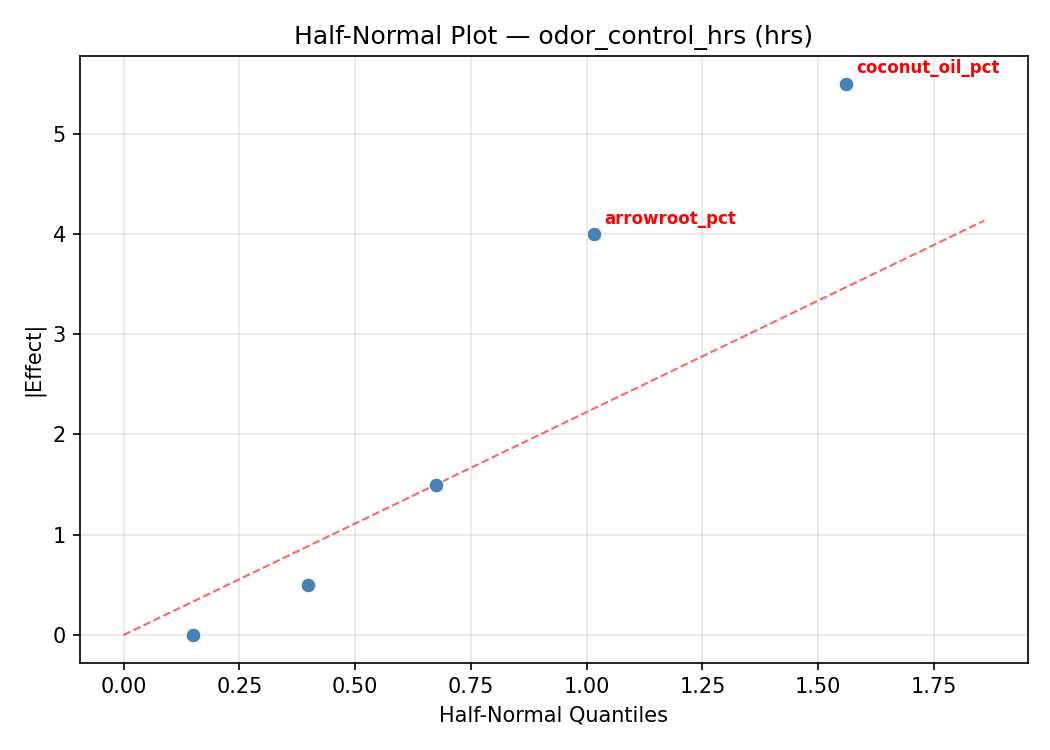
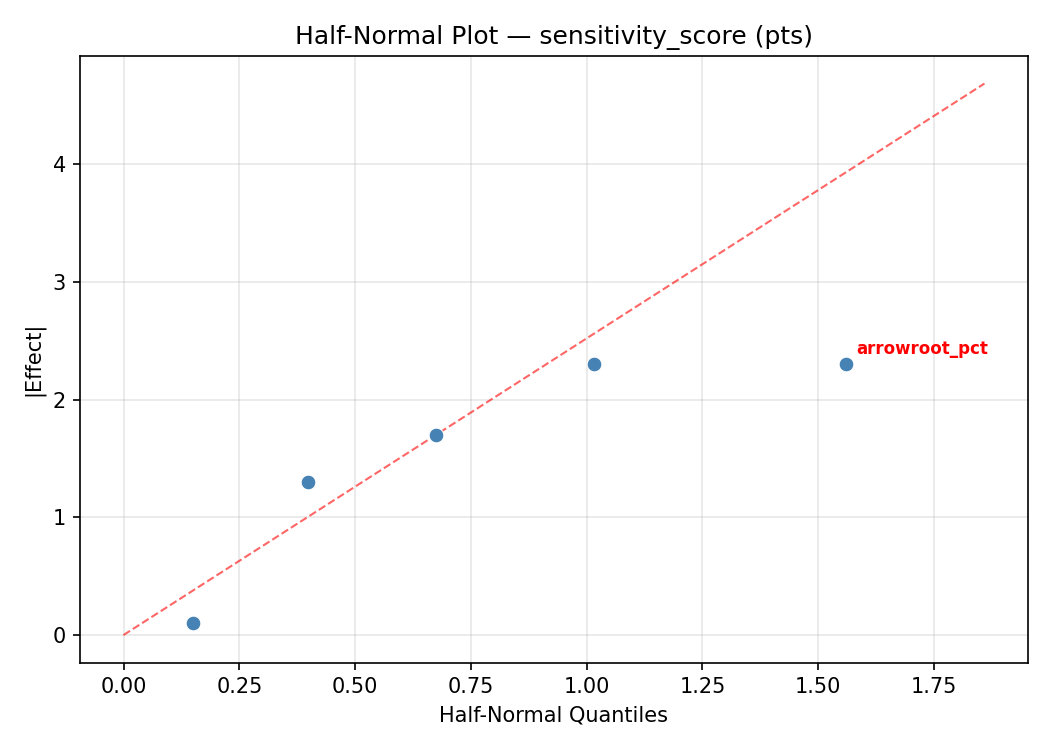
Half-Normal Plot of Effects
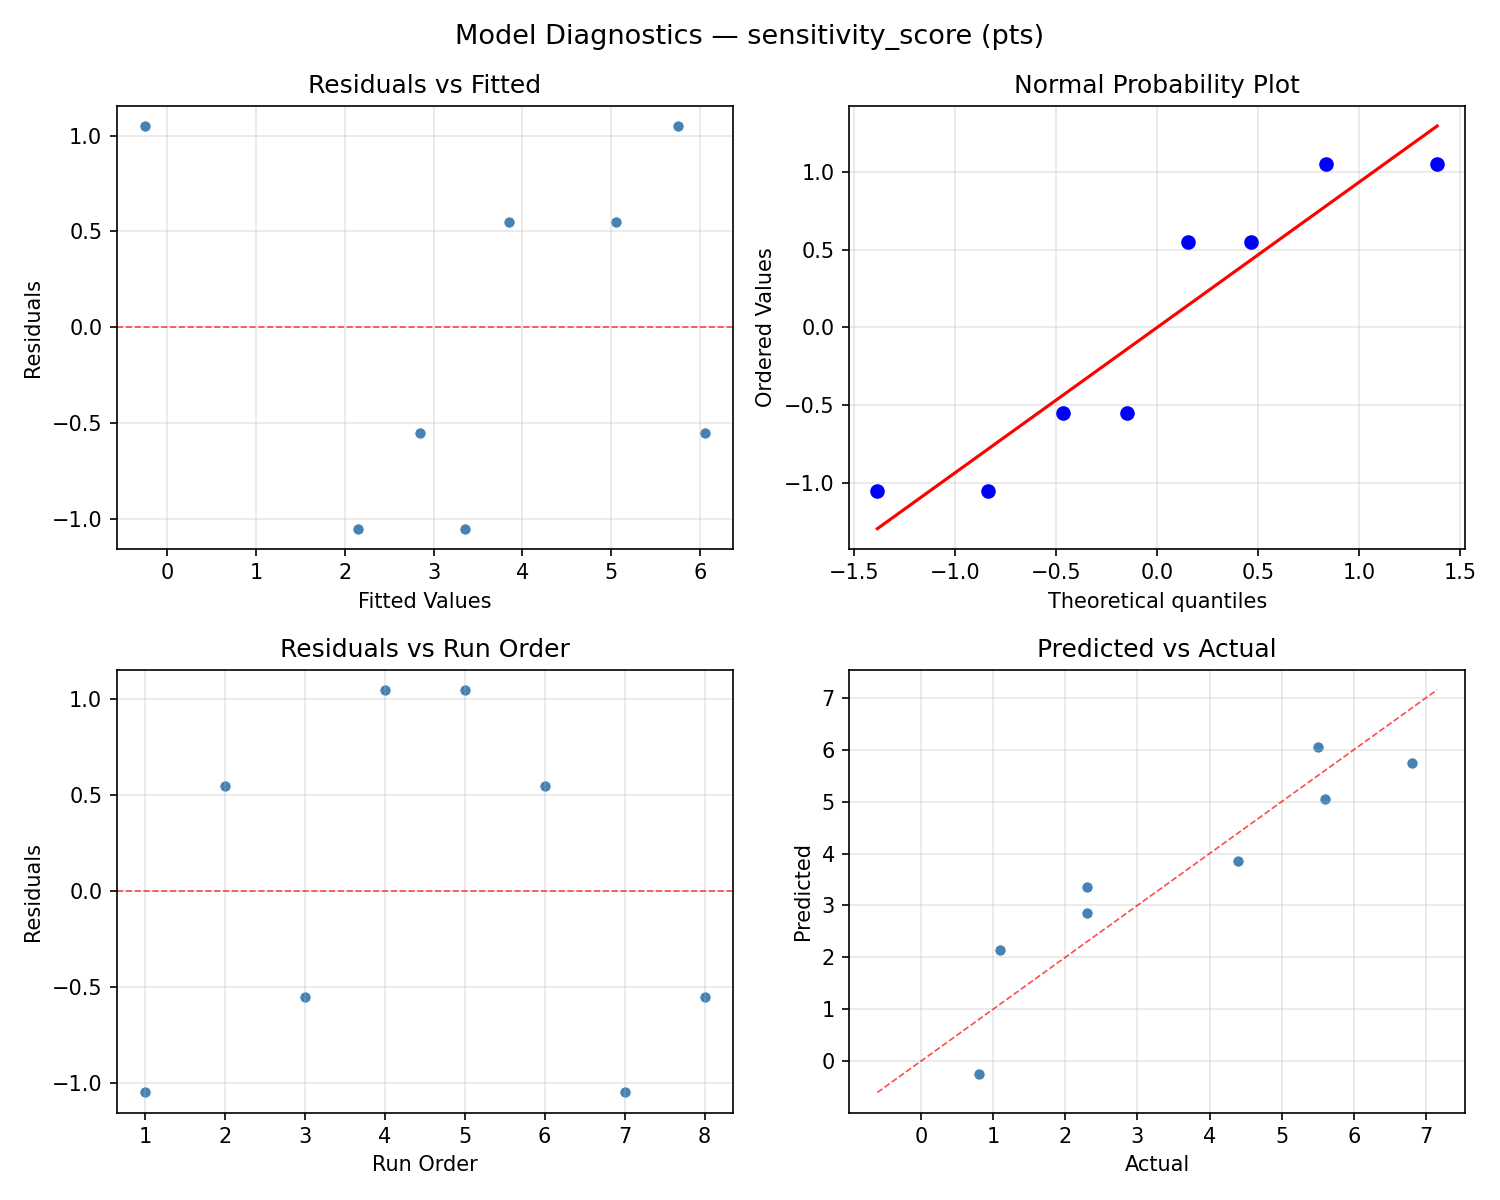
Model Diagnostics
Response: sensitivity_score
Top factors: eo_drops (27.4%), arrowroot_pct (27.4%), coconut_oil_pct (20.2%).
ANOVA
| Source | DF | SS | MS | F | p-value |
|---|
| Source | DF | SS | MS | F | p-value |
| baking_soda_pct | 1 | 0.5000 | 0.5000 | 0.065 | 0.8088 |
| arrowroot_pct | 1 | 10.5800 | 10.5800 | 1.378 | 0.2934 |
| coconut_oil_pct | 1 | 5.7800 | 5.7800 | 0.753 | 0.4253 |
| eo_drops | 1 | 10.5800 | 10.5800 | 1.378 | 0.2934 |
| beeswax_pct | 1 | 5.1200 | 5.1200 | 0.667 | 0.4513 |
| baking_soda_pct*arrowroot_pct | 1 | 10.5800 | 10.5800 | 1.378 | 0.2934 |
| baking_soda_pct*coconut_oil_pct | 1 | 5.1200 | 5.1200 | 0.667 | 0.4513 |
| baking_soda_pct*eo_drops | 1 | 10.5800 | 10.5800 | 1.378 | 0.2934 |
| baking_soda_pct*beeswax_pct | 1 | 5.7800 | 5.7800 | 0.753 | 0.4253 |
| arrowroot_pct*coconut_oil_pct | 1 | 0.0200 | 0.0200 | 0.003 | 0.9613 |
| arrowroot_pct*eo_drops | 1 | 0.5000 | 0.5000 | 0.065 | 0.8088 |
| arrowroot_pct*beeswax_pct | 1 | 3.3800 | 3.3800 | 0.440 | 0.5364 |
| coconut_oil_pct*eo_drops | 1 | 3.3800 | 3.3800 | 0.440 | 0.5364 |
| coconut_oil_pct*beeswax_pct | 1 | 0.5000 | 0.5000 | 0.065 | 0.8088 |
| eo_drops*beeswax_pct | 1 | 0.0200 | 0.0200 | 0.003 | 0.9613 |
| Error | (Lenth | PSE) | 5 | 38.4000 | 7.6800 |
| Total | 7 | 35.9600 | 5.1371 | | |
Pareto Chart
Main Effects Plot
Normal Probability Plot of Effects
Half-Normal Plot of Effects
Model Diagnostics
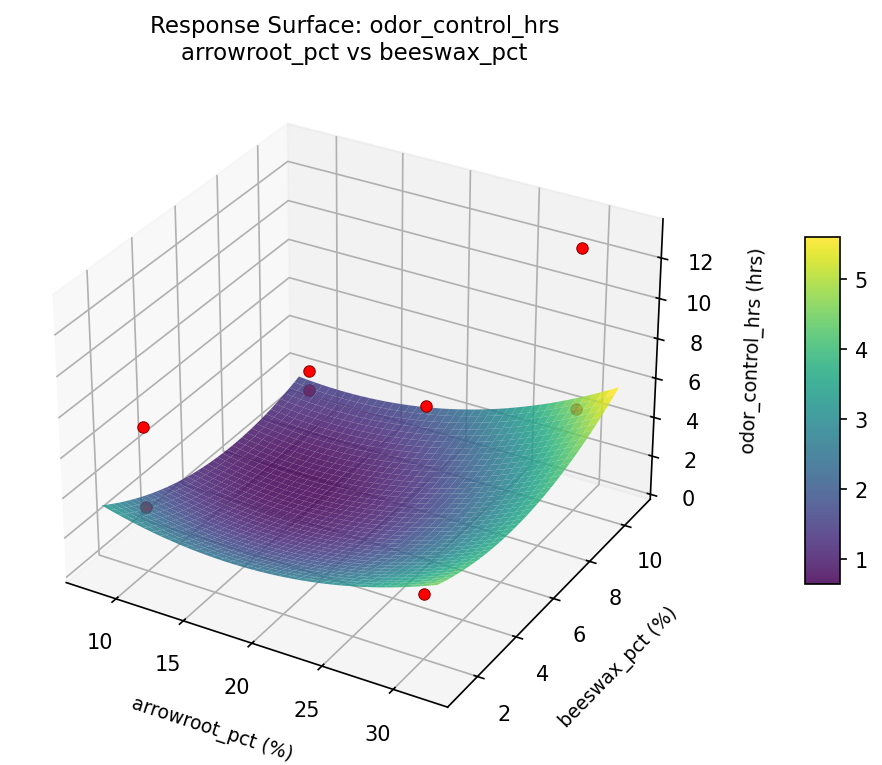
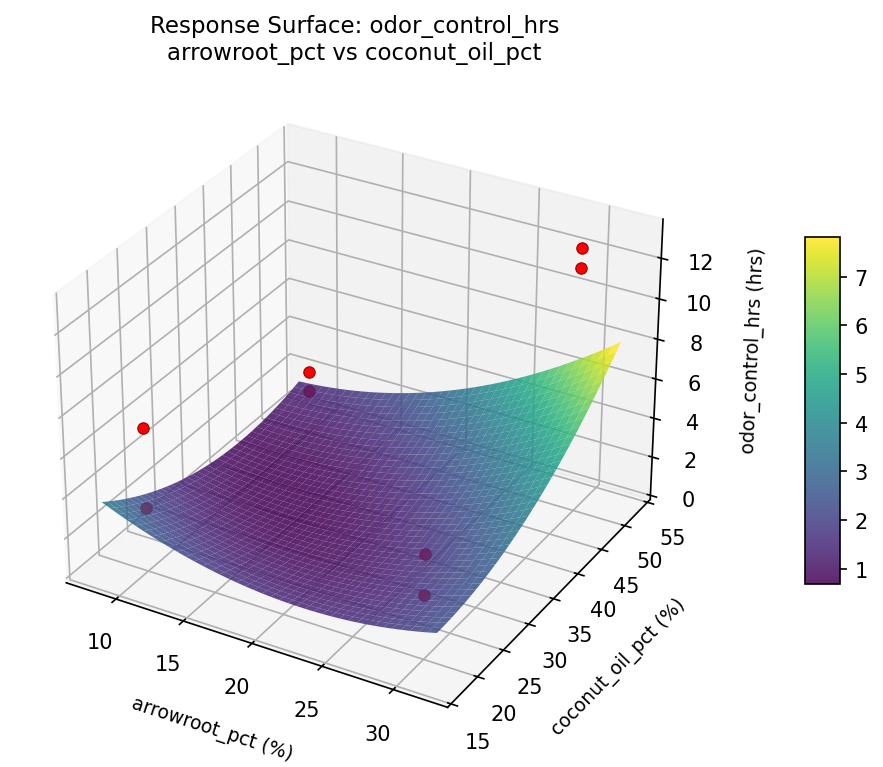
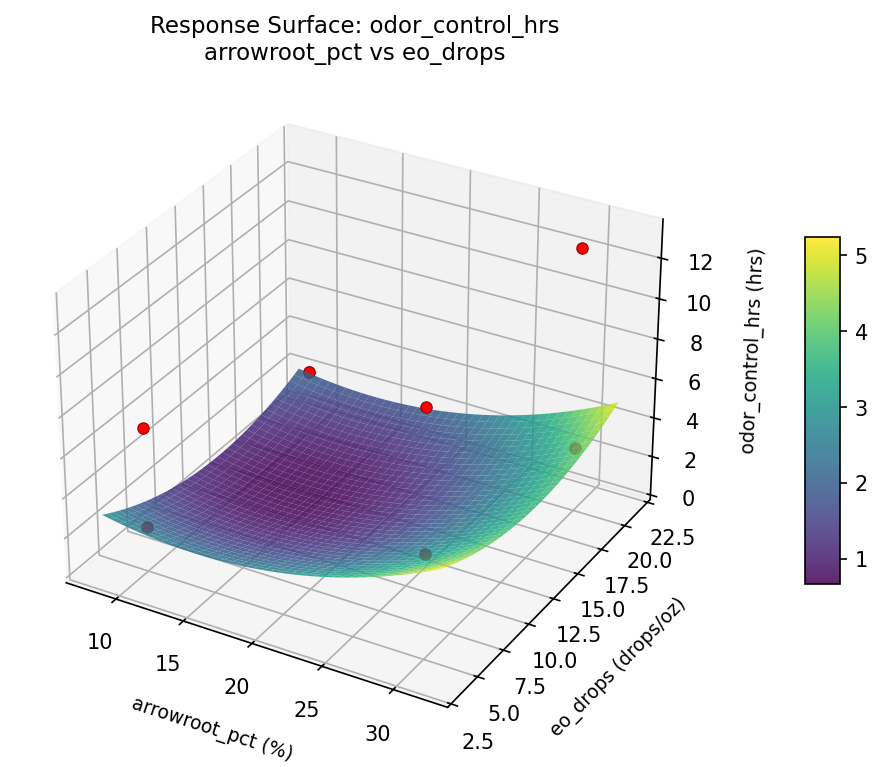
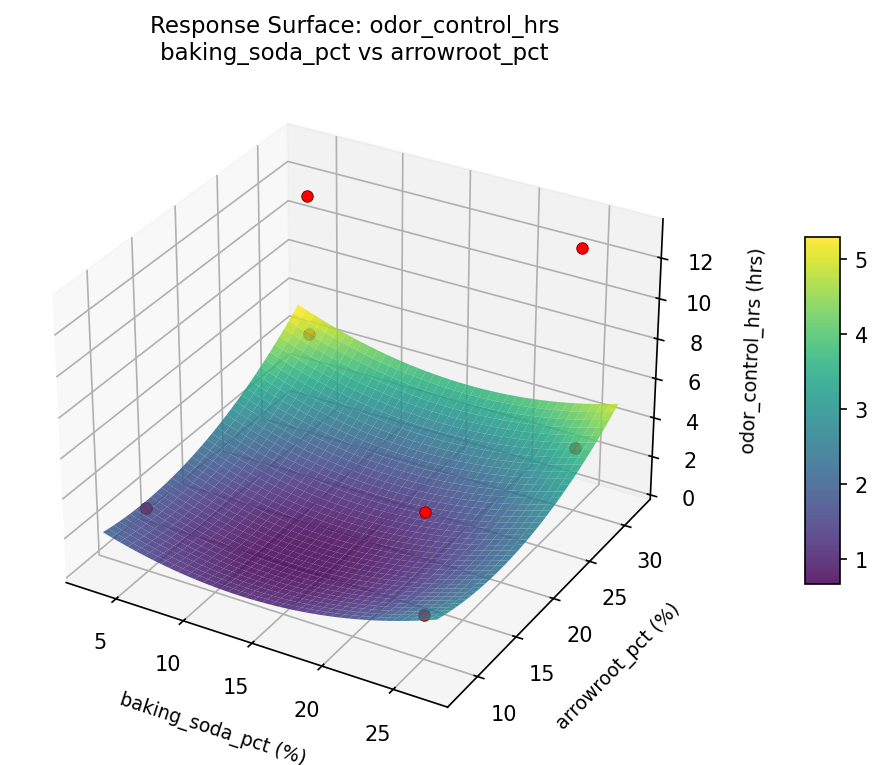
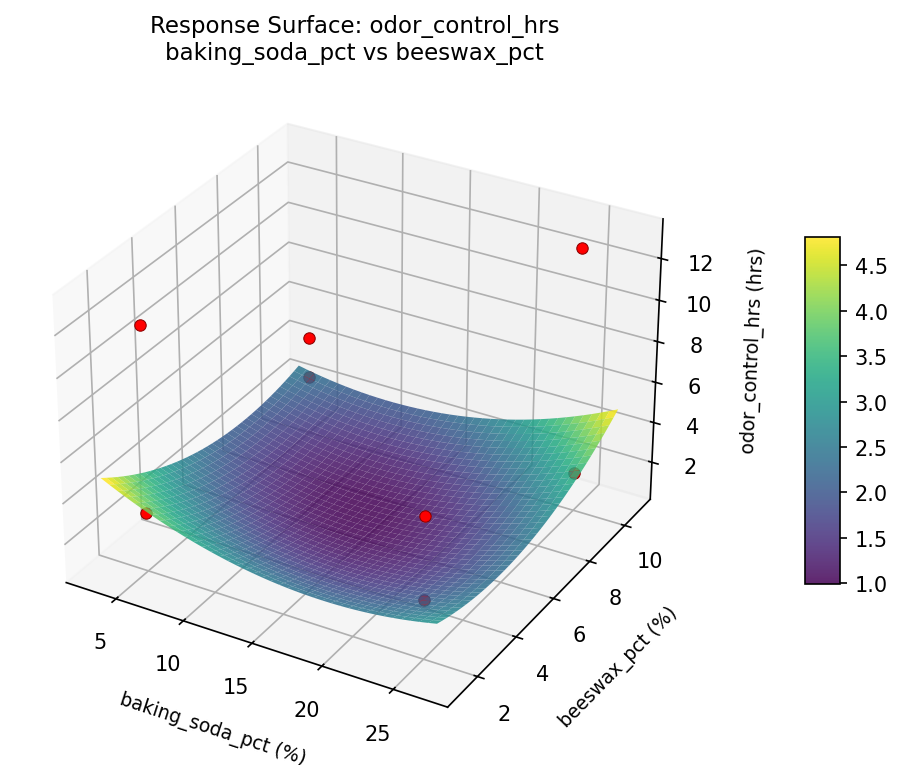
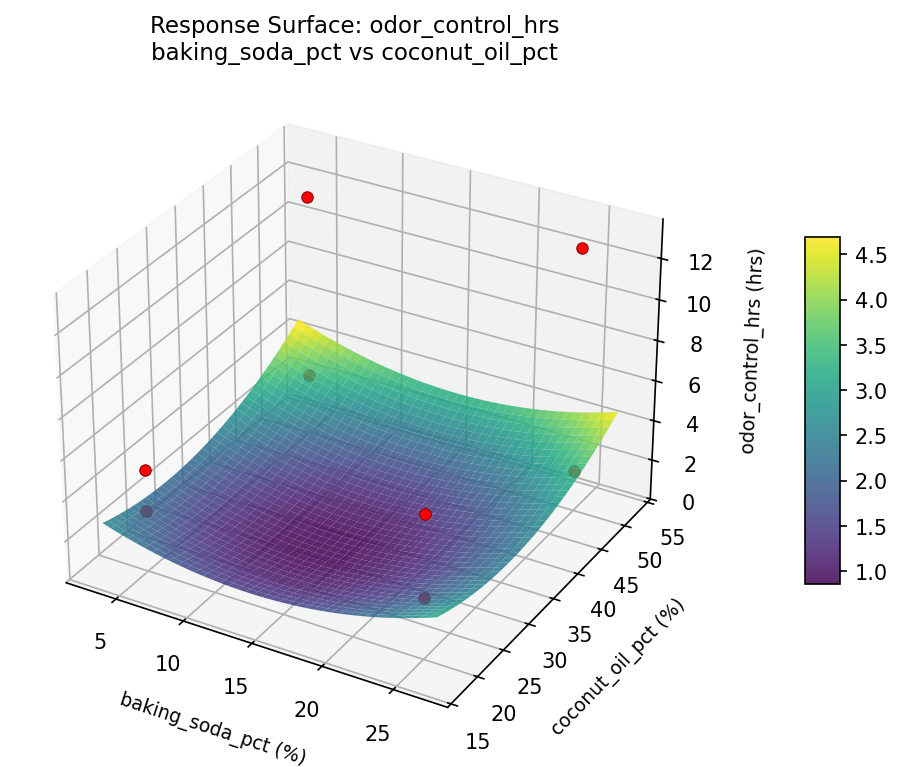
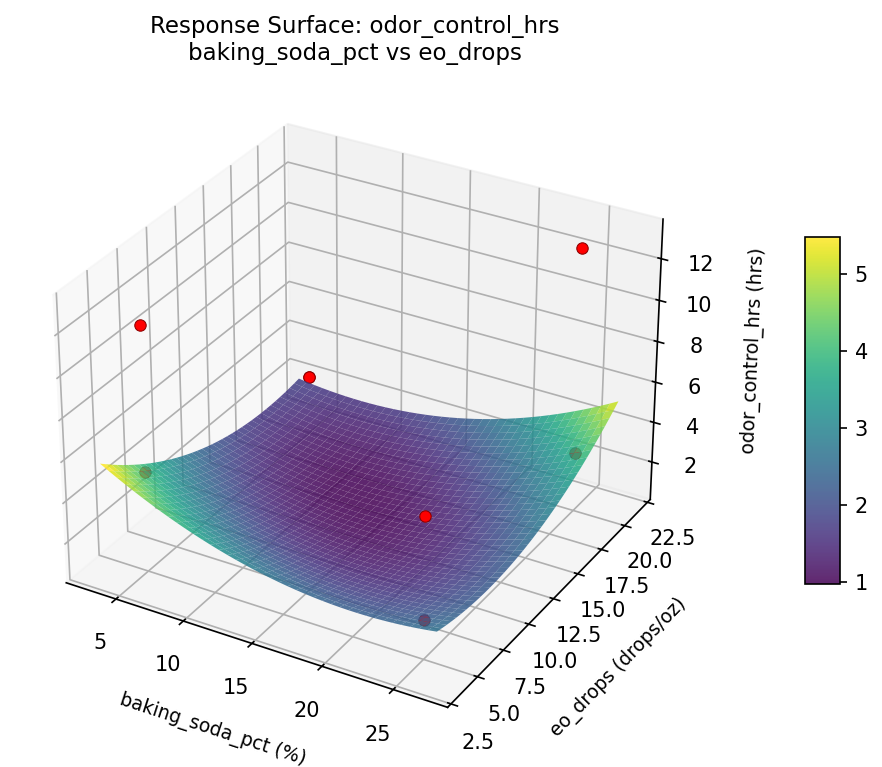
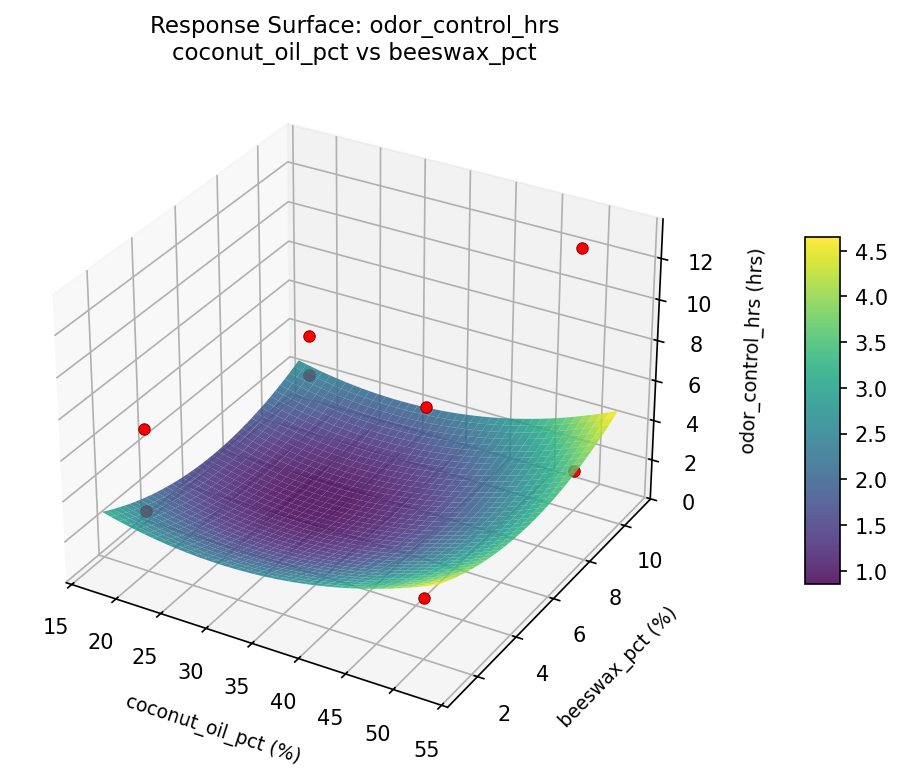
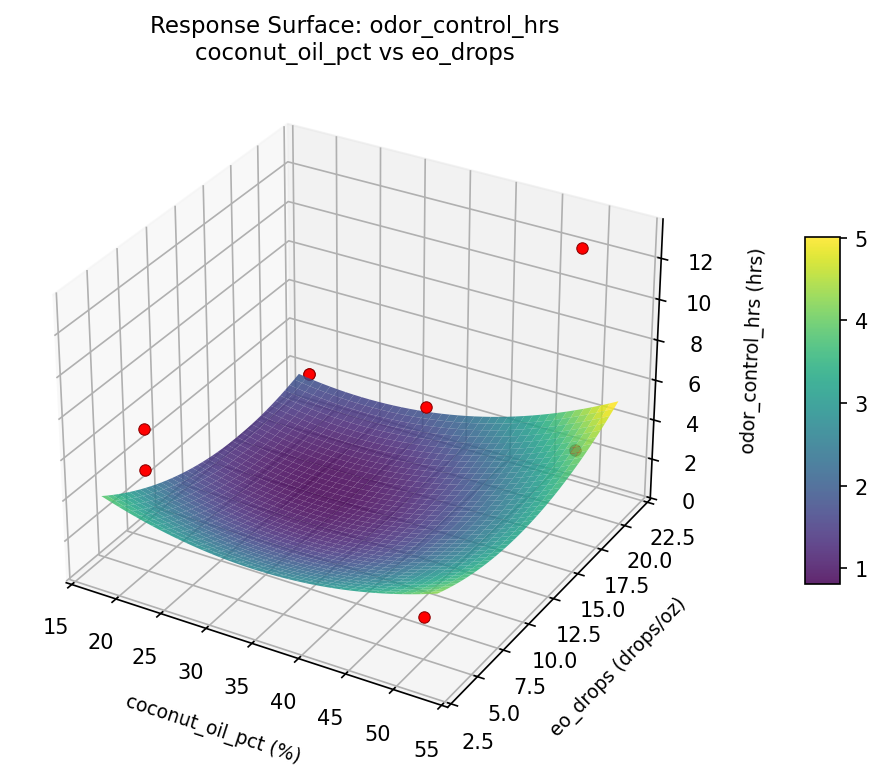
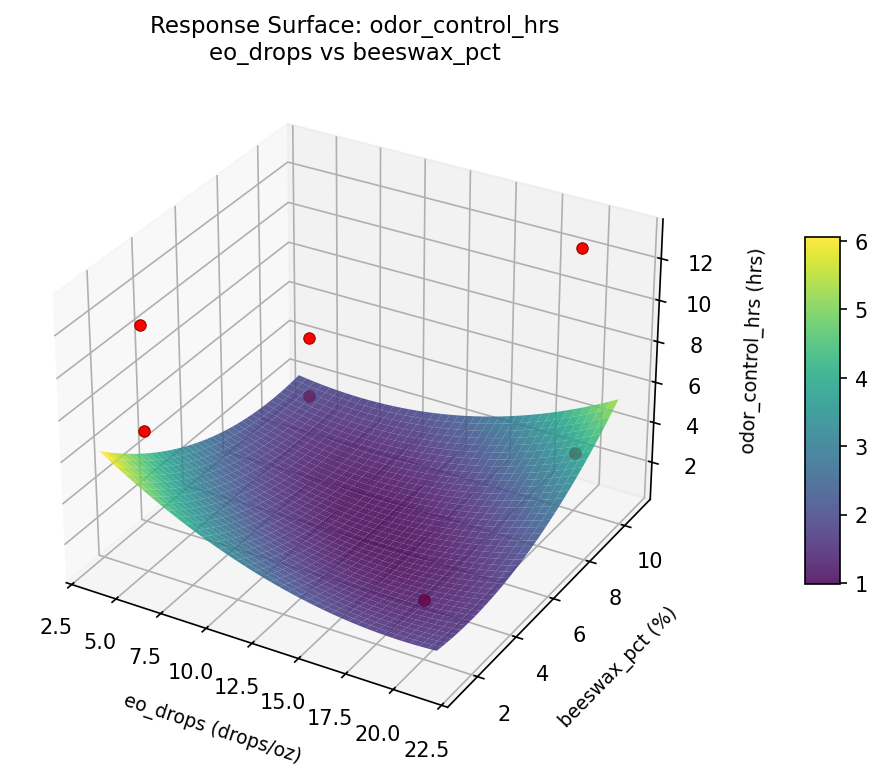
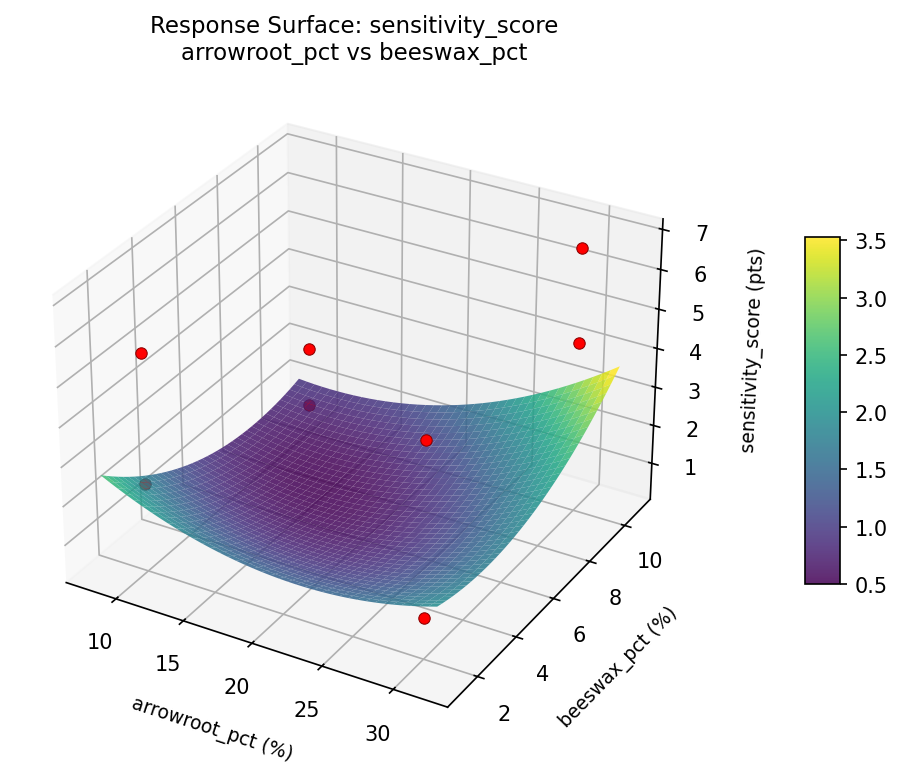
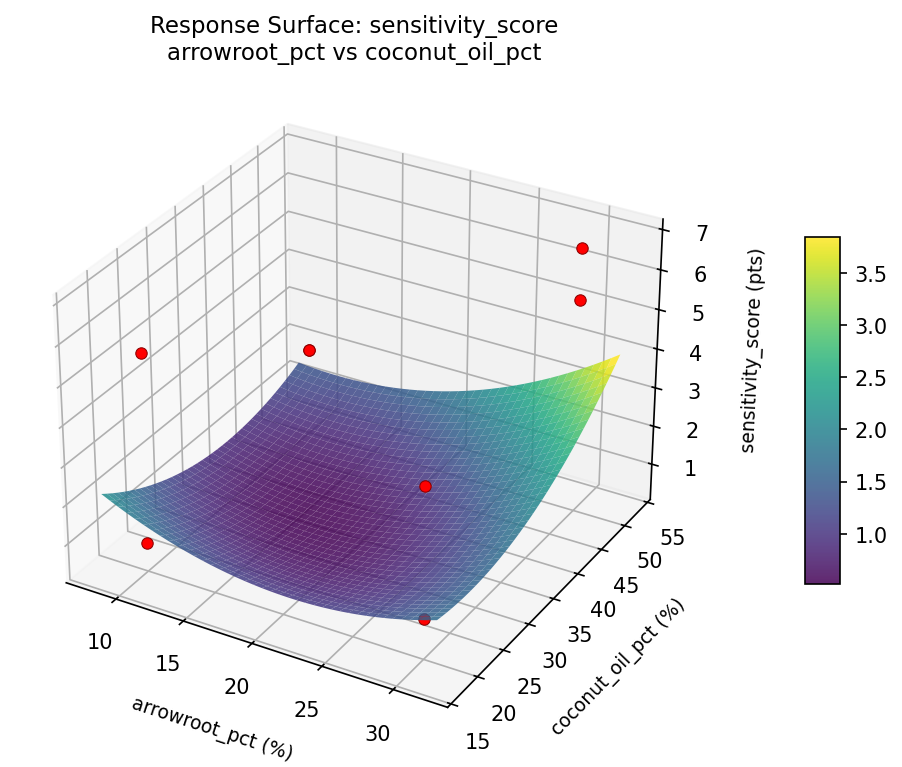
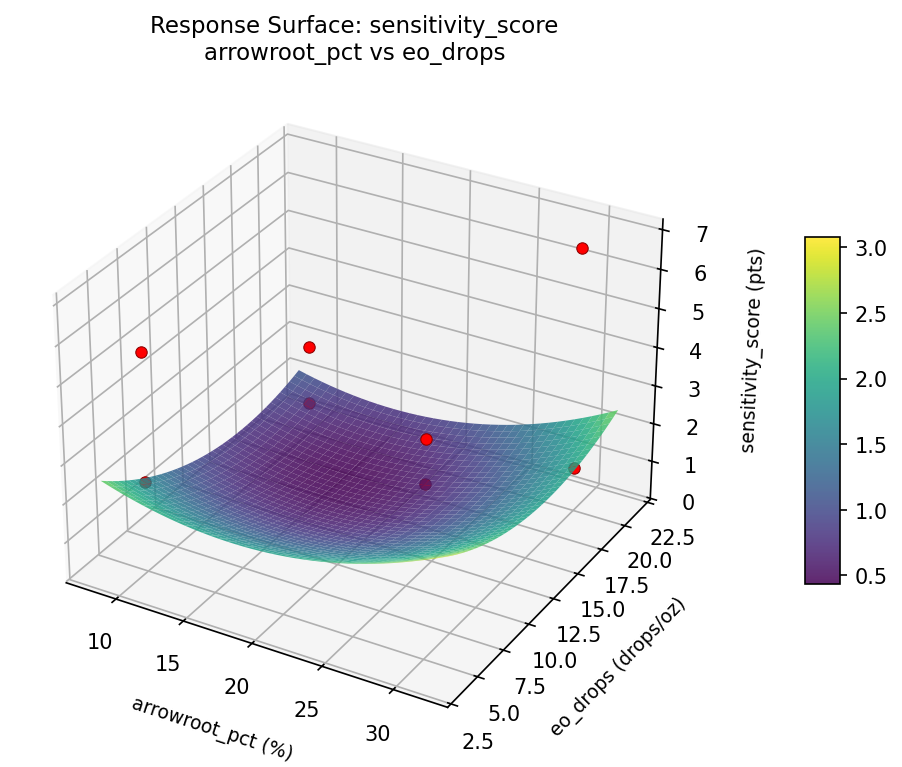
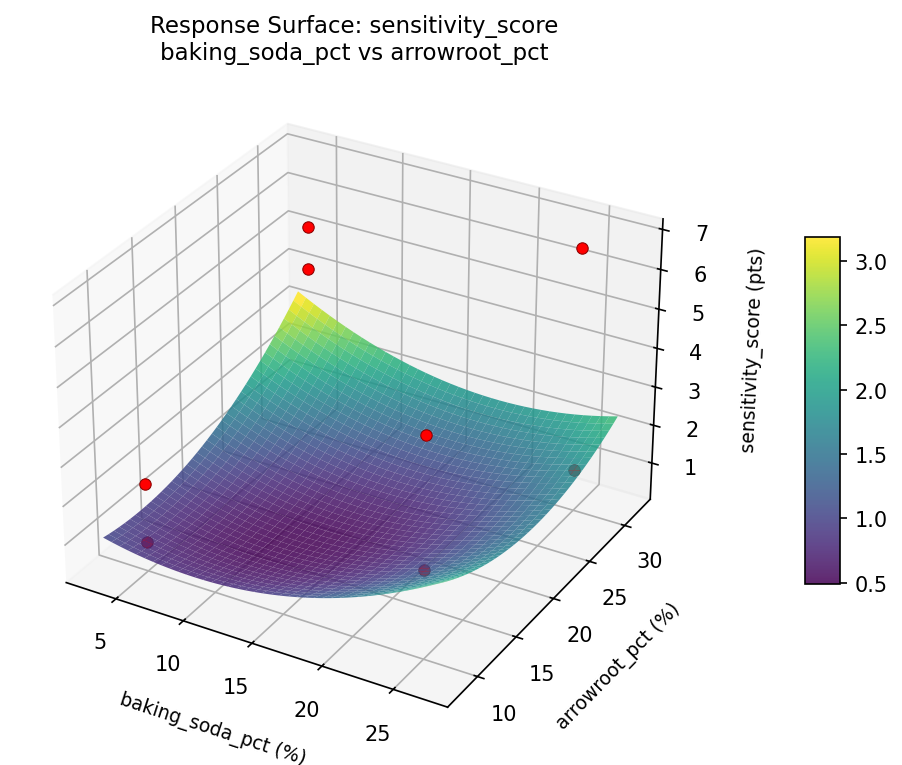
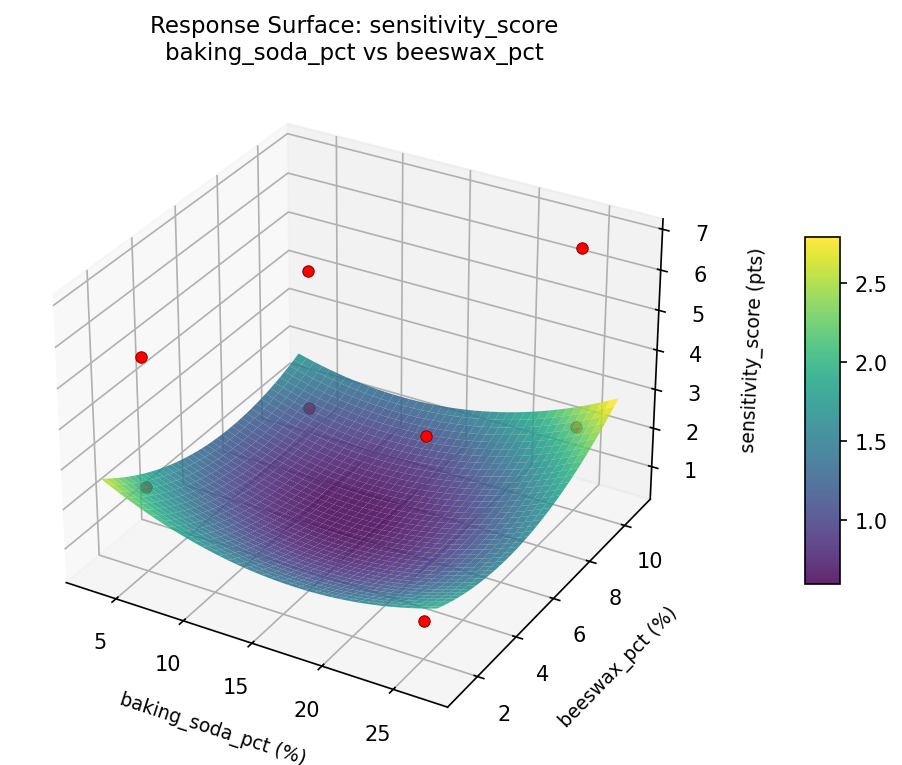
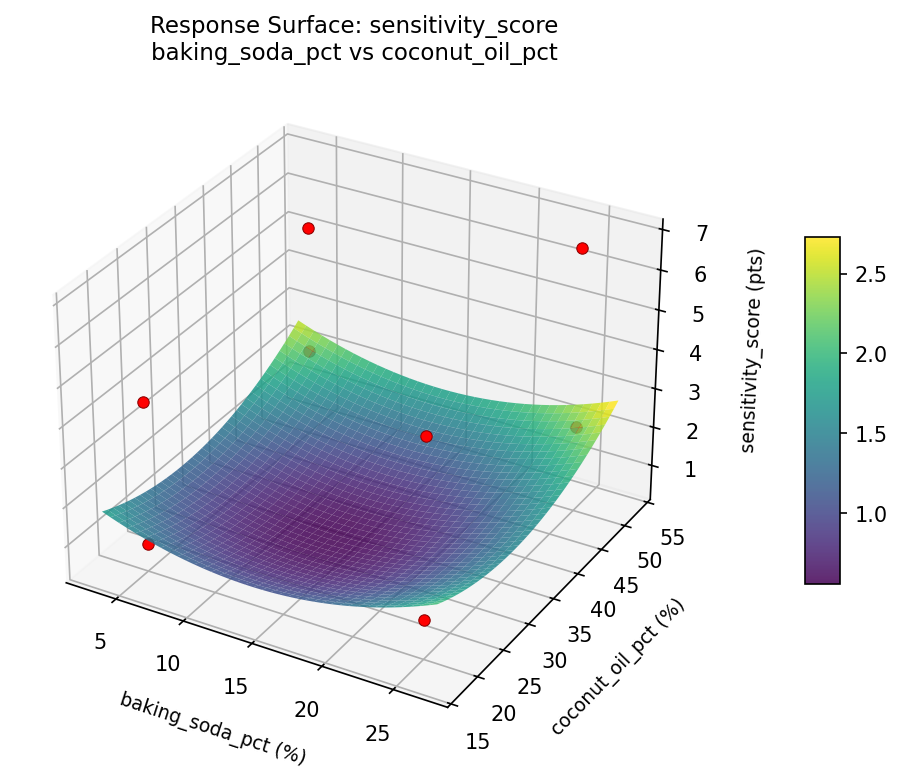
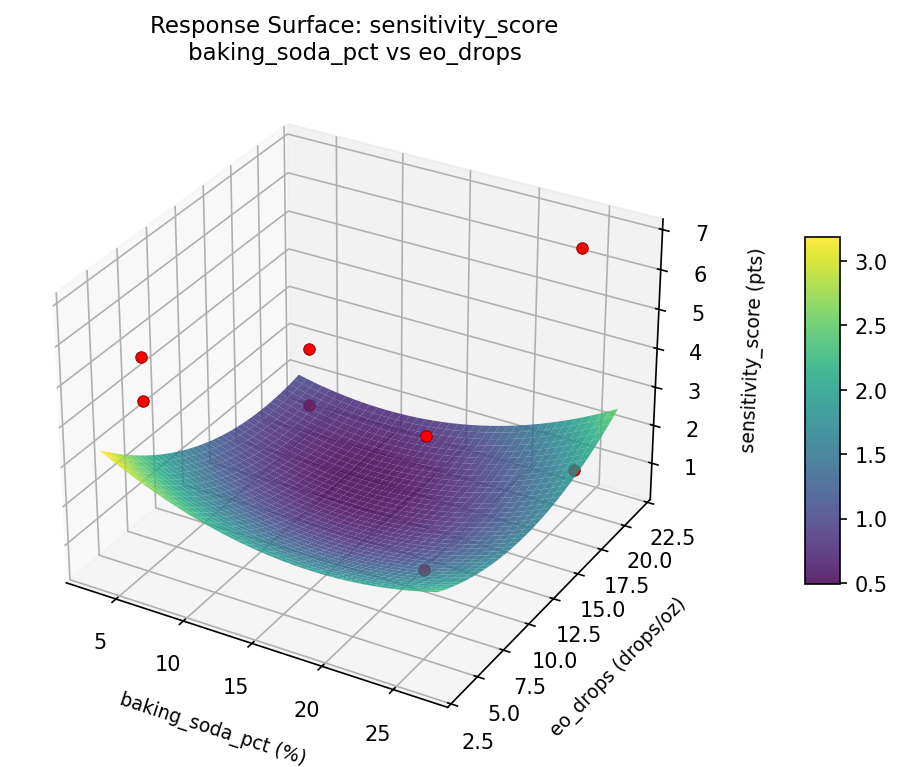
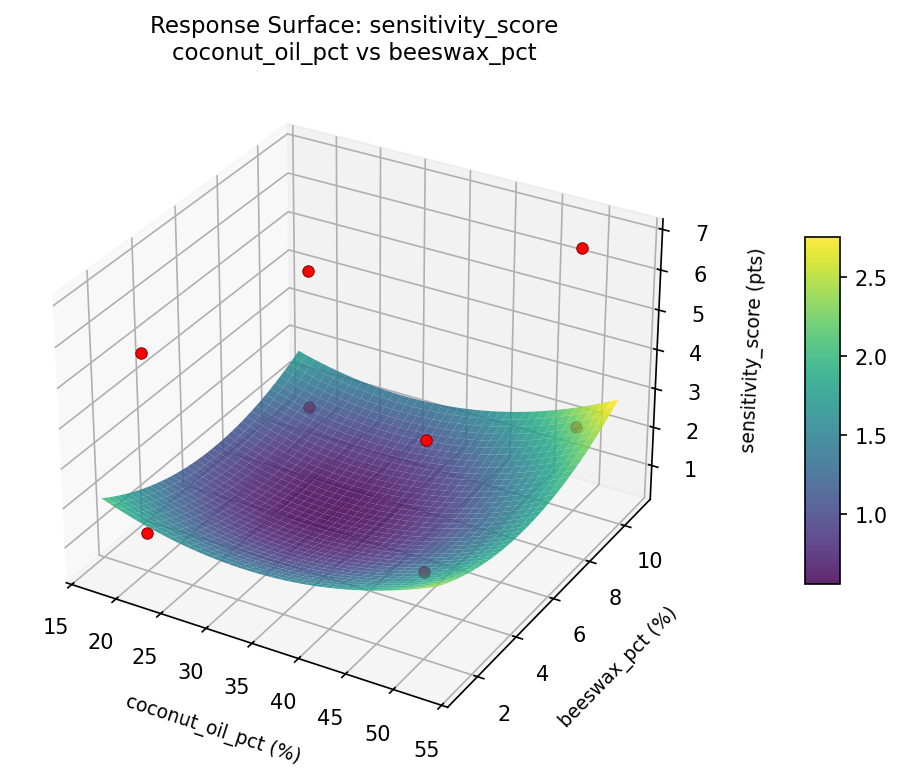
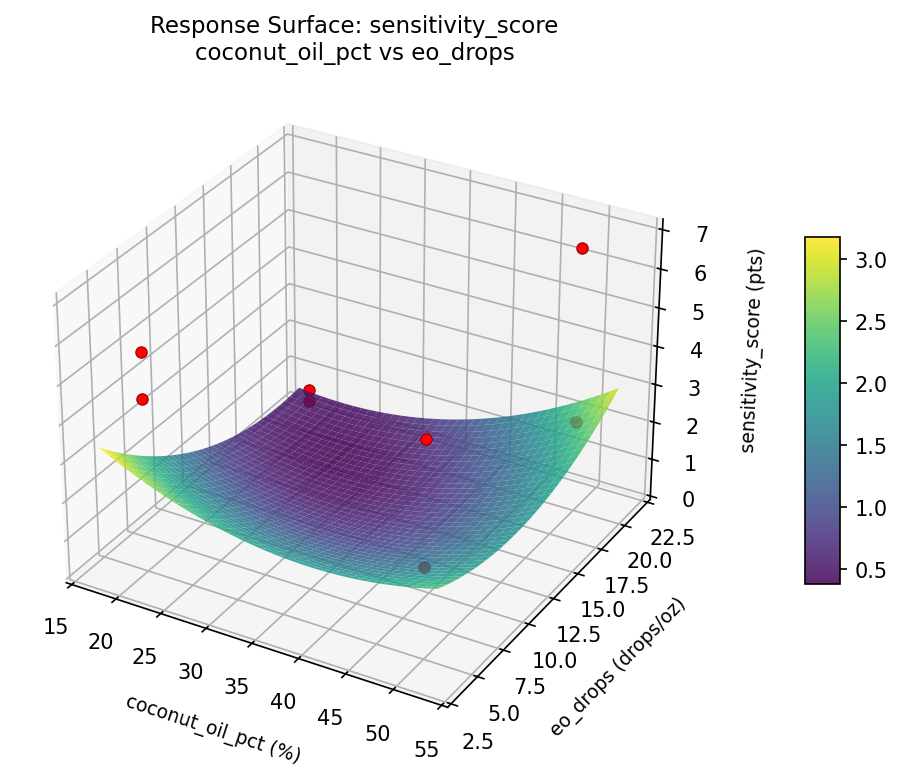
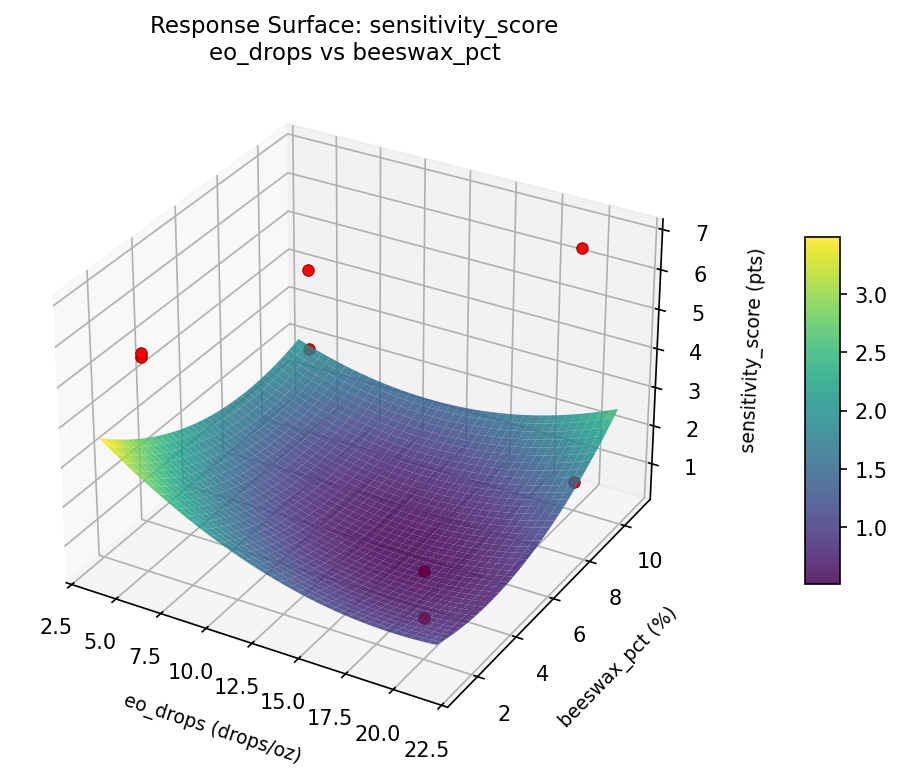
Response Surface Plots
3D surfaces fitted with quadratic RSM. Red dots are observed data points.
odor control hrs arrowroot pct vs beeswax pct
odor control hrs arrowroot pct vs coconut oil pct
odor control hrs arrowroot pct vs eo drops
odor control hrs baking soda pct vs arrowroot pct
odor control hrs baking soda pct vs beeswax pct
odor control hrs baking soda pct vs coconut oil pct
odor control hrs baking soda pct vs eo drops
odor control hrs coconut oil pct vs beeswax pct
odor control hrs coconut oil pct vs eo drops
odor control hrs eo drops vs beeswax pct
sensitivity score arrowroot pct vs beeswax pct
sensitivity score arrowroot pct vs coconut oil pct
sensitivity score arrowroot pct vs eo drops
sensitivity score baking soda pct vs arrowroot pct
sensitivity score baking soda pct vs beeswax pct
sensitivity score baking soda pct vs coconut oil pct
sensitivity score baking soda pct vs eo drops
sensitivity score coconut oil pct vs beeswax pct
sensitivity score coconut oil pct vs eo drops
sensitivity score eo drops vs beeswax pct
Multi-Objective Optimization
When responses compete, Derringer–Suich desirability finds the best compromise.
Each response is scaled to a 0–1 desirability, then combined via a weighted geometric mean.
Overall Desirability
D = 0.5654
Per-Response Desirability
| Response | Weight | Desirability | Predicted | Dir |
|---|
odor_control_hrs |
1.0 |
|
7.27 0.4807 7.27 hrs |
↑ |
sensitivity_score |
1.5 |
|
2.94 0.6300 2.94 pts |
↓ |
Recommended Settings
| Factor | Value |
|---|
baking_soda_pct | 9.796 % |
arrowroot_pct | 21.54 % |
coconut_oil_pct | 48.14 % |
eo_drops | 18.9 drops/oz |
beeswax_pct | 2.077 % |
Source: from RSM model prediction
Trade-off Summary
Sacrifice = how much worse than single-objective best.
| Response | Predicted | Best Observed | Sacrifice |
|---|
sensitivity_score | 2.94 | 0.80 | +2.14 |
Top 3 Runs by Desirability
| Run | D | Factor Settings |
|---|
| #1 | 0.4151 | baking_soda_pct=5, arrowroot_pct=30, coconut_oil_pct=50, eo_drops=5, beeswax_pct=2 |
| #3 | 0.4045 | baking_soda_pct=5, arrowroot_pct=10, coconut_oil_pct=50, eo_drops=20, beeswax_pct=2 |
Model Quality
| Response | R² | Type |
|---|
sensitivity_score | 0.8120 | linear |
Full Multi-Objective Output
============================================================
MULTI-OBJECTIVE OPTIMIZATION
Method: Derringer-Suich Desirability Function
============================================================
Overall desirability: D = 0.5654
Response Weight Desirability Predicted Direction
---------------------------------------------------------------------
odor_control_hrs 1.0 0.4807 7.27 hrs ↑
sensitivity_score 1.5 0.6300 2.94 pts ↓
Recommended settings:
baking_soda_pct = 9.796 %
arrowroot_pct = 21.54 %
coconut_oil_pct = 48.14 %
eo_drops = 18.9 drops/oz
beeswax_pct = 2.077 %
(from RSM model prediction)
Trade-off summary:
odor_control_hrs: 7.27 (best observed: 13.00, sacrifice: +5.73)
sensitivity_score: 2.94 (best observed: 0.80, sacrifice: +2.14)
Model quality:
odor_control_hrs: R² = 0.9808 (linear)
sensitivity_score: R² = 0.8120 (linear)
Top 3 observed runs by overall desirability:
1. Run #5 (D=0.4275): baking_soda_pct=25, arrowroot_pct=30, coconut_oil_pct=50, eo_drops=20, beeswax_pct=10
2. Run #1 (D=0.4151): baking_soda_pct=5, arrowroot_pct=30, coconut_oil_pct=50, eo_drops=5, beeswax_pct=2
3. Run #3 (D=0.4045): baking_soda_pct=5, arrowroot_pct=10, coconut_oil_pct=50, eo_drops=20, beeswax_pct=2
Full Analysis Output
=== Main Effects: odor_control_hrs ===
Factor Effect Std Error % Contribution
--------------------------------------------------------------
arrowroot_pct 5.5000 1.5236 33.3%
eo_drops -4.0000 1.5236 24.2%
baking_soda_pct -3.5000 1.5236 21.2%
beeswax_pct -2.0000 1.5236 12.1%
coconut_oil_pct -1.5000 1.5236 9.1%
=== ANOVA Table: odor_control_hrs ===
Source DF SS MS F p-value
-----------------------------------------------------------------------------
baking_soda_pct 1 24.5000 24.5000 3.630 0.1151
arrowroot_pct 1 60.5000 60.5000 8.963 0.0303
coconut_oil_pct 1 4.5000 4.5000 0.667 0.4513
eo_drops 1 32.0000 32.0000 4.741 0.0814
beeswax_pct 1 8.0000 8.0000 1.185 0.3260
baking_soda_pct*arrowroot_pct 1 32.0000 32.0000 4.741 0.0814
baking_soda_pct*coconut_oil_pct 1 8.0000 8.0000 1.185 0.3260
baking_soda_pct*eo_drops 1 60.5000 60.5000 8.963 0.0303
baking_soda_pct*beeswax_pct 1 4.5000 4.5000 0.667 0.4513
arrowroot_pct*coconut_oil_pct 1 0.0000 0.0000 0.000 1.0000
arrowroot_pct*eo_drops 1 24.5000 24.5000 3.630 0.1151
arrowroot_pct*beeswax_pct 1 0.5000 0.5000 0.074 0.7964
coconut_oil_pct*eo_drops 1 0.5000 0.5000 0.074 0.7964
coconut_oil_pct*beeswax_pct 1 24.5000 24.5000 3.630 0.1151
eo_drops*beeswax_pct 1 0.0000 0.0000 0.000 1.0000
Error (Lenth PSE) 5 33.7500 6.7500
Total 7 130.0000 18.5714
Note: Error estimated using Lenth's pseudo-standard-error (unreplicated design)
=== Interaction Effects: odor_control_hrs ===
Factor A Factor B Interaction % Contribution
------------------------------------------------------------------------
baking_soda_pct eo_drops 5.5000 26.2%
baking_soda_pct arrowroot_pct -4.0000 19.0%
arrowroot_pct eo_drops -3.5000 16.7%
coconut_oil_pct beeswax_pct -3.5000 16.7%
baking_soda_pct coconut_oil_pct -2.0000 9.5%
baking_soda_pct beeswax_pct -1.5000 7.1%
arrowroot_pct beeswax_pct -0.5000 2.4%
coconut_oil_pct eo_drops -0.5000 2.4%
arrowroot_pct coconut_oil_pct 0.0000 0.0%
eo_drops beeswax_pct 0.0000 0.0%
=== Summary Statistics: odor_control_hrs ===
baking_soda_pct:
Level N Mean Std Min Max
------------------------------------------------------------
25 4 7.7500 5.5000 3.0000 13.0000
5 4 4.2500 2.2174 2.0000 7.0000
arrowroot_pct:
Level N Mean Std Min Max
------------------------------------------------------------
10 4 3.2500 1.2583 2.0000 5.0000
30 4 8.7500 4.6458 3.0000 13.0000
coconut_oil_pct:
Level N Mean Std Min Max
------------------------------------------------------------
20 4 6.7500 3.8622 3.0000 12.0000
50 4 5.2500 5.1881 2.0000 13.0000
eo_drops:
Level N Mean Std Min Max
------------------------------------------------------------
20 4 8.0000 5.3541 2.0000 13.0000
5 4 4.0000 2.0000 3.0000 7.0000
beeswax_pct:
Level N Mean Std Min Max
------------------------------------------------------------
10 4 7.0000 4.3205 3.0000 13.0000
2 4 5.0000 4.6904 2.0000 12.0000
=== Main Effects: sensitivity_score ===
Factor Effect Std Error % Contribution
--------------------------------------------------------------
eo_drops -2.3000 0.8013 27.4%
arrowroot_pct 2.3000 0.8013 27.4%
coconut_oil_pct -1.7000 0.8013 20.2%
beeswax_pct -1.6000 0.8013 19.0%
baking_soda_pct -0.5000 0.8013 6.0%
=== ANOVA Table: sensitivity_score ===
Source DF SS MS F p-value
-----------------------------------------------------------------------------
baking_soda_pct 1 0.5000 0.5000 0.065 0.8088
arrowroot_pct 1 10.5800 10.5800 1.378 0.2934
coconut_oil_pct 1 5.7800 5.7800 0.753 0.4253
eo_drops 1 10.5800 10.5800 1.378 0.2934
beeswax_pct 1 5.1200 5.1200 0.667 0.4513
baking_soda_pct*arrowroot_pct 1 10.5800 10.5800 1.378 0.2934
baking_soda_pct*coconut_oil_pct 1 5.1200 5.1200 0.667 0.4513
baking_soda_pct*eo_drops 1 10.5800 10.5800 1.378 0.2934
baking_soda_pct*beeswax_pct 1 5.7800 5.7800 0.753 0.4253
arrowroot_pct*coconut_oil_pct 1 0.0200 0.0200 0.003 0.9613
arrowroot_pct*eo_drops 1 0.5000 0.5000 0.065 0.8088
arrowroot_pct*beeswax_pct 1 3.3800 3.3800 0.440 0.5364
coconut_oil_pct*eo_drops 1 3.3800 3.3800 0.440 0.5364
coconut_oil_pct*beeswax_pct 1 0.5000 0.5000 0.065 0.8088
eo_drops*beeswax_pct 1 0.0200 0.0200 0.003 0.9613
Error (Lenth PSE) 5 38.4000 7.6800
Total 7 35.9600 5.1371
Note: Error estimated using Lenth's pseudo-standard-error (unreplicated design)
=== Interaction Effects: sensitivity_score ===
Factor A Factor B Interaction % Contribution
------------------------------------------------------------------------
baking_soda_pct arrowroot_pct -2.3000 19.7%
baking_soda_pct eo_drops 2.3000 19.7%
baking_soda_pct beeswax_pct -1.7000 14.5%
baking_soda_pct coconut_oil_pct -1.6000 13.7%
arrowroot_pct beeswax_pct -1.3000 11.1%
coconut_oil_pct eo_drops -1.3000 11.1%
arrowroot_pct eo_drops -0.5000 4.3%
coconut_oil_pct beeswax_pct -0.5000 4.3%
arrowroot_pct coconut_oil_pct 0.1000 0.9%
eo_drops beeswax_pct 0.1000 0.9%
=== Summary Statistics: sensitivity_score ===
baking_soda_pct:
Level N Mean Std Min Max
------------------------------------------------------------
25 4 3.8500 2.7767 0.8000 6.8000
5 4 3.3500 2.0273 1.1000 5.6000
arrowroot_pct:
Level N Mean Std Min Max
------------------------------------------------------------
10 4 2.4500 1.4799 0.8000 4.4000
30 4 4.7500 2.5040 1.1000 6.8000
coconut_oil_pct:
Level N Mean Std Min Max
------------------------------------------------------------
20 4 4.4500 1.5330 2.3000 5.6000
50 4 2.7500 2.7767 0.8000 6.8000
eo_drops:
Level N Mean Std Min Max
------------------------------------------------------------
20 4 4.7500 1.9053 2.3000 6.8000
5 4 2.4500 2.1977 0.8000 5.6000
beeswax_pct:
Level N Mean Std Min Max
------------------------------------------------------------
10 4 4.4000 2.5923 0.8000 6.8000
2 4 2.8000 1.8868 1.1000 5.5000
Optimization Recommendations
=== Optimization: odor_control_hrs ===
Direction: maximize
Best observed run: #4
baking_soda_pct = 5
arrowroot_pct = 30
coconut_oil_pct = 50
eo_drops = 5
beeswax_pct = 2
Value: 13.0
RSM Model (linear, R² = 0.9962, Adj R² = 0.9865):
Coefficients:
intercept +6.0000
baking_soda_pct -1.7500
arrowroot_pct -0.7500
coconut_oil_pct +2.7500
eo_drops -1.0000
beeswax_pct -2.0000
Predicted optimum (from linear model, at observed points):
baking_soda_pct = 5
arrowroot_pct = 30
coconut_oil_pct = 50
eo_drops = 5
beeswax_pct = 2
Predicted value: 12.7500
Surface optimum (via L-BFGS-B, linear model):
baking_soda_pct = 5
arrowroot_pct = 10
coconut_oil_pct = 50
eo_drops = 5
beeswax_pct = 2
Predicted value: 14.2500
Model quality: Excellent fit — surface predictions are reliable.
Factor importance:
1. coconut_oil_pct (effect: 5.5, contribution: 33.3%)
2. beeswax_pct (effect: 4.0, contribution: 24.2%)
3. baking_soda_pct (effect: 3.5, contribution: 21.2%)
4. eo_drops (effect: 2.0, contribution: 12.1%)
5. arrowroot_pct (effect: -1.5, contribution: 9.1%)
=== Optimization: sensitivity_score ===
Direction: minimize
Best observed run: #5
baking_soda_pct = 25
arrowroot_pct = 30
coconut_oil_pct = 50
eo_drops = 20
beeswax_pct = 10
Value: 0.8
RSM Model (linear, R² = 0.9059, Adj R² = 0.6705):
Coefficients:
intercept +3.6000
baking_soda_pct -0.3250
arrowroot_pct -0.8500
coconut_oil_pct +1.0750
eo_drops -0.8750
beeswax_pct -1.1500
Predicted optimum (from linear model, at observed points):
baking_soda_pct = 5
arrowroot_pct = 30
coconut_oil_pct = 50
eo_drops = 5
beeswax_pct = 2
Predicted value: 6.1750
Surface optimum (via L-BFGS-B, linear model):
baking_soda_pct = 25
arrowroot_pct = 30
coconut_oil_pct = 20
eo_drops = 20
beeswax_pct = 10
Predicted value: -0.6750
Model quality: Excellent fit — surface predictions are reliable.
Factor importance:
1. beeswax_pct (effect: 2.3, contribution: 26.9%)
2. coconut_oil_pct (effect: 2.1, contribution: 25.1%)
3. eo_drops (effect: 1.7, contribution: 20.5%)
4. arrowroot_pct (effect: -1.7, contribution: 19.9%)
5. baking_soda_pct (effect: 0.6, contribution: 7.6%)