Summary
This experiment investigates printmaking ink viscosity. Plackett-Burman screening of ink tack, oil percentage, pigment load, modifier amount, and roller pressure for print quality and ink transfer.
The design varies 5 factors: tack level (level), ranging from 2 to 8, oil pct (%), ranging from 20 to 50, pigment pct (%), ranging from 15 to 35, modifier pct (%), ranging from 0 to 10, and roller pressure (level), ranging from 1 to 5. The goal is to optimize 2 responses: print quality (pts) (maximize) and transfer pct (%) (maximize). Fixed conditions held constant across all runs include method = relief, paper = BFK_rives.
A Plackett-Burman screening design was used to efficiently test 5 factors in only 8 runs. This design assumes interactions are negligible and focuses on identifying the most influential main effects.
Key Findings
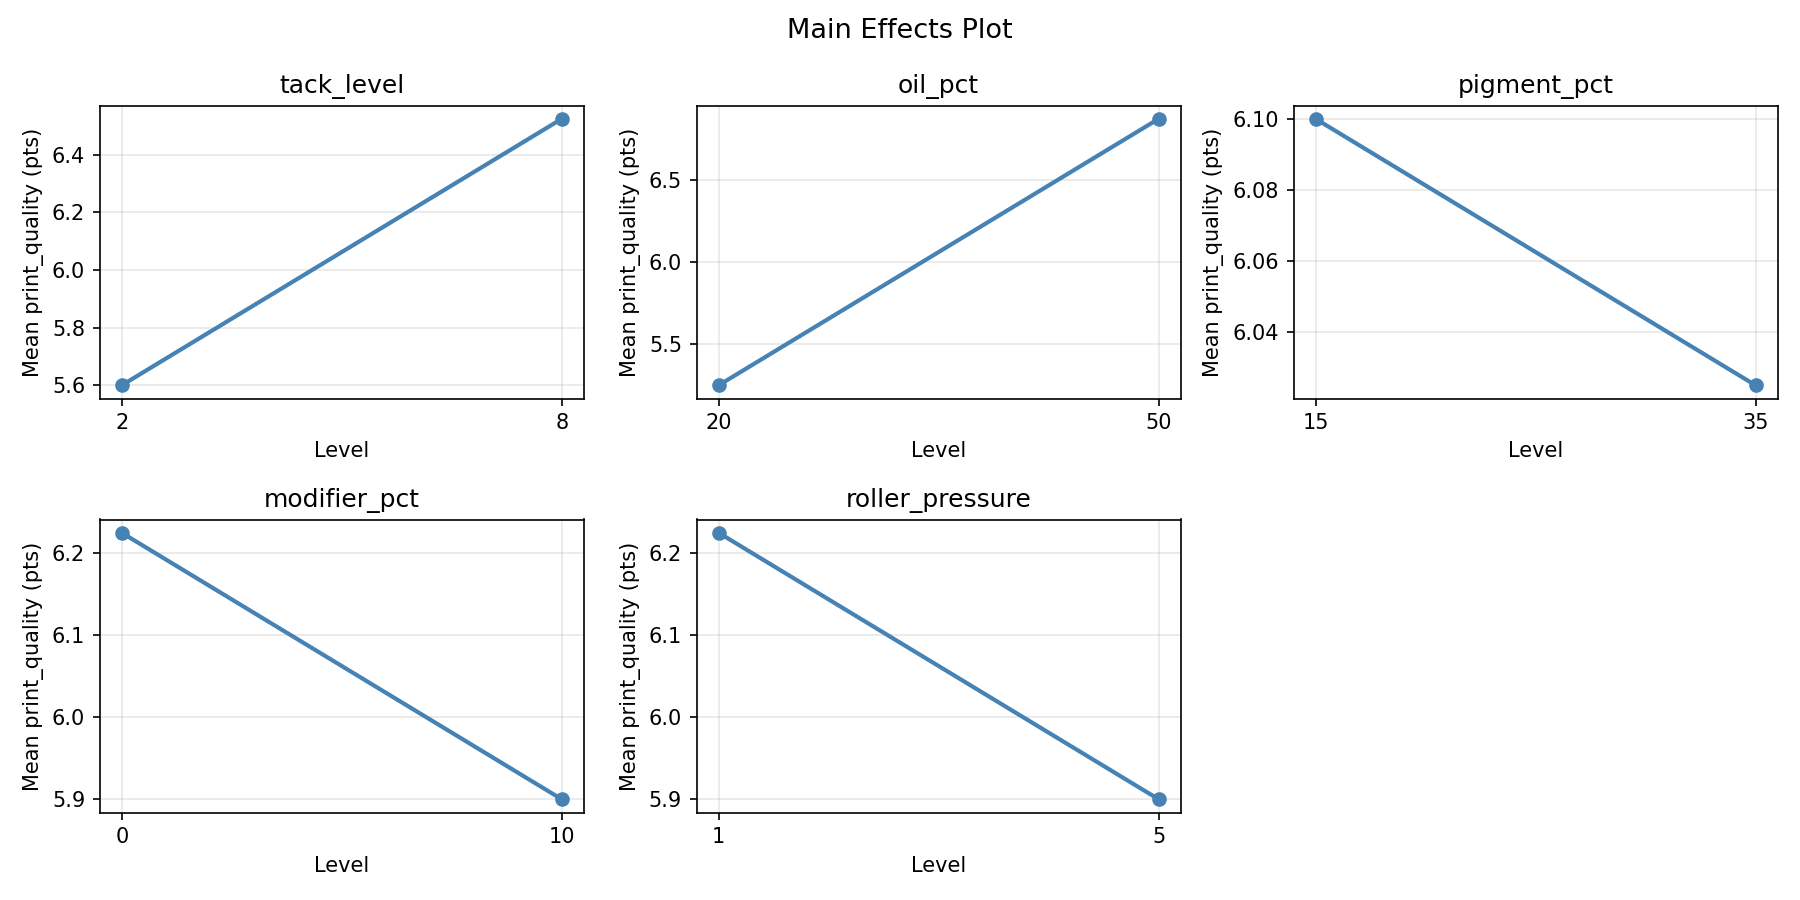
For print quality, the most influential factors were modifier pct (25.2%), oil pct (23.8%), roller pressure (23.8%). The best observed value was 7.6 (at tack level = 2, oil pct = 20, pigment pct = 35).
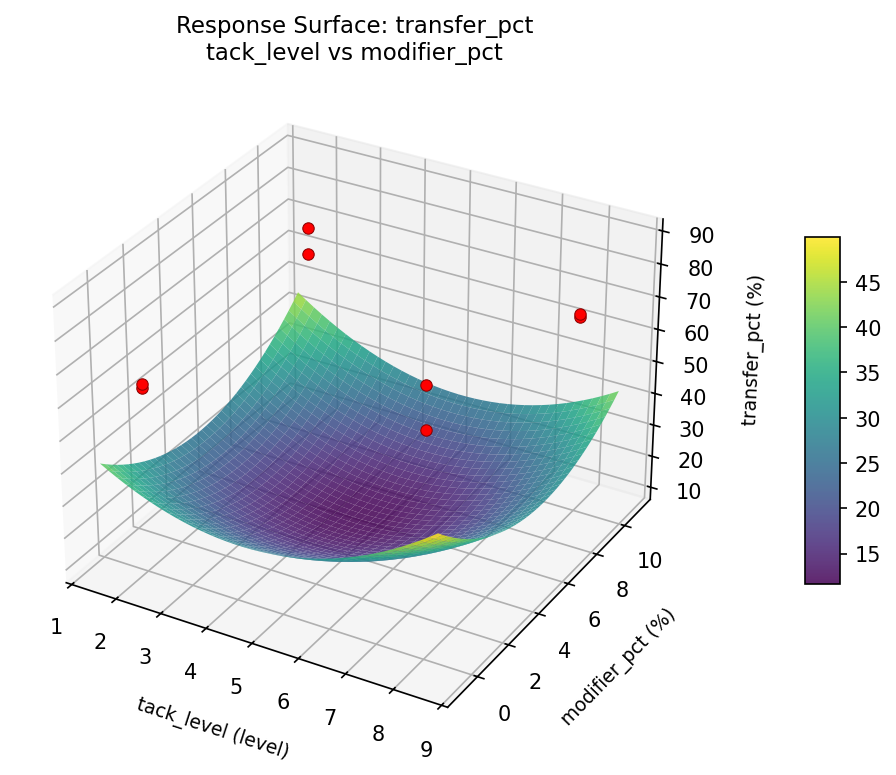
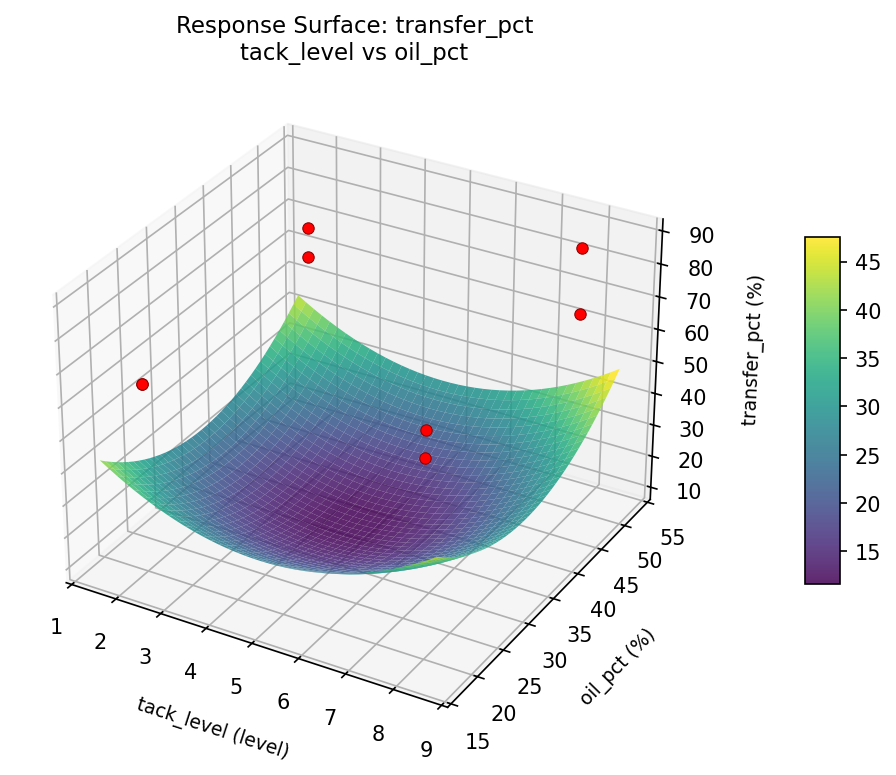
For transfer pct, the most influential factors were modifier pct (36.1%), roller pressure (24.4%), pigment pct (19.3%). The best observed value was 88.0 (at tack level = 2, oil pct = 20, pigment pct = 35).
Recommended Next Steps
- Follow up with a response surface design (CCD or Box-Behnken) on the top 3–4 factors to model curvature and find the true optimum.
- Consider whether any fixed factors should be varied in a future study.
- The screening results can guide factor reduction — drop factors contributing less than 5% and re-run with a smaller, more focused design.
Experimental Setup
Factors
| Factor | Low | High | Unit |
|---|
tack_level | 2 | 8 | level |
oil_pct | 20 | 50 | % |
pigment_pct | 15 | 35 | % |
modifier_pct | 0 | 10 | % |
roller_pressure | 1 | 5 | level |
Fixed: method = relief, paper = BFK_rives
Responses
| Response | Direction | Unit |
|---|
print_quality | ↑ maximize | pts |
transfer_pct | ↑ maximize | % |
Configuration
{
"metadata": {
"name": "Printmaking Ink Viscosity",
"description": "Plackett-Burman screening of ink tack, oil percentage, pigment load, modifier amount, and roller pressure for print quality and ink transfer"
},
"factors": [
{
"name": "tack_level",
"levels": [
"2",
"8"
],
"type": "continuous",
"unit": "level"
},
{
"name": "oil_pct",
"levels": [
"20",
"50"
],
"type": "continuous",
"unit": "%"
},
{
"name": "pigment_pct",
"levels": [
"15",
"35"
],
"type": "continuous",
"unit": "%"
},
{
"name": "modifier_pct",
"levels": [
"0",
"10"
],
"type": "continuous",
"unit": "%"
},
{
"name": "roller_pressure",
"levels": [
"1",
"5"
],
"type": "continuous",
"unit": "level"
}
],
"fixed_factors": {
"method": "relief",
"paper": "BFK_rives"
},
"responses": [
{
"name": "print_quality",
"optimize": "maximize",
"unit": "pts"
},
{
"name": "transfer_pct",
"optimize": "maximize",
"unit": "%"
}
],
"settings": {
"operation": "plackett_burman",
"test_script": "use_cases/288_printmaking_ink/sim.sh"
}
}
Experimental Matrix
The Plackett-Burman Design produces 8 runs. Each row is one experiment with specific factor settings.
| Run | tack_level | oil_pct | pigment_pct | modifier_pct | roller_pressure |
|---|
| 1 | 8 | 50 | 35 | 0 | 1 |
| 2 | 2 | 20 | 35 | 10 | 1 |
| 3 | 2 | 50 | 15 | 10 | 1 |
| 4 | 8 | 50 | 35 | 10 | 5 |
| 5 | 2 | 50 | 15 | 0 | 5 |
| 6 | 8 | 20 | 15 | 10 | 5 |
| 7 | 2 | 20 | 35 | 0 | 5 |
| 8 | 8 | 20 | 15 | 0 | 1 |
Step-by-Step Workflow
1
Preview the design
$ doe info --config use_cases/288_printmaking_ink/config.json
2
Generate the runner script
$ doe generate --config use_cases/288_printmaking_ink/config.json \
--output use_cases/288_printmaking_ink/results/run.sh --seed 42
3
Execute the experiments
$ bash use_cases/288_printmaking_ink/results/run.sh
4
Analyze results
$ doe analyze --config use_cases/288_printmaking_ink/config.json
5
Get optimization recommendations
$ doe optimize --config use_cases/288_printmaking_ink/config.json
6
Multi-objective optimization
With 2 competing responses, use --multi to find the best compromise via Derringer–Suich desirability.
$ doe optimize --config use_cases/288_printmaking_ink/config.json --multi
7
Generate the HTML report
$ doe report --config use_cases/288_printmaking_ink/config.json \
--output use_cases/288_printmaking_ink/results/report.html
Features Exercised
| Feature | Value |
|---|
| Design type | plackett_burman |
| Factor types | continuous (all 5) |
| Arg style | double-dash |
| Responses | 2 (print_quality ↑, transfer_pct ↑) |
| Total runs | 8 |
Analysis Results
Generated from actual experiment runs using the DOE Helper Tool.
Response: print_quality
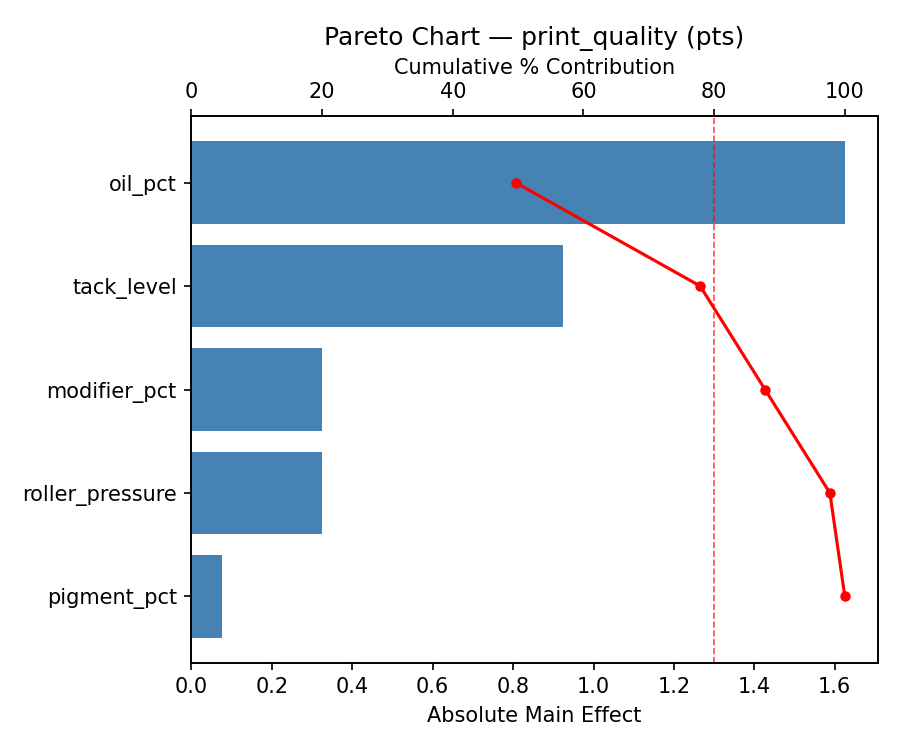
Top factors: modifier_pct (25.2%), oil_pct (23.8%), roller_pressure (23.8%).
ANOVA
| Source | DF | SS | MS | F | p-value |
|---|
| Source | DF | SS | MS | F | p-value |
| tack_level | 1 | 0.1012 | 0.1012 | 0.050 | 0.8326 |
| oil_pct | 1 | 1.5312 | 1.5312 | 0.750 | 0.4261 |
| pigment_pct | 1 | 1.2013 | 1.2013 | 0.588 | 0.4777 |
| modifier_pct | 1 | 1.7113 | 1.7113 | 0.838 | 0.4019 |
| roller_pressure | 1 | 1.5312 | 1.5312 | 0.750 | 0.4261 |
| tack_level*oil_pct | 1 | 1.2013 | 1.2013 | 0.588 | 0.4777 |
| tack_level*pigment_pct | 1 | 1.5312 | 1.5312 | 0.750 | 0.4261 |
| tack_level*modifier_pct | 1 | 1.5312 | 1.5312 | 0.750 | 0.4261 |
| tack_level*roller_pressure | 1 | 1.7112 | 1.7112 | 0.838 | 0.4019 |
| oil_pct*pigment_pct | 1 | 0.1012 | 0.1012 | 0.050 | 0.8326 |
| oil_pct*modifier_pct | 1 | 1.3612 | 1.3612 | 0.667 | 0.4513 |
| oil_pct*roller_pressure | 1 | 1.2012 | 1.2012 | 0.588 | 0.4777 |
| pigment_pct*modifier_pct | 1 | 1.2012 | 1.2012 | 0.588 | 0.4777 |
| pigment_pct*roller_pressure | 1 | 1.3612 | 1.3612 | 0.667 | 0.4513 |
| modifier_pct*roller_pressure | 1 | 0.1012 | 0.1012 | 0.050 | 0.8326 |
| Error | (Lenth | PSE) | 5 | 10.2094 | 2.0419 |
| Total | 7 | 8.6387 | 1.2341 | | |
Pareto Chart
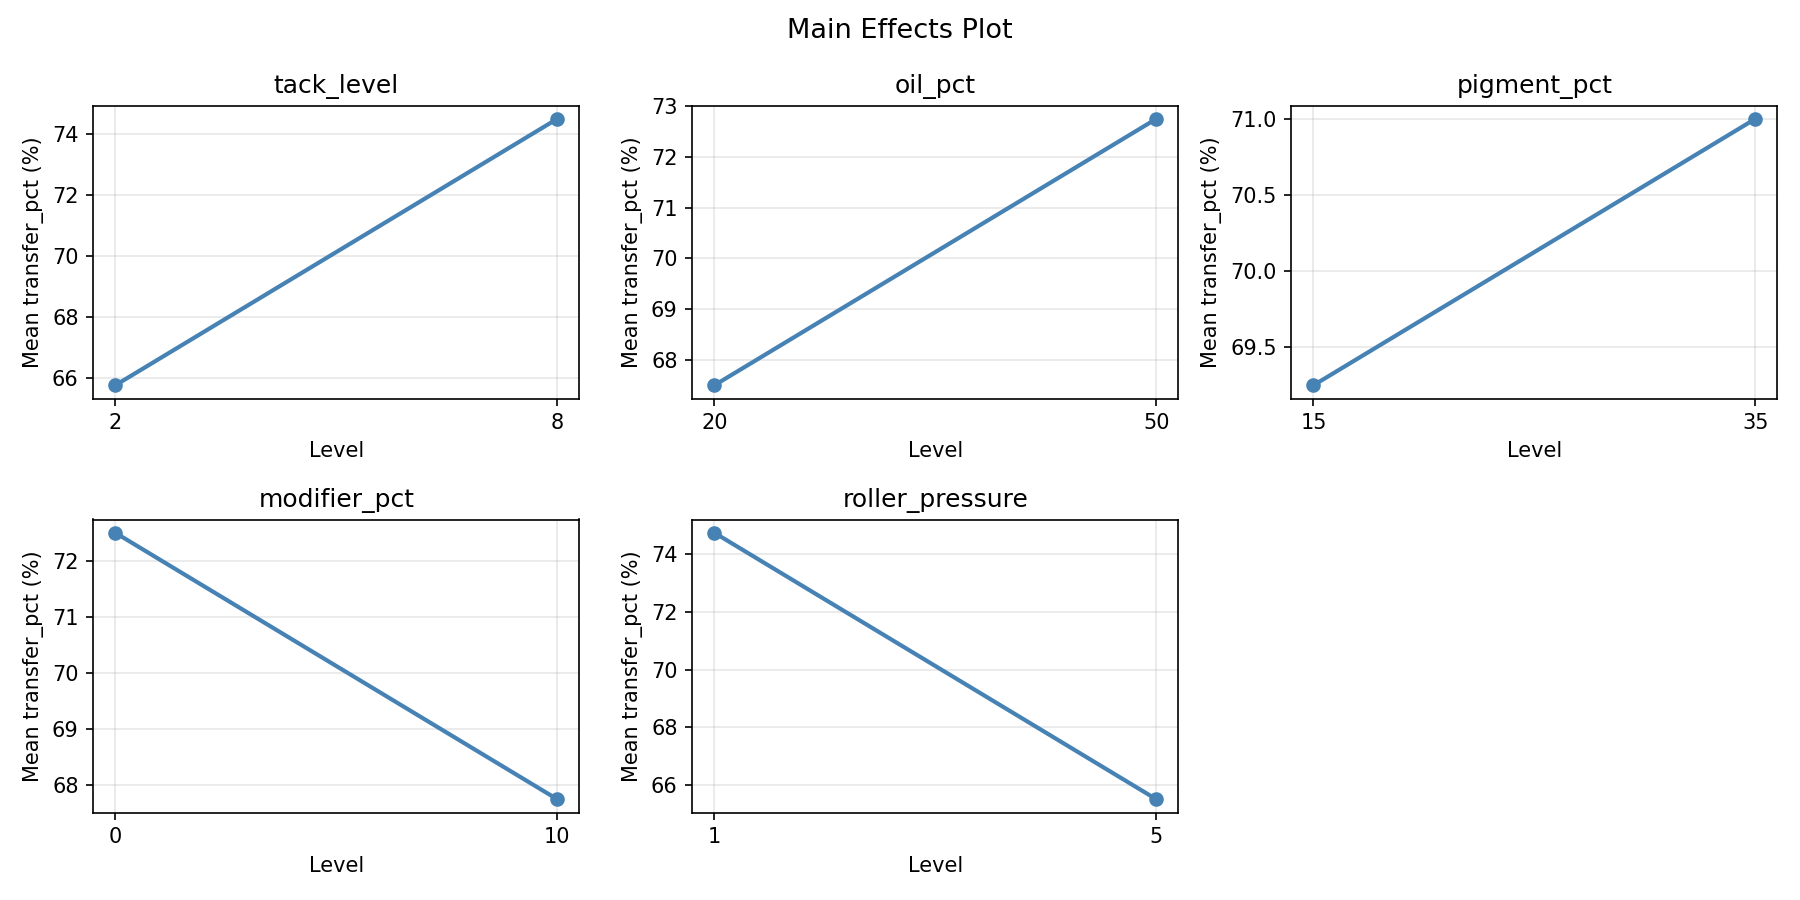
Main Effects Plot
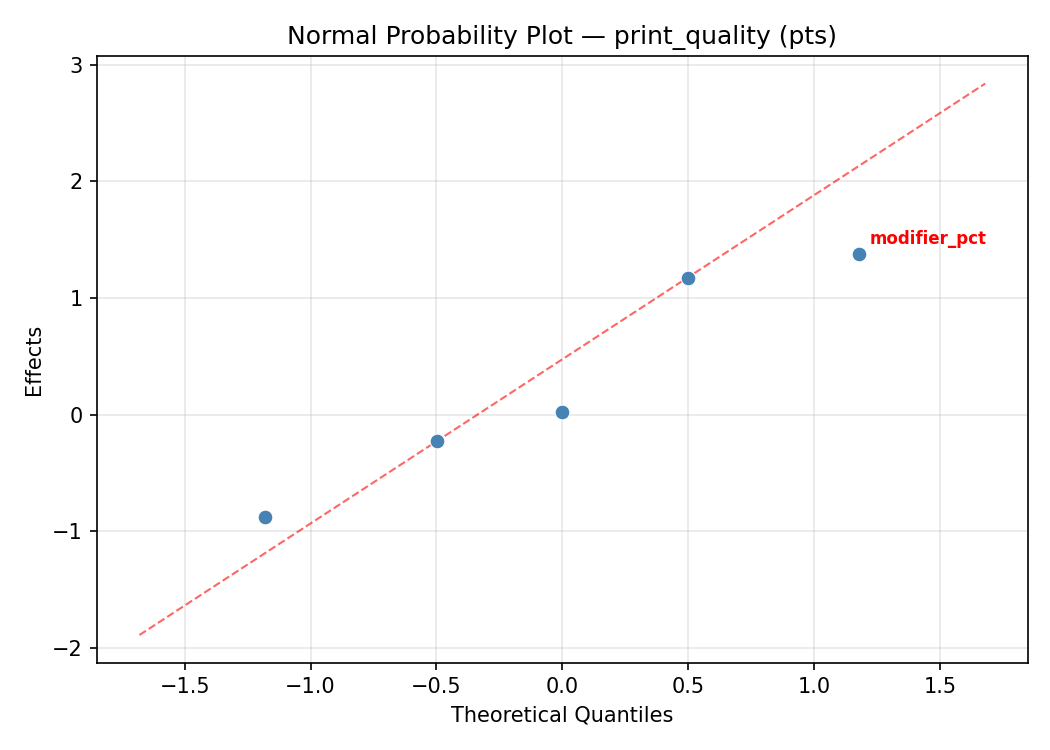
Normal Probability Plot of Effects
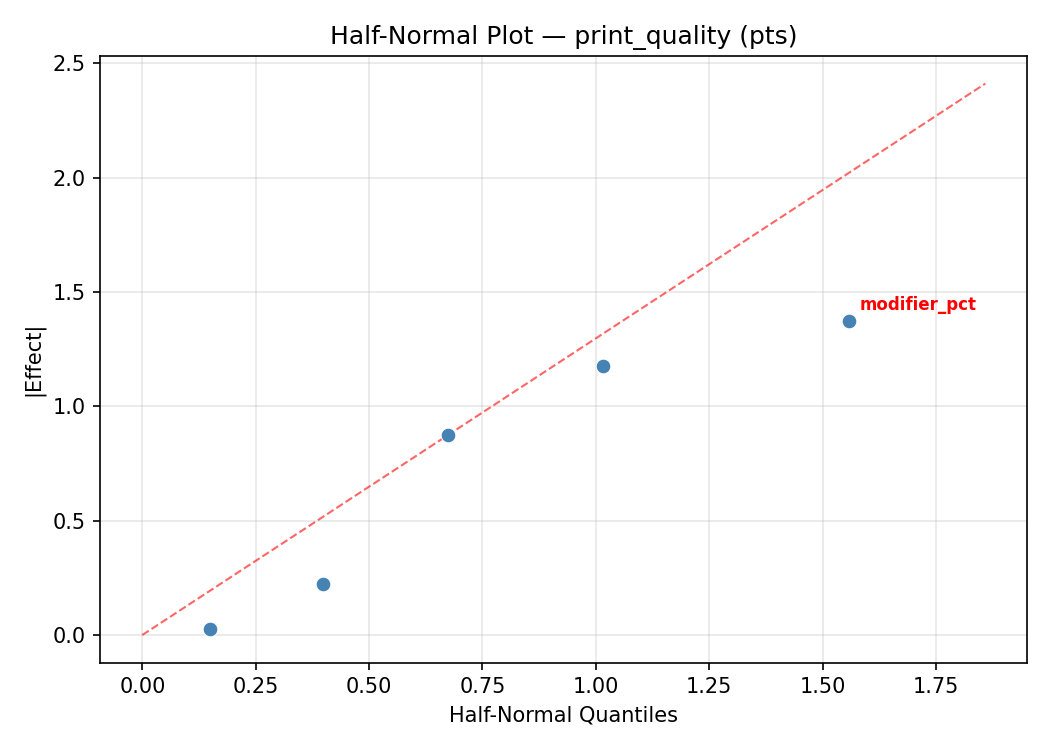
Half-Normal Plot of Effects
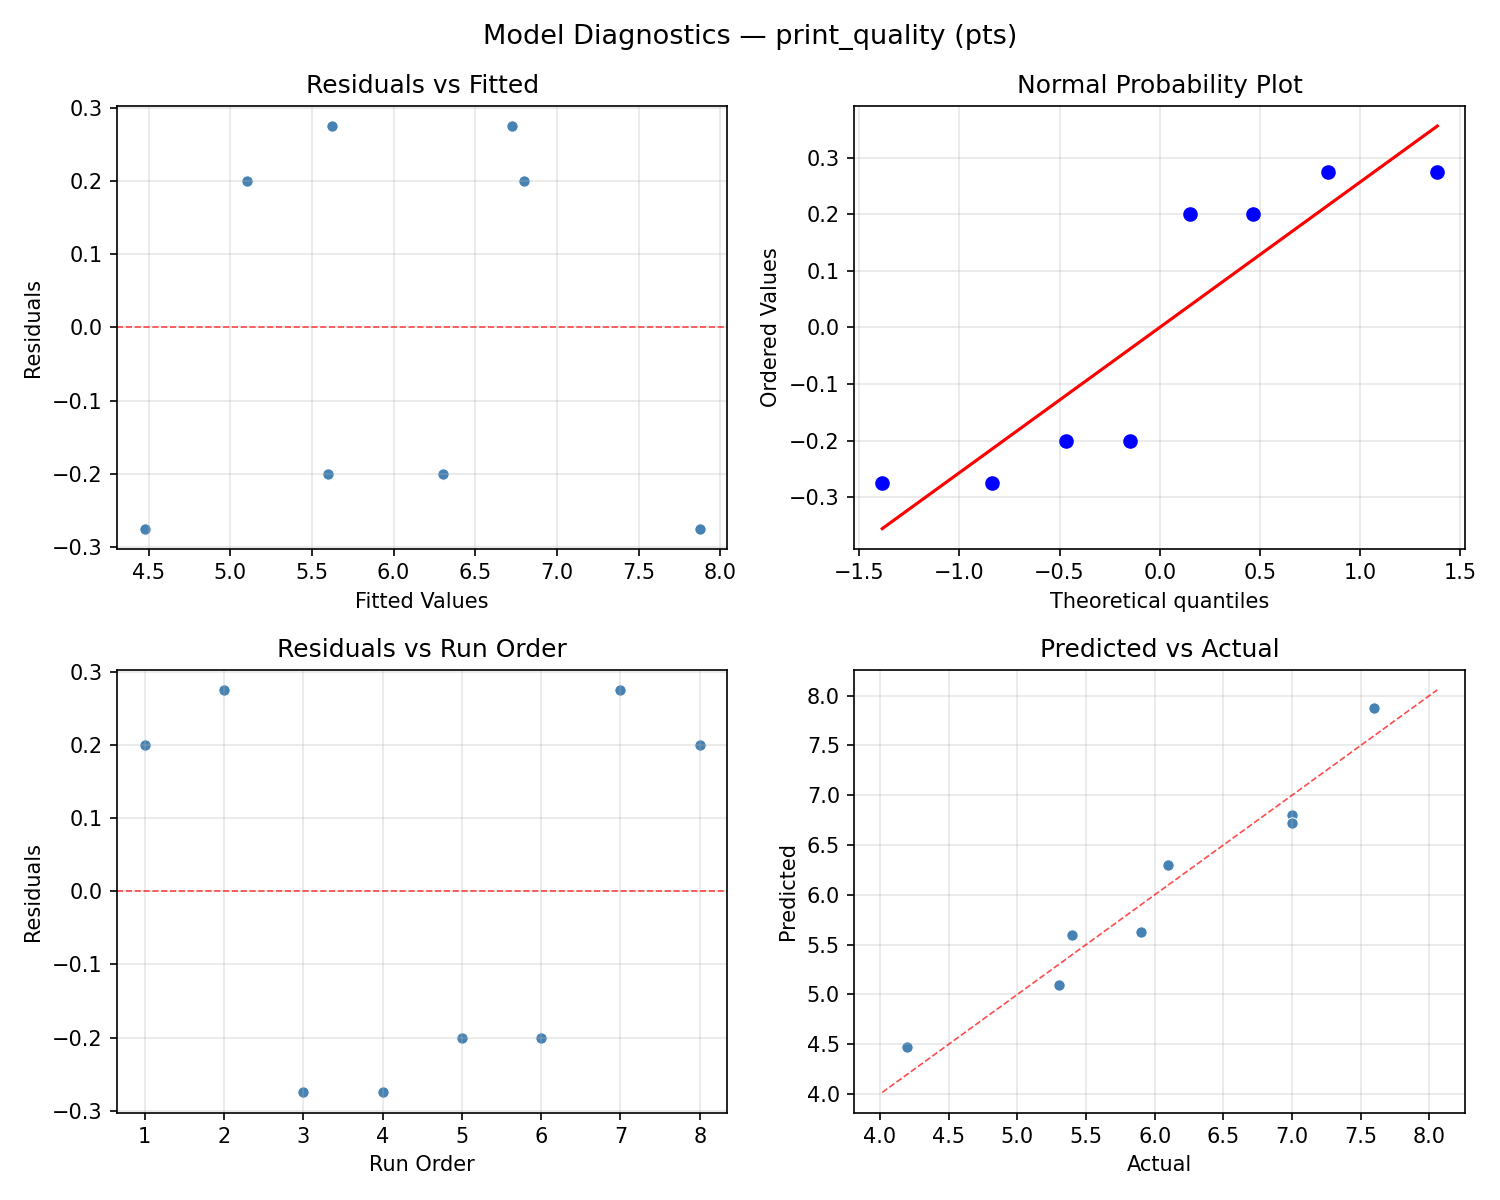
Model Diagnostics
Response: transfer_pct
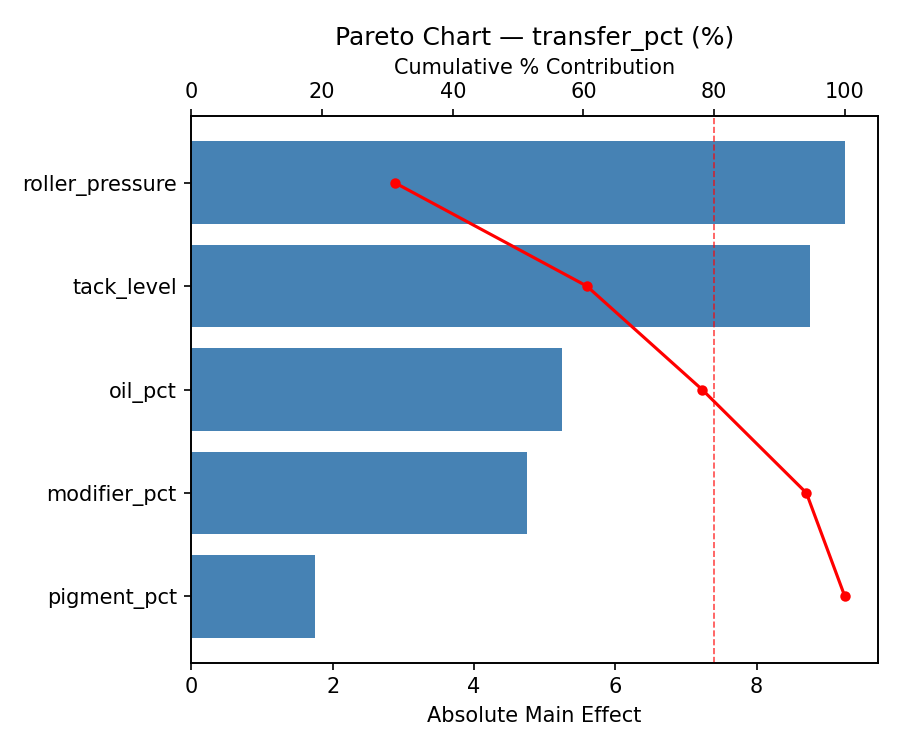
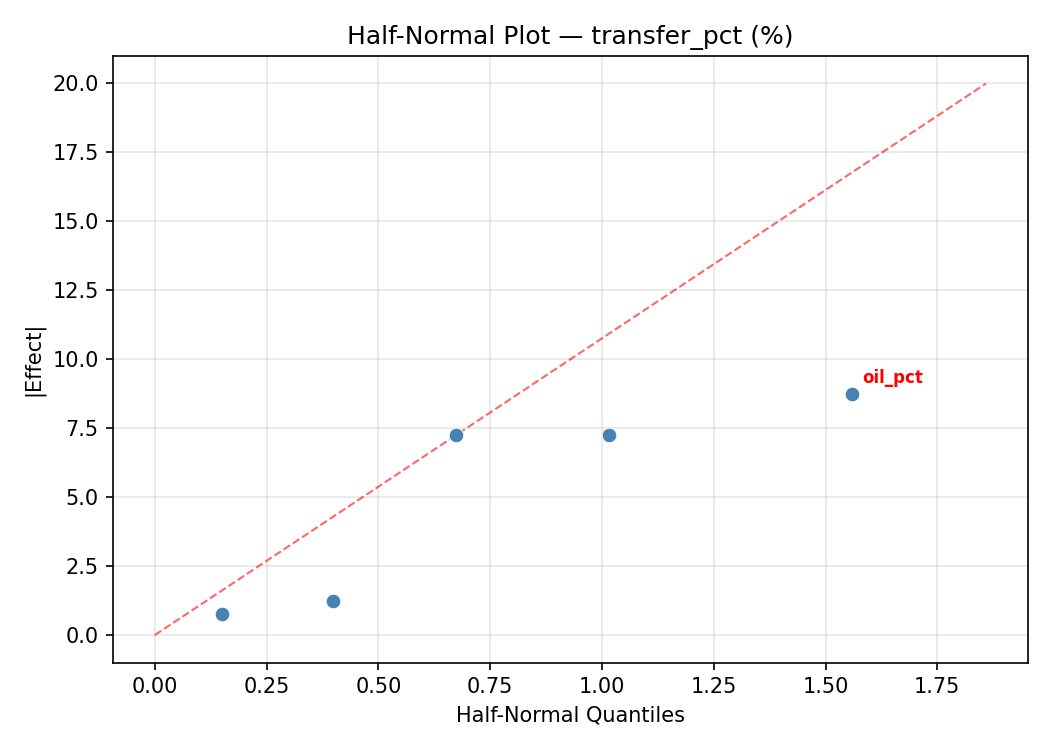
Top factors: modifier_pct (36.1%), roller_pressure (24.4%), pigment_pct (19.3%).
ANOVA
| Source | DF | SS | MS | F | p-value |
|---|
| Source | DF | SS | MS | F | p-value |
| tack_level | 1 | 45.1250 | 45.1250 | 0.667 | 0.4513 |
| oil_pct | 1 | 3.1250 | 3.1250 | 0.046 | 0.8384 |
| pigment_pct | 1 | 66.1250 | 66.1250 | 0.977 | 0.3683 |
| modifier_pct | 1 | 231.1250 | 231.1250 | 3.415 | 0.1239 |
| roller_pressure | 1 | 105.1250 | 105.1250 | 1.553 | 0.2679 |
| tack_level*oil_pct | 1 | 66.1250 | 66.1250 | 0.977 | 0.3683 |
| tack_level*pigment_pct | 1 | 3.1250 | 3.1250 | 0.046 | 0.8384 |
| tack_level*modifier_pct | 1 | 105.1250 | 105.1250 | 1.553 | 0.2679 |
| tack_level*roller_pressure | 1 | 231.1250 | 231.1250 | 3.415 | 0.1239 |
| oil_pct*pigment_pct | 1 | 45.1250 | 45.1250 | 0.667 | 0.4513 |
| oil_pct*modifier_pct | 1 | 15.1250 | 15.1250 | 0.223 | 0.6563 |
| oil_pct*roller_pressure | 1 | 21.1250 | 21.1250 | 0.312 | 0.6005 |
| pigment_pct*modifier_pct | 1 | 21.1250 | 21.1250 | 0.312 | 0.6005 |
| pigment_pct*roller_pressure | 1 | 15.1250 | 15.1250 | 0.223 | 0.6563 |
| modifier_pct*roller_pressure | 1 | 45.1250 | 45.1250 | 0.667 | 0.4513 |
| Error | (Lenth | PSE) | 5 | 338.4375 | 67.6875 |
| Total | 7 | 486.8750 | 69.5536 | | |
Pareto Chart
Main Effects Plot
Normal Probability Plot of Effects
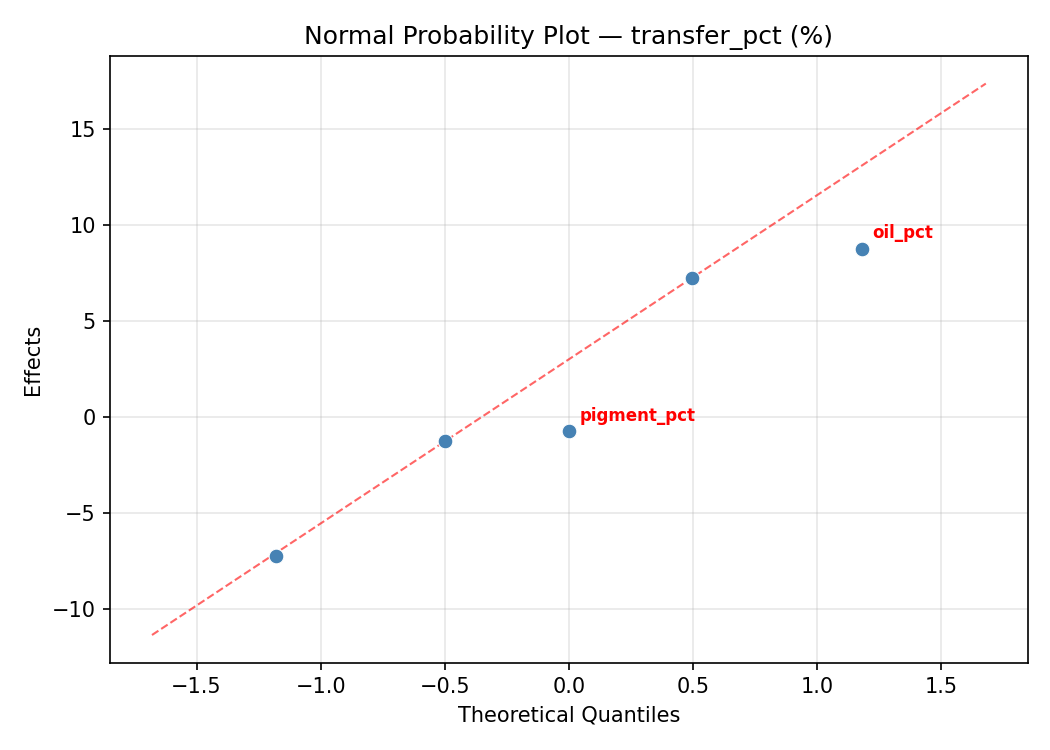
Half-Normal Plot of Effects
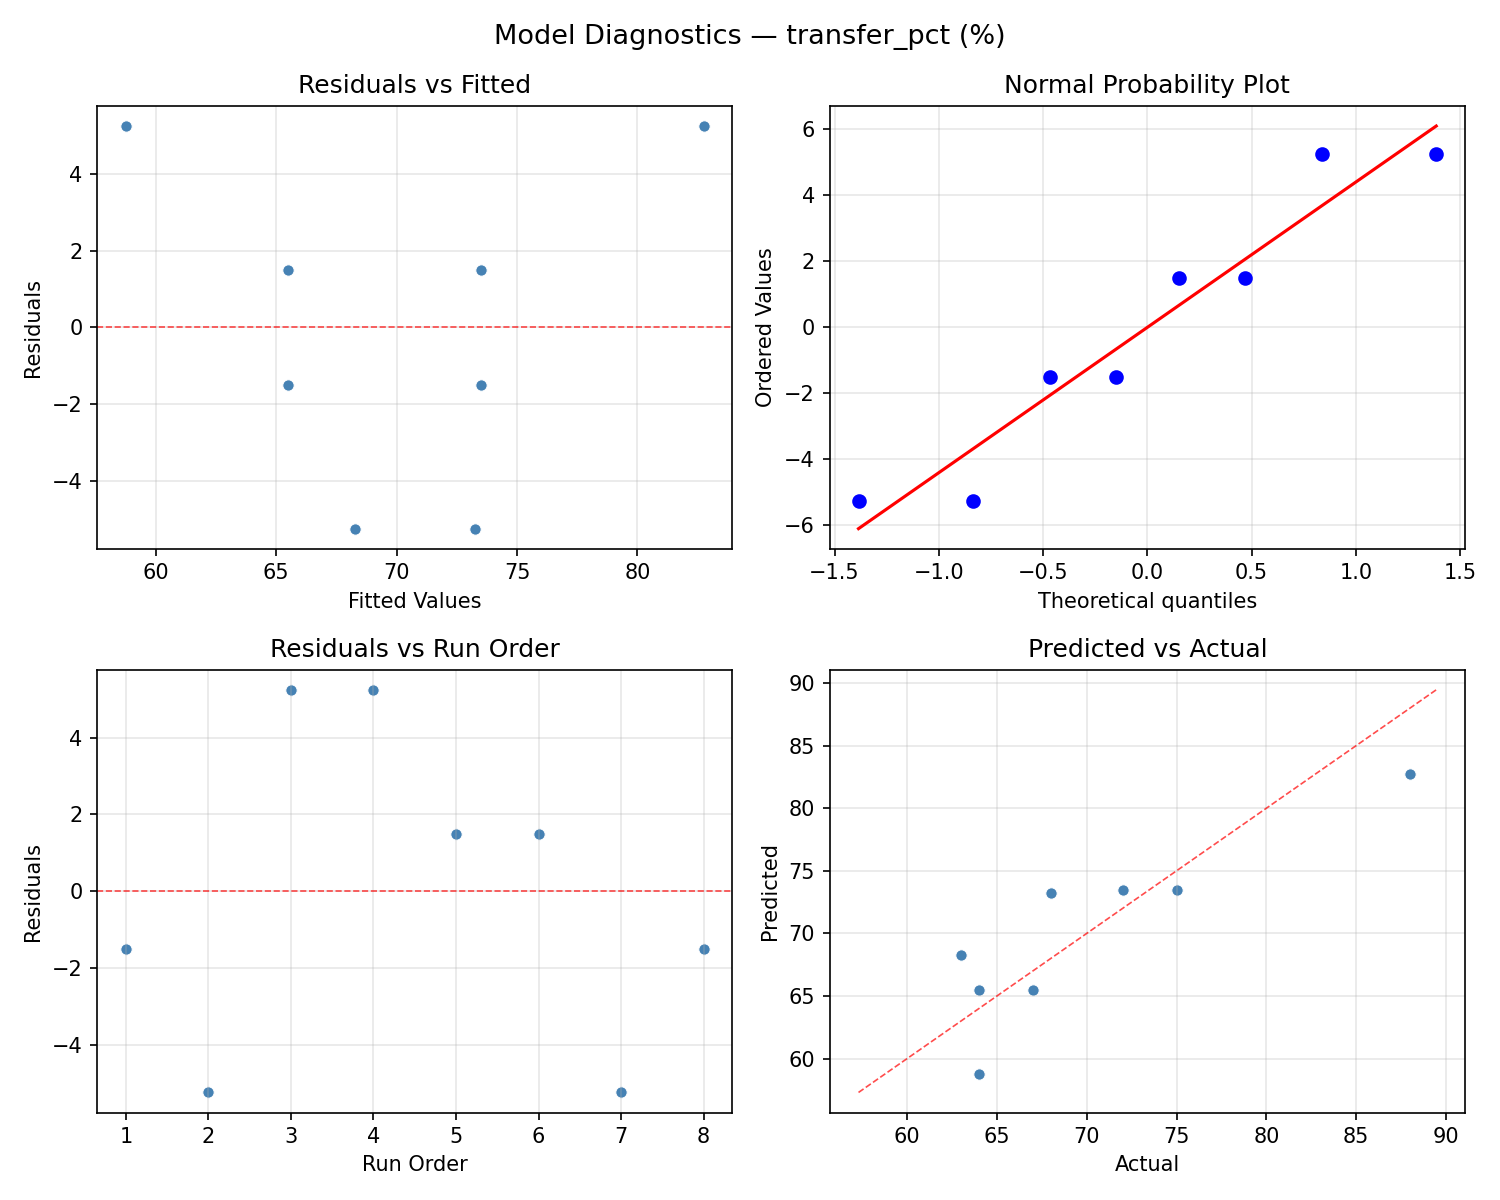
Model Diagnostics
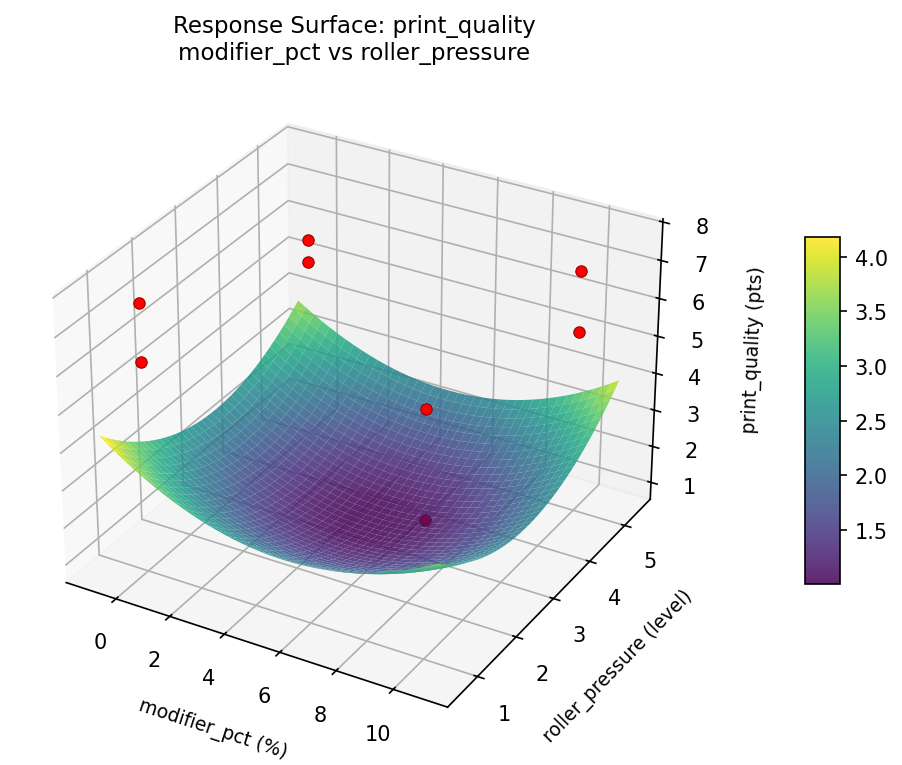
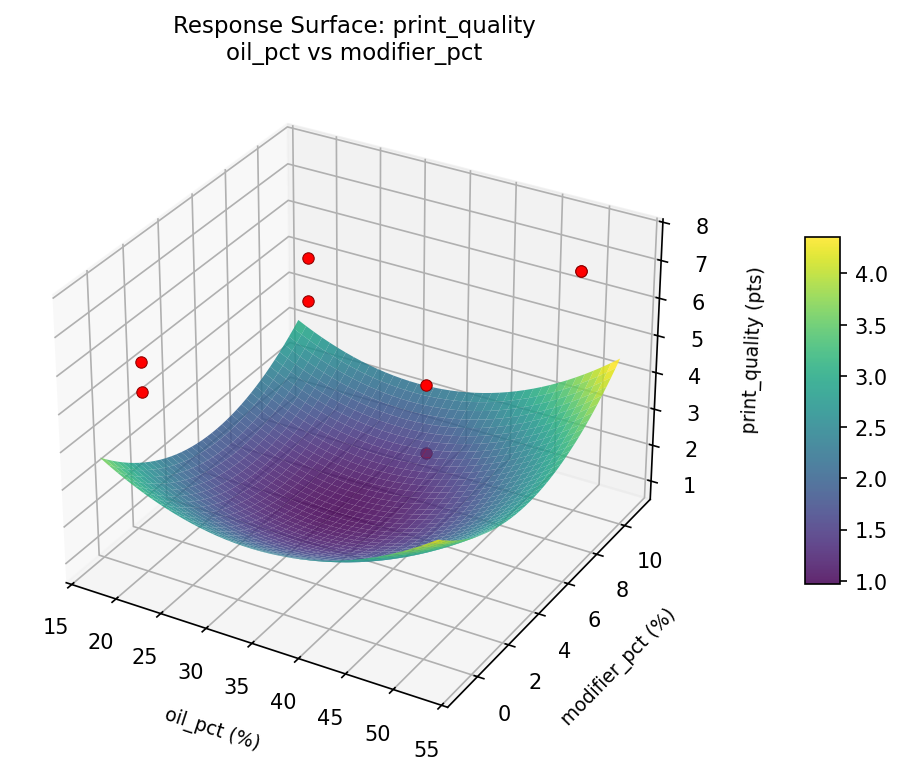
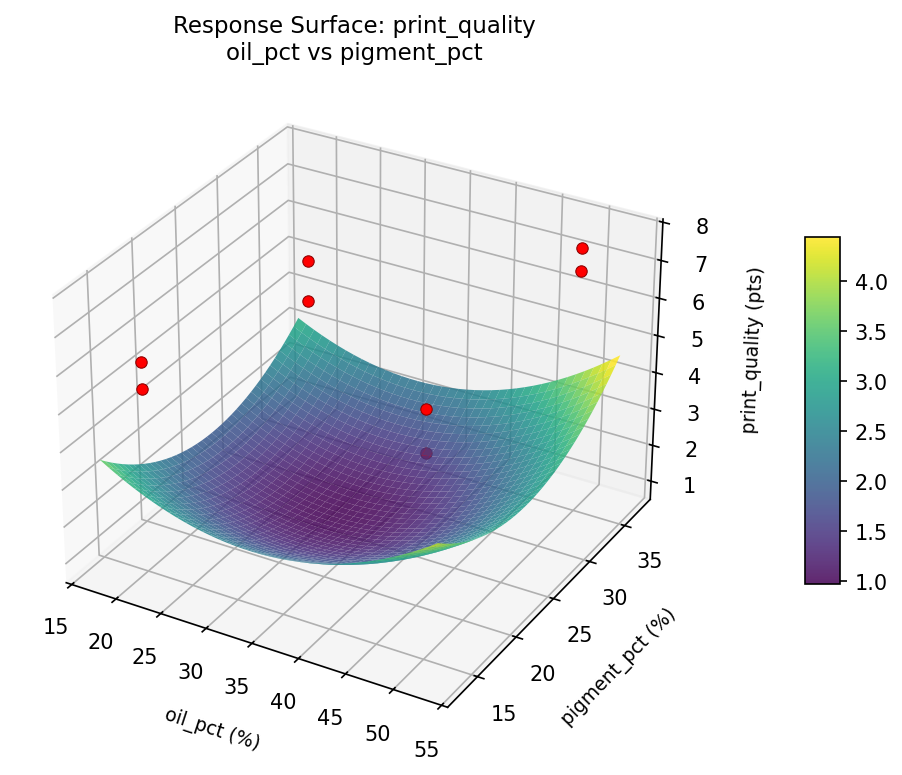
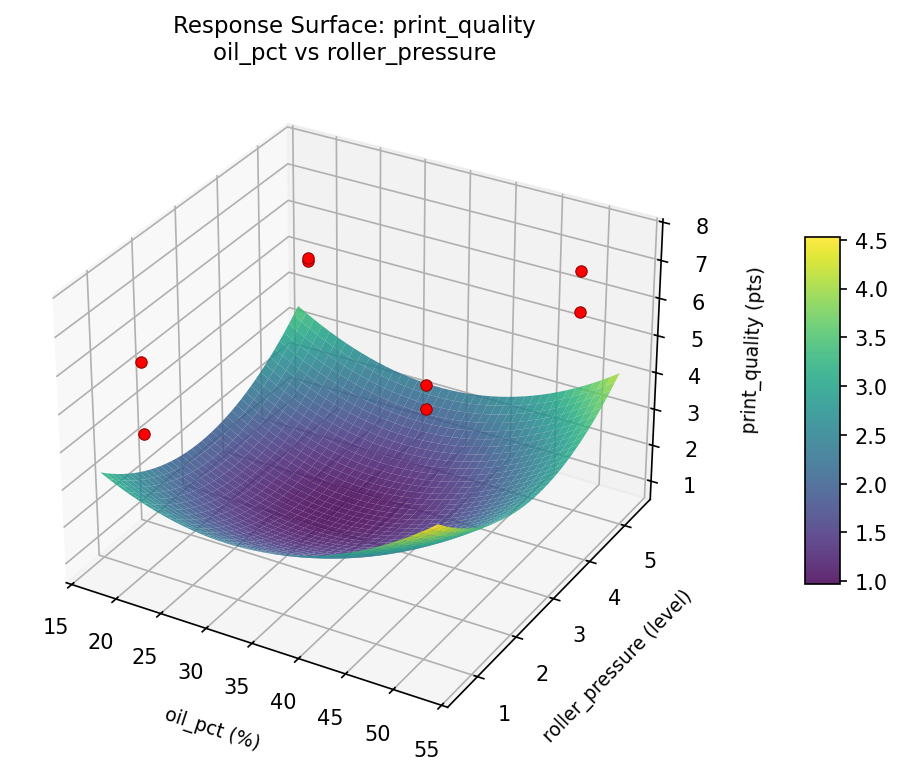
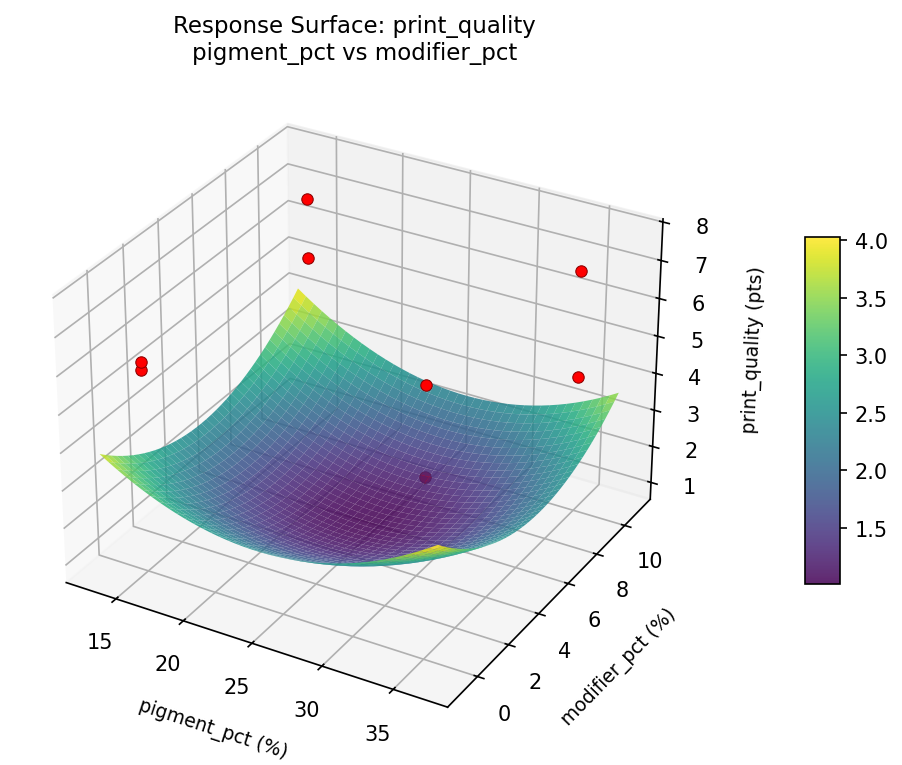
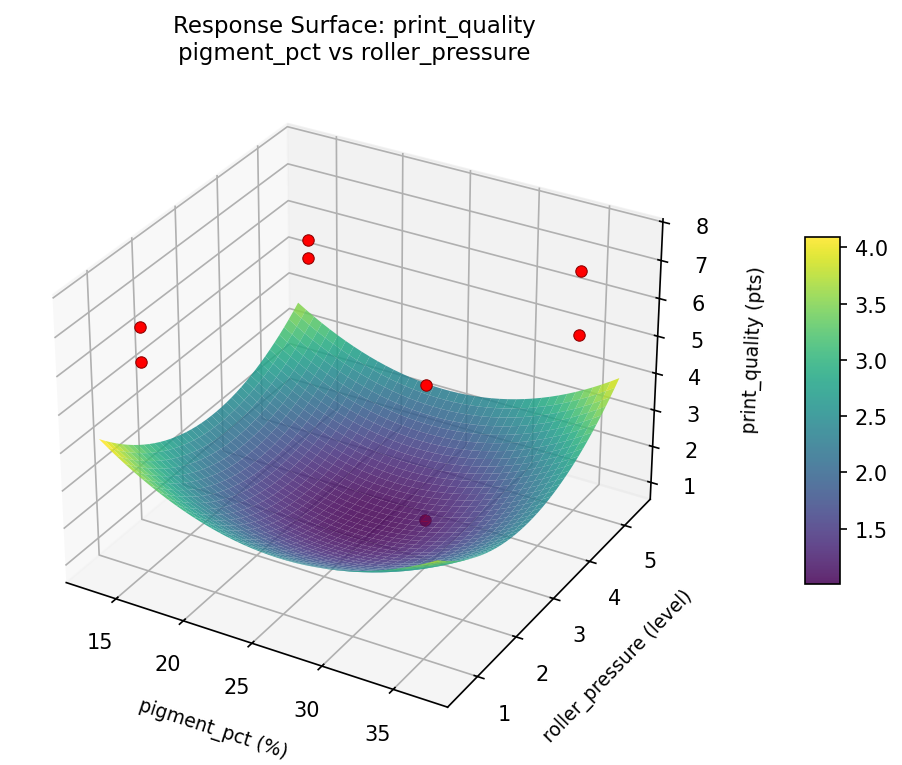
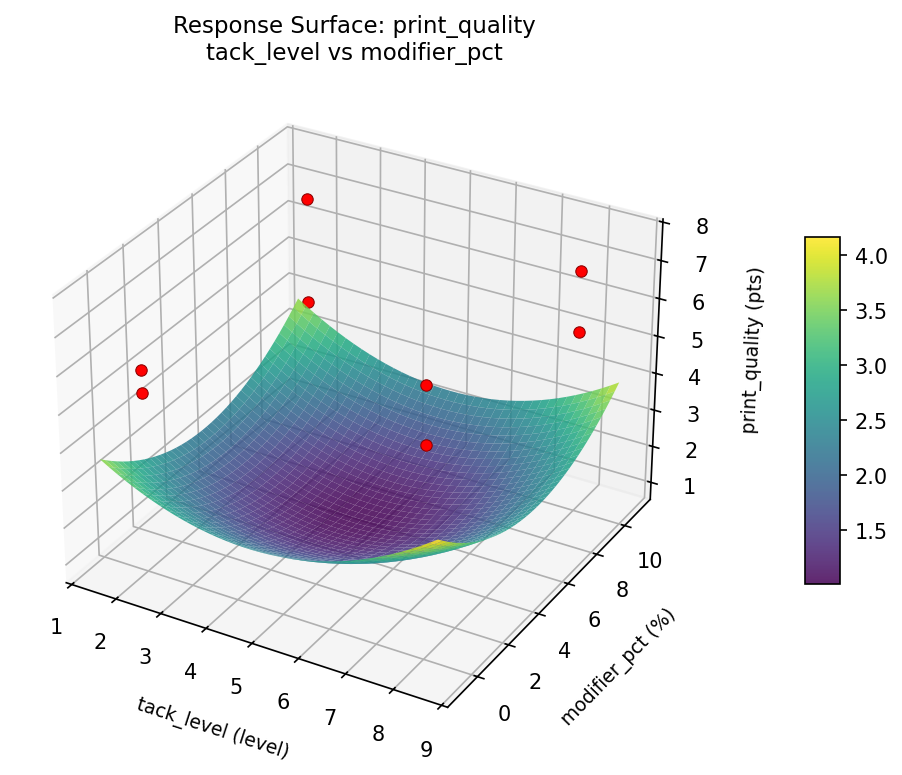
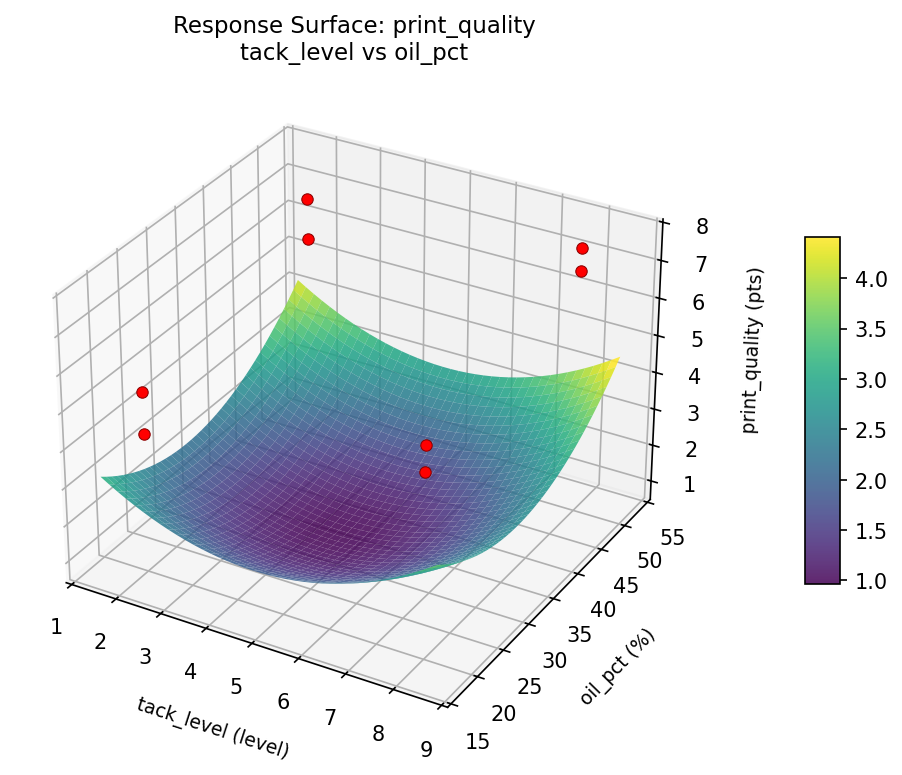
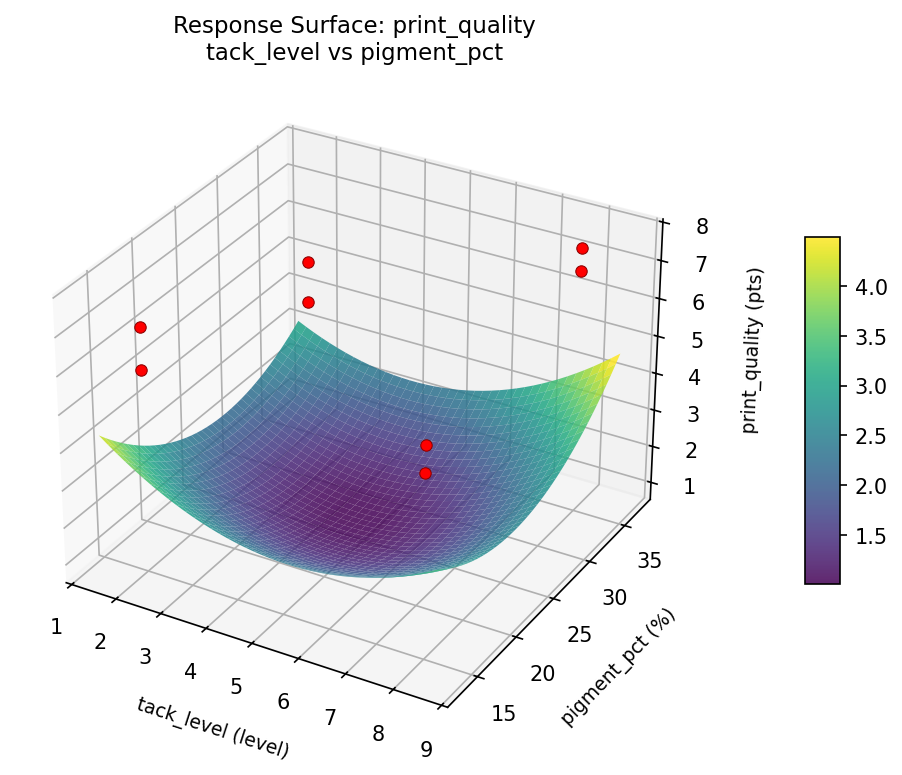
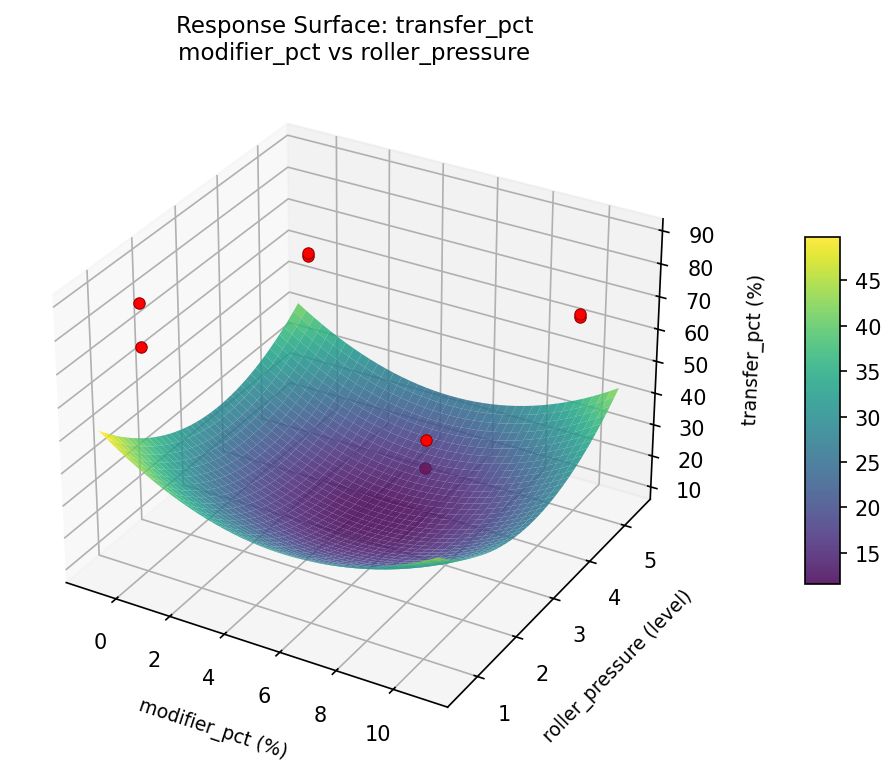
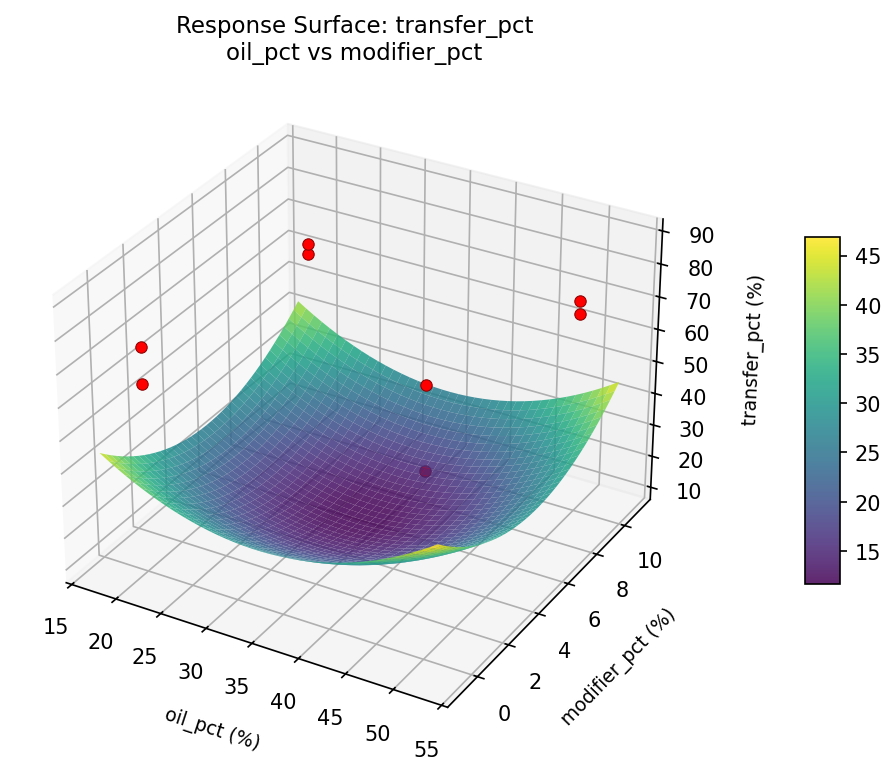
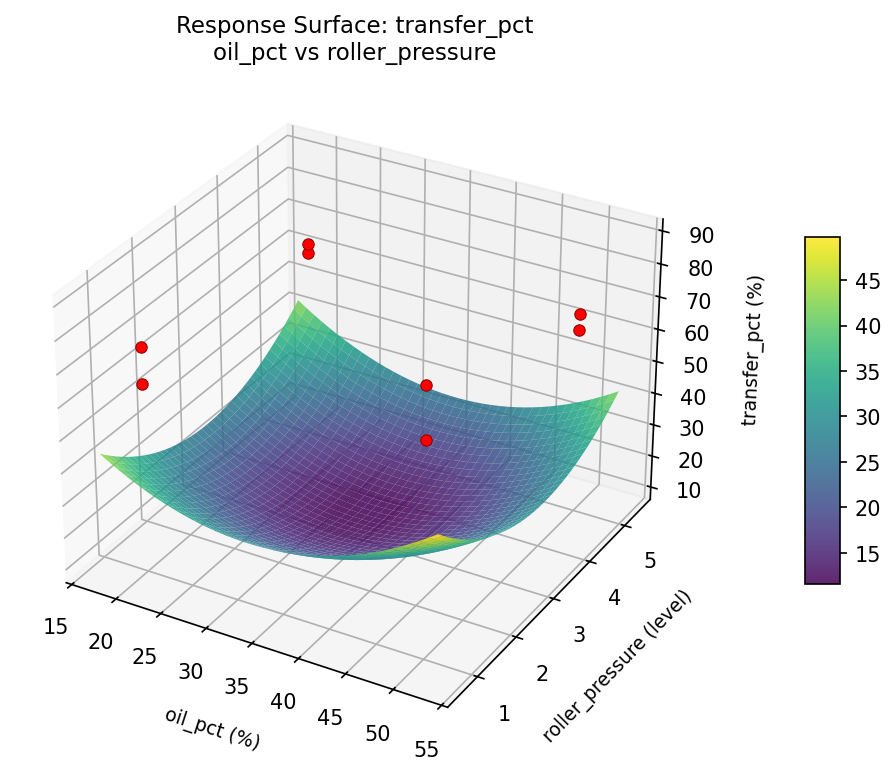
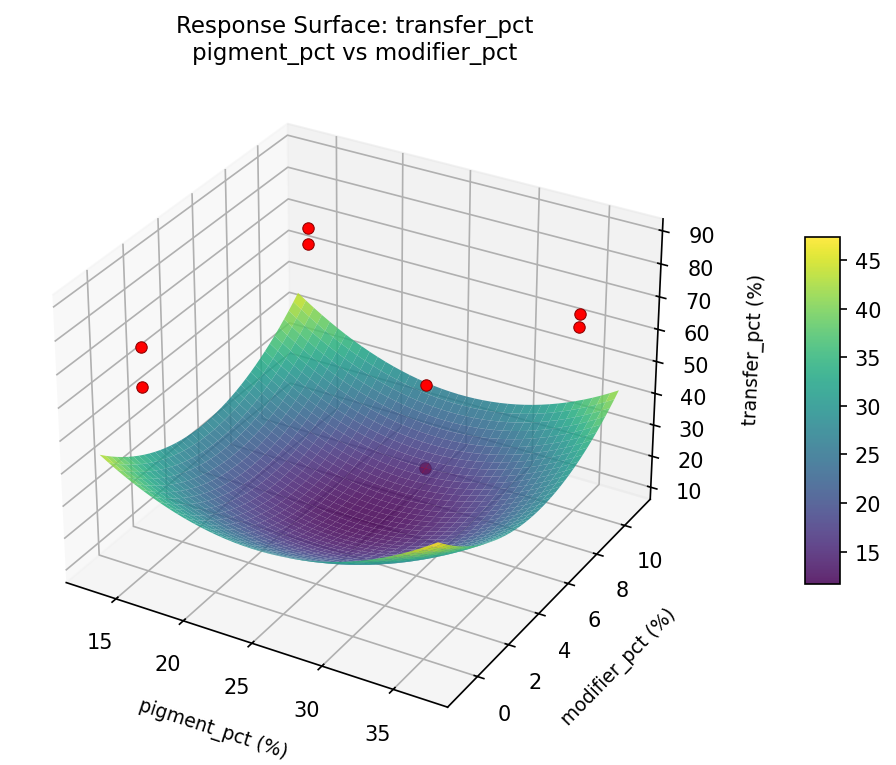
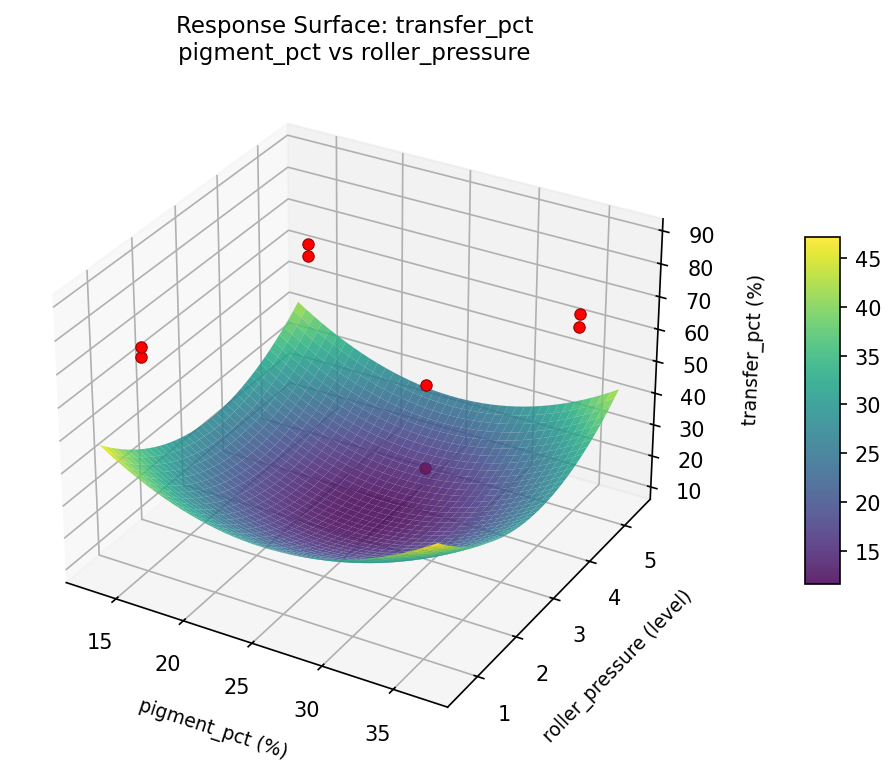
Response Surface Plots
3D surfaces fitted with quadratic RSM. Red dots are observed data points.
print quality modifier pct vs roller pressure
print quality oil pct vs modifier pct
print quality oil pct vs pigment pct
print quality oil pct vs roller pressure
print quality pigment pct vs modifier pct
print quality pigment pct vs roller pressure
print quality tack level vs modifier pct
print quality tack level vs oil pct
print quality tack level vs pigment pct
print quality tack level vs roller pressure

transfer pct modifier pct vs roller pressure
transfer pct oil pct vs modifier pct
transfer pct oil pct vs pigment pct

transfer pct oil pct vs roller pressure
transfer pct pigment pct vs modifier pct
transfer pct pigment pct vs roller pressure
transfer pct tack level vs modifier pct
transfer pct tack level vs oil pct
transfer pct tack level vs pigment pct

transfer pct tack level vs roller pressure

Multi-Objective Optimization
When responses compete, Derringer–Suich desirability finds the best compromise.
Each response is scaled to a 0–1 desirability, then combined via a weighted geometric mean.
Overall Desirability
D = 0.9545
Per-Response Desirability
| Response | Weight | Desirability | Predicted | Dir |
|---|
print_quality |
1.5 |
|
7.60 0.9545 7.60 pts |
↑ |
transfer_pct |
1.0 |
|
88.00 0.9545 88.00 % |
↑ |
Recommended Settings
| Factor | Value |
|---|
tack_level | 2 level |
oil_pct | 50 % |
pigment_pct | 15 % |
modifier_pct | 10 % |
roller_pressure | 1 level |
Source: from observed run #4
Trade-off Summary
Sacrifice = how much worse than single-objective best.
| Response | Predicted | Best Observed | Sacrifice |
|---|
transfer_pct | 88.00 | 88.00 | +0.00 |
Top 3 Runs by Desirability
| Run | D | Factor Settings |
|---|
| #1 | 0.5868 | tack_level=2, oil_pct=20, pigment_pct=35, modifier_pct=0, roller_pressure=5 |
| #6 | 0.5236 | tack_level=2, oil_pct=20, pigment_pct=35, modifier_pct=10, roller_pressure=1 |
Model Quality
| Response | R² | Type |
|---|
transfer_pct | 0.7715 | linear |
Full Multi-Objective Output
============================================================
MULTI-OBJECTIVE OPTIMIZATION
Method: Derringer-Suich Desirability Function
============================================================
Overall desirability: D = 0.9545
Response Weight Desirability Predicted Direction
---------------------------------------------------------------------
print_quality 1.5 0.9545 7.60 pts ↑
transfer_pct 1.0 0.9545 88.00 % ↑
Recommended settings:
tack_level = 2 level
oil_pct = 50 %
pigment_pct = 15 %
modifier_pct = 10 %
roller_pressure = 1 level
(from observed run #4)
Trade-off summary:
print_quality: 7.60 (best observed: 7.60, sacrifice: +0.00)
transfer_pct: 88.00 (best observed: 88.00, sacrifice: +0.00)
Model quality:
print_quality: R² = 0.7034 (linear)
transfer_pct: R² = 0.7715 (linear)
Top 3 observed runs by overall desirability:
1. Run #4 (D=0.9545): tack_level=2, oil_pct=50, pigment_pct=15, modifier_pct=10, roller_pressure=1
2. Run #1 (D=0.5868): tack_level=2, oil_pct=20, pigment_pct=35, modifier_pct=0, roller_pressure=5
3. Run #6 (D=0.5236): tack_level=2, oil_pct=20, pigment_pct=35, modifier_pct=10, roller_pressure=1
Full Analysis Output
=== Main Effects: print_quality ===
Factor Effect Std Error % Contribution
--------------------------------------------------------------
modifier_pct 0.9250 0.3928 25.2%
oil_pct 0.8750 0.3928 23.8%
roller_pressure -0.8750 0.3928 23.8%
pigment_pct 0.7750 0.3928 21.1%
tack_level 0.2250 0.3928 6.1%
=== ANOVA Table: print_quality ===
Source DF SS MS F p-value
-----------------------------------------------------------------------------
tack_level 1 0.1012 0.1012 0.050 0.8326
oil_pct 1 1.5312 1.5312 0.750 0.4261
pigment_pct 1 1.2013 1.2013 0.588 0.4777
modifier_pct 1 1.7113 1.7113 0.838 0.4019
roller_pressure 1 1.5312 1.5312 0.750 0.4261
tack_level*oil_pct 1 1.2013 1.2013 0.588 0.4777
tack_level*pigment_pct 1 1.5312 1.5312 0.750 0.4261
tack_level*modifier_pct 1 1.5312 1.5312 0.750 0.4261
tack_level*roller_pressure 1 1.7112 1.7112 0.838 0.4019
oil_pct*pigment_pct 1 0.1012 0.1012 0.050 0.8326
oil_pct*modifier_pct 1 1.3612 1.3612 0.667 0.4513
oil_pct*roller_pressure 1 1.2012 1.2012 0.588 0.4777
pigment_pct*modifier_pct 1 1.2012 1.2012 0.588 0.4777
pigment_pct*roller_pressure 1 1.3612 1.3612 0.667 0.4513
modifier_pct*roller_pressure 1 0.1012 0.1012 0.050 0.8326
Error (Lenth PSE) 5 10.2094 2.0419
Total 7 8.6387 1.2341
Note: Error estimated using Lenth's pseudo-standard-error (unreplicated design)
=== Interaction Effects: print_quality ===
Factor A Factor B Interaction % Contribution
------------------------------------------------------------------------
tack_level roller_pressure 0.9250 13.0%
tack_level pigment_pct 0.8750 12.3%
tack_level modifier_pct -0.8750 12.3%
oil_pct modifier_pct -0.8250 11.6%
pigment_pct roller_pressure -0.8250 11.6%
tack_level oil_pct 0.7750 10.9%
oil_pct roller_pressure 0.7750 10.9%
pigment_pct modifier_pct 0.7750 10.9%
oil_pct pigment_pct 0.2250 3.2%
modifier_pct roller_pressure 0.2250 3.2%
=== Summary Statistics: print_quality ===
tack_level:
Level N Mean Std Min Max
------------------------------------------------------------
2 4 5.9500 1.3916 4.2000 7.6000
8 4 6.1750 0.9535 5.3000 7.0000
oil_pct:
Level N Mean Std Min Max
------------------------------------------------------------
20 4 5.6250 1.4245 4.2000 7.6000
50 4 6.5000 0.5831 5.9000 7.0000
pigment_pct:
Level N Mean Std Min Max
------------------------------------------------------------
15 4 5.6750 0.3862 5.3000 6.1000
35 4 6.4500 1.5264 4.2000 7.6000
modifier_pct:
Level N Mean Std Min Max
------------------------------------------------------------
0 4 5.6000 1.1690 4.2000 7.0000
10 4 6.5250 0.9708 5.4000 7.6000
roller_pressure:
Level N Mean Std Min Max
------------------------------------------------------------
1 4 6.5000 1.0100 5.3000 7.6000
5 4 5.6250 1.1615 4.2000 7.0000
=== Main Effects: transfer_pct ===
Factor Effect Std Error % Contribution
--------------------------------------------------------------
modifier_pct 10.7500 2.9486 36.1%
roller_pressure -7.2500 2.9486 24.4%
pigment_pct 5.7500 2.9486 19.3%
tack_level -4.7500 2.9486 16.0%
oil_pct -1.2500 2.9486 4.2%
=== ANOVA Table: transfer_pct ===
Source DF SS MS F p-value
-----------------------------------------------------------------------------
tack_level 1 45.1250 45.1250 0.667 0.4513
oil_pct 1 3.1250 3.1250 0.046 0.8384
pigment_pct 1 66.1250 66.1250 0.977 0.3683
modifier_pct 1 231.1250 231.1250 3.415 0.1239
roller_pressure 1 105.1250 105.1250 1.553 0.2679
tack_level*oil_pct 1 66.1250 66.1250 0.977 0.3683
tack_level*pigment_pct 1 3.1250 3.1250 0.046 0.8384
tack_level*modifier_pct 1 105.1250 105.1250 1.553 0.2679
tack_level*roller_pressure 1 231.1250 231.1250 3.415 0.1239
oil_pct*pigment_pct 1 45.1250 45.1250 0.667 0.4513
oil_pct*modifier_pct 1 15.1250 15.1250 0.223 0.6563
oil_pct*roller_pressure 1 21.1250 21.1250 0.312 0.6005
pigment_pct*modifier_pct 1 21.1250 21.1250 0.312 0.6005
pigment_pct*roller_pressure 1 15.1250 15.1250 0.223 0.6563
modifier_pct*roller_pressure 1 45.1250 45.1250 0.667 0.4513
Error (Lenth PSE) 5 338.4375 67.6875
Total 7 486.8750 69.5536
Note: Error estimated using Lenth's pseudo-standard-error (unreplicated design)
=== Interaction Effects: transfer_pct ===
Factor A Factor B Interaction % Contribution
------------------------------------------------------------------------
tack_level roller_pressure 10.7500 23.1%
tack_level modifier_pct -7.2500 15.6%
tack_level oil_pct 5.7500 12.4%
oil_pct pigment_pct -4.7500 10.2%
modifier_pct roller_pressure -4.7500 10.2%
oil_pct roller_pressure 3.2500 7.0%
pigment_pct modifier_pct 3.2500 7.0%
oil_pct modifier_pct -2.7500 5.9%
pigment_pct roller_pressure -2.7500 5.9%
tack_level pigment_pct -1.2500 2.7%
=== Summary Statistics: transfer_pct ===
tack_level:
Level N Mean Std Min Max
------------------------------------------------------------
2 4 72.5000 11.6762 63.0000 88.0000
8 4 67.7500 3.3040 64.0000 72.0000
oil_pct:
Level N Mean Std Min Max
------------------------------------------------------------
20 4 70.7500 11.5866 64.0000 88.0000
50 4 69.5000 5.1962 63.0000 75.0000
pigment_pct:
Level N Mean Std Min Max
------------------------------------------------------------
15 4 67.2500 5.4391 63.0000 75.0000
35 4 73.0000 10.5198 64.0000 88.0000
modifier_pct:
Level N Mean Std Min Max
------------------------------------------------------------
0 4 64.7500 2.2174 63.0000 68.0000
10 4 75.5000 8.9629 67.0000 88.0000
roller_pressure:
Level N Mean Std Min Max
------------------------------------------------------------
1 4 73.7500 10.5317 64.0000 88.0000
5 4 66.5000 4.0415 63.0000 72.0000
Optimization Recommendations
=== Optimization: print_quality ===
Direction: maximize
Best observed run: #4
tack_level = 2
oil_pct = 20
pigment_pct = 35
modifier_pct = 0
roller_pressure = 5
Value: 7.6
RSM Model (linear, R² = 0.5031, Adj R² = -0.7391):
Coefficients:
intercept +6.0625
tack_level +0.2375
oil_pct +0.0125
pigment_pct +0.6875
modifier_pct +0.0375
roller_pressure +0.1125
Predicted optimum (from linear model, at observed points):
tack_level = 8
oil_pct = 50
pigment_pct = 35
modifier_pct = 10
roller_pressure = 5
Predicted value: 7.1500
Surface optimum (via L-BFGS-B, linear model):
tack_level = 8
oil_pct = 50
pigment_pct = 35
modifier_pct = 10
roller_pressure = 5
Predicted value: 7.1500
Model quality: Moderate fit — use predictions directionally, not precisely.
Factor importance:
1. pigment_pct (effect: 1.4, contribution: 63.2%)
2. tack_level (effect: 0.5, contribution: 21.8%)
3. roller_pressure (effect: 0.2, contribution: 10.3%)
4. modifier_pct (effect: 0.1, contribution: 3.4%)
5. oil_pct (effect: 0.0, contribution: 1.1%)
=== Optimization: transfer_pct ===
Direction: maximize
Best observed run: #4
tack_level = 2
oil_pct = 20
pigment_pct = 35
modifier_pct = 0
roller_pressure = 5
Value: 88.0
RSM Model (linear, R² = 0.4614, Adj R² = -0.8852):
Coefficients:
intercept +70.1250
tack_level -3.3750
oil_pct -0.3750
pigment_pct +3.6250
modifier_pct -0.8750
roller_pressure +1.6250
Predicted optimum (from linear model, at observed points):
tack_level = 2
oil_pct = 20
pigment_pct = 35
modifier_pct = 0
roller_pressure = 5
Predicted value: 80.0000
Surface optimum (via L-BFGS-B, linear model):
tack_level = 2
oil_pct = 20
pigment_pct = 35
modifier_pct = 0
roller_pressure = 5
Predicted value: 80.0000
Model quality: Weak fit — consider adding center points or using a different design.
Factor importance:
1. pigment_pct (effect: 7.2, contribution: 36.7%)
2. tack_level (effect: -6.8, contribution: 34.2%)
3. roller_pressure (effect: 3.2, contribution: 16.5%)
4. modifier_pct (effect: -1.8, contribution: 8.9%)
5. oil_pct (effect: -0.8, contribution: 3.8%)