Summary
This experiment investigates message queue consumer tuning. Latin Hypercube exploration of 4 Kafka consumer parameters for throughput and lag.
The design varies 4 factors: fetch min bytes (bytes), ranging from 1 to 1048576, max poll records (records), ranging from 100 to 5000, num consumers (count), ranging from 1 to 12, and session timeout (ms), ranging from 6000 to 45000. The goal is to optimize 2 responses: throughput mbps (MB/s) (maximize) and consumer lag (records) (minimize). Fixed conditions held constant across all runs include partitions = 12, replication factor = 3.
Latin Hypercube Sampling was used to space 10 runs across the 4-dimensional factor space with good coverage and minimal gaps, making it ideal for computer experiments where the response surface may be complex.
Key Findings
For throughput mbps, the most influential factors were fetch min bytes (25.0%), max poll records (25.0%), num consumers (25.0%). The best observed value was 140.2 (at fetch min bytes = 970069, max poll records = 3331.44, num consumers = 4.31814).
For consumer lag, the most influential factors were fetch min bytes (25.0%), max poll records (25.0%), num consumers (25.0%). The best observed value was 41053.0 (at fetch min bytes = 970069, max poll records = 3331.44, num consumers = 4.31814).
Recommended Next Steps
- Consider whether any fixed factors should be varied in a future study.
Experimental Setup
Factors
| Factor | Low | High | Unit |
|---|
fetch_min_bytes | 1 | 1048576 | bytes |
max_poll_records | 100 | 5000 | records |
num_consumers | 1 | 12 | count |
session_timeout | 6000 | 45000 | ms |
Fixed: partitions = 12, replication_factor = 3
Responses
| Response | Direction | Unit |
|---|
throughput_mbps | ↑ maximize | MB/s |
consumer_lag | ↓ minimize | records |
Configuration
{
"metadata": {
"name": "Message Queue Consumer Tuning",
"description": "Latin Hypercube exploration of 4 Kafka consumer parameters for throughput and lag"
},
"factors": [
{
"name": "fetch_min_bytes",
"levels": [
"1",
"1048576"
],
"type": "continuous",
"unit": "bytes"
},
{
"name": "max_poll_records",
"levels": [
"100",
"5000"
],
"type": "continuous",
"unit": "records"
},
{
"name": "num_consumers",
"levels": [
"1",
"12"
],
"type": "continuous",
"unit": "count"
},
{
"name": "session_timeout",
"levels": [
"6000",
"45000"
],
"type": "continuous",
"unit": "ms"
}
],
"fixed_factors": {
"partitions": "12",
"replication_factor": "3"
},
"responses": [
{
"name": "throughput_mbps",
"optimize": "maximize",
"unit": "MB/s"
},
{
"name": "consumer_lag",
"optimize": "minimize",
"unit": "records"
}
],
"settings": {
"operation": "latin_hypercube",
"test_script": "use_cases/36_message_queue_consumer/sim.sh"
}
}
Experimental Matrix
The Latin Hypercube Design produces 10 runs. Each row is one experiment with specific factor settings.
| Run | fetch_min_bytes | max_poll_records | num_consumers | session_timeout |
|---|
| 1 | 986235 | 1075.86 | 7.47733 | 41717.7 |
| 2 | 920030 | 3801.11 | 8.72204 | 9906.16 |
| 3 | 830968 | 2339.27 | 11.8311 | 6732.94 |
| 4 | 58843.3 | 1660.44 | 1.27799 | 30255.8 |
| 5 | 141574 | 4320.66 | 6.08947 | 37036.4 |
| 6 | 242682 | 4643.54 | 4.16848 | 14297.4 |
| 7 | 549392 | 115.015 | 10.6907 | 40944.8 |
| 8 | 447946 | 2984.3 | 2.8737 | 23822.4 |
| 9 | 716869 | 3150.88 | 8.31272 | 26845.4 |
| 10 | 343136 | 1091.19 | 5.13086 | 18621.8 |
Step-by-Step Workflow
1
Preview the design
$ doe info --config use_cases/36_message_queue_consumer/config.json
2
Generate the runner script
$ doe generate --config use_cases/36_message_queue_consumer/config.json \
--output use_cases/36_message_queue_consumer/results/run.sh --seed 42
3
Execute the experiments
$ bash use_cases/36_message_queue_consumer/results/run.sh
4
Analyze results
$ doe analyze --config use_cases/36_message_queue_consumer/config.json
5
Get optimization recommendations
$ doe optimize --config use_cases/36_message_queue_consumer/config.json
6
Multi-objective optimization
With 2 competing responses, use --multi to find the best compromise via Derringer–Suich desirability.
$ doe optimize --config use_cases/36_message_queue_consumer/config.json --multi
7
Generate the HTML report
$ doe report --config use_cases/36_message_queue_consumer/config.json \
--output use_cases/36_message_queue_consumer/results/report.html
Features Exercised
| Feature | Value |
|---|
| Design type | latin_hypercube |
| Factor types | continuous (all 4) |
| Arg style | double-dash |
| Responses | 2 (throughput_mbps ↑, consumer_lag ↓) |
| Total runs | 10 |
Analysis Results
Generated from actual experiment runs using the DOE Helper Tool.
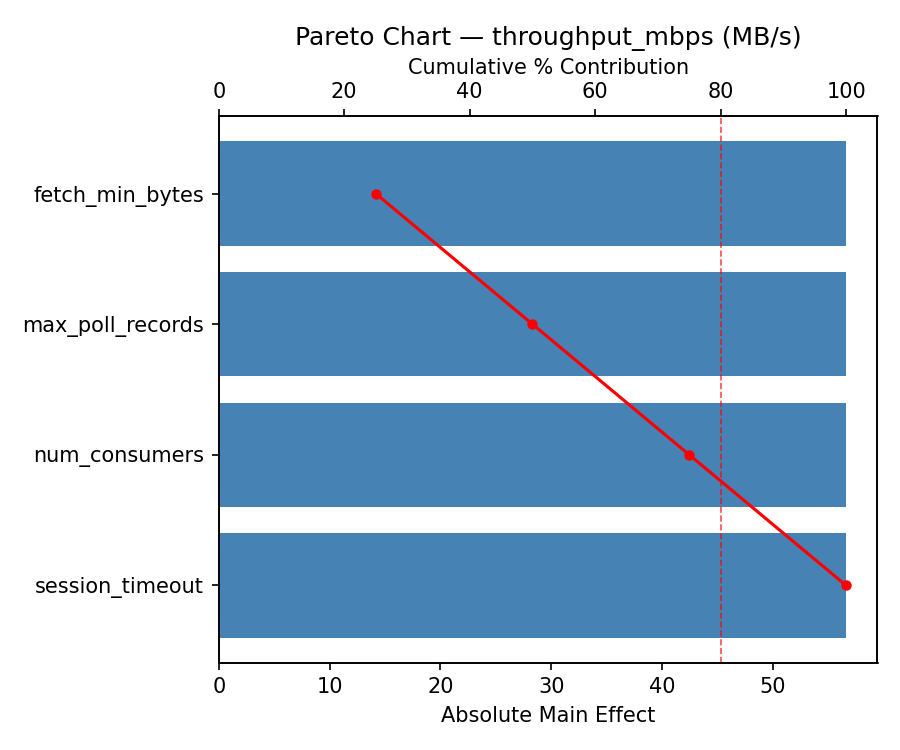
Response: throughput_mbps
Top factors: fetch_min_bytes (25.0%), max_poll_records (25.0%), num_consumers (25.0%).
ANOVA
| Source | DF | SS | MS | F | p-value |
|---|
| Source | DF | SS | MS | F | p-value |
| fetch_min_bytes | 9 | 3545.0040 | 393.8893 | | |
| max_poll_records | 9 | 3545.0040 | 393.8893 | | |
| num_consumers | 9 | 3545.0040 | 393.8893 | | |
| session_timeout | 9 | 3545.0040 | 393.8893 | | |
| Error | (Lenth | PSE) | 0 | 0.0000 | 0.0000 |
| Total | 9 | 3545.0040 | 393.8893 | | |
Pareto Chart
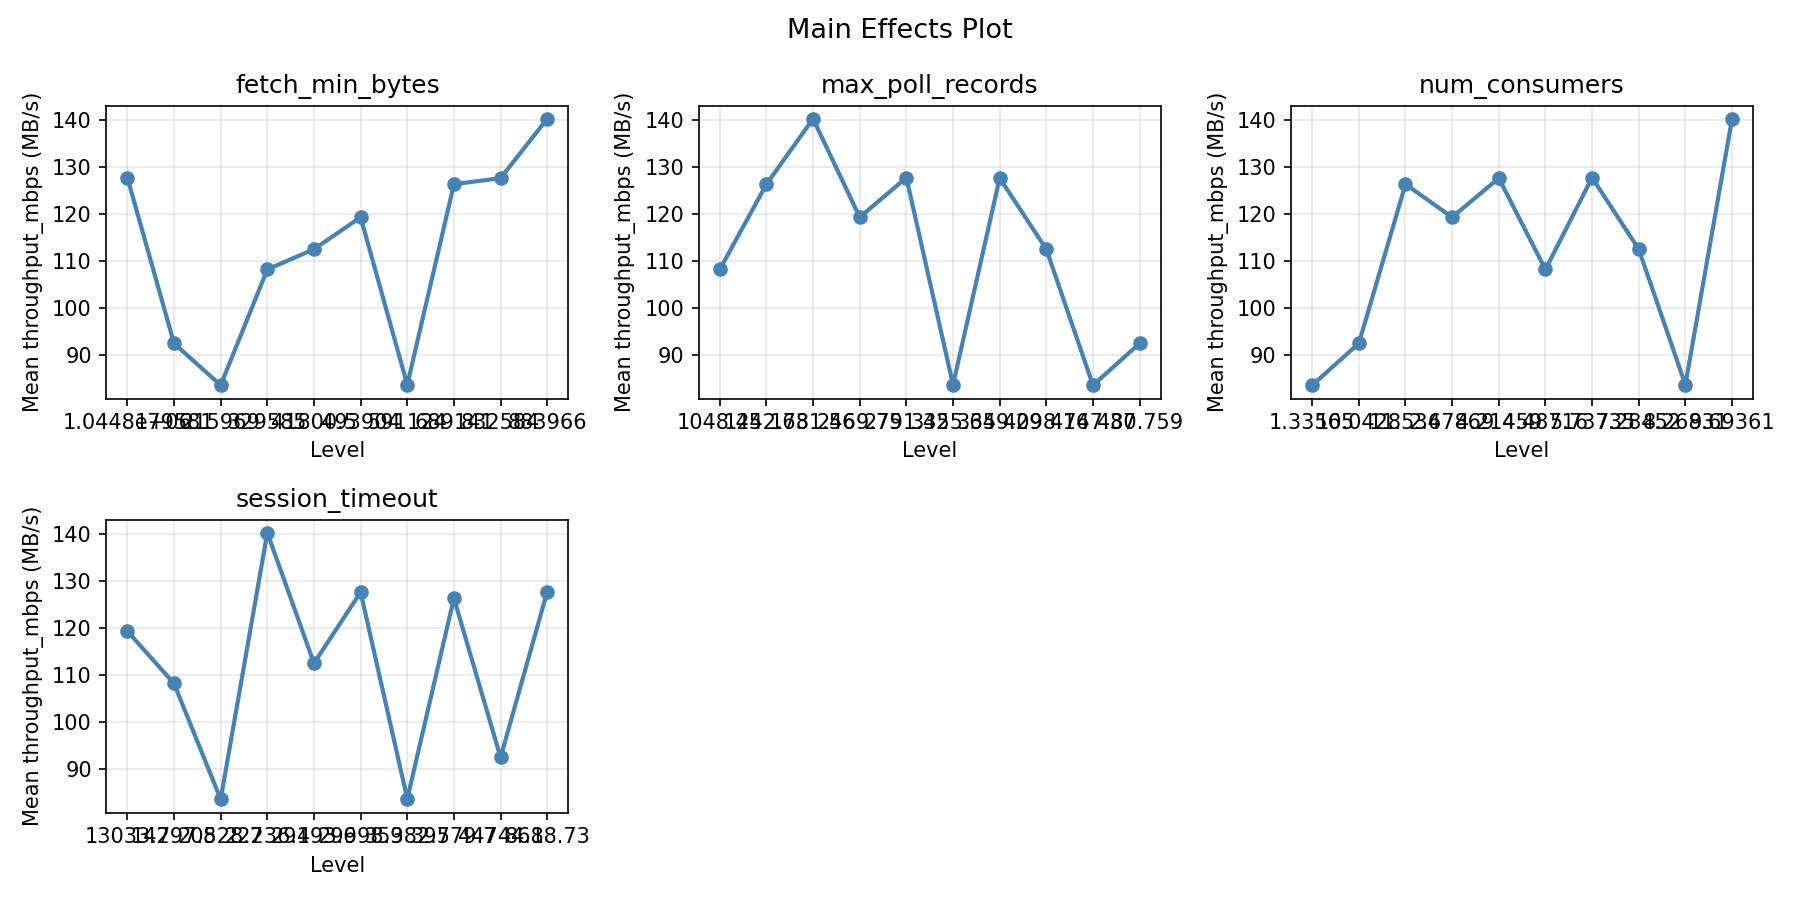
Main Effects Plot
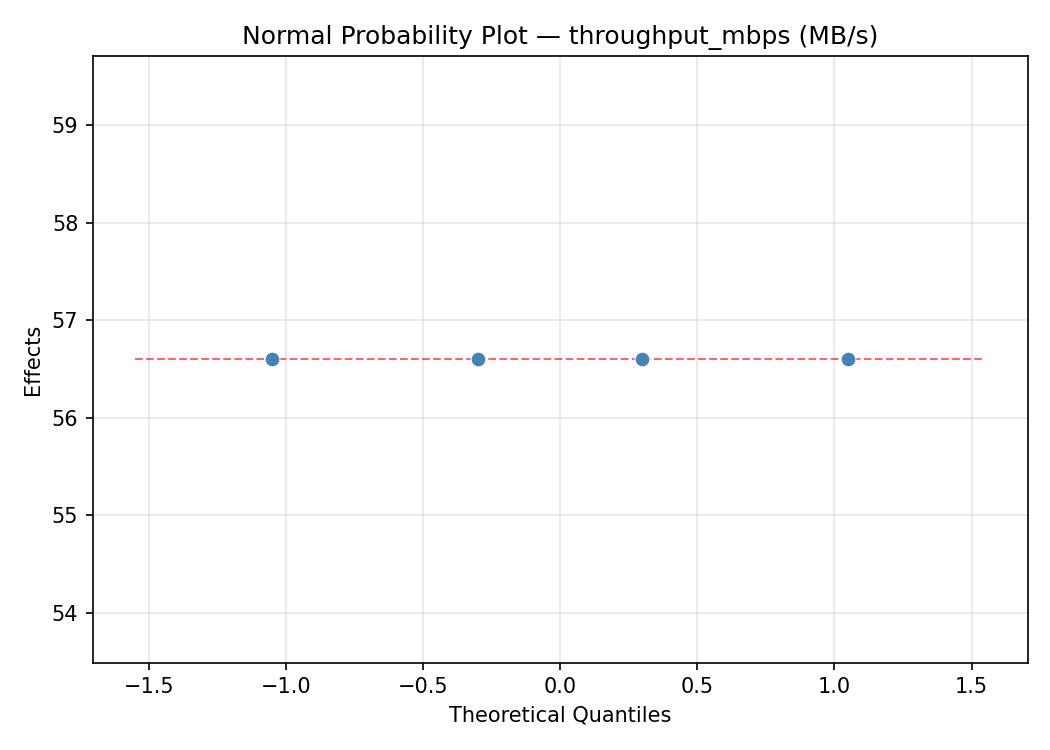
Normal Probability Plot of Effects
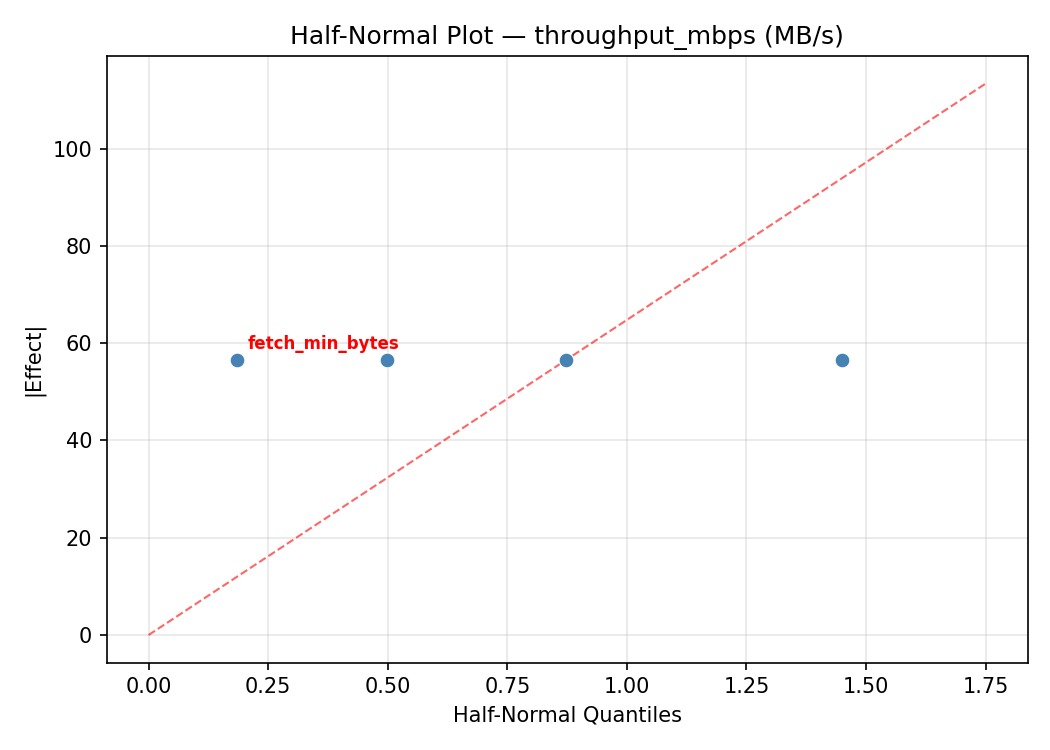
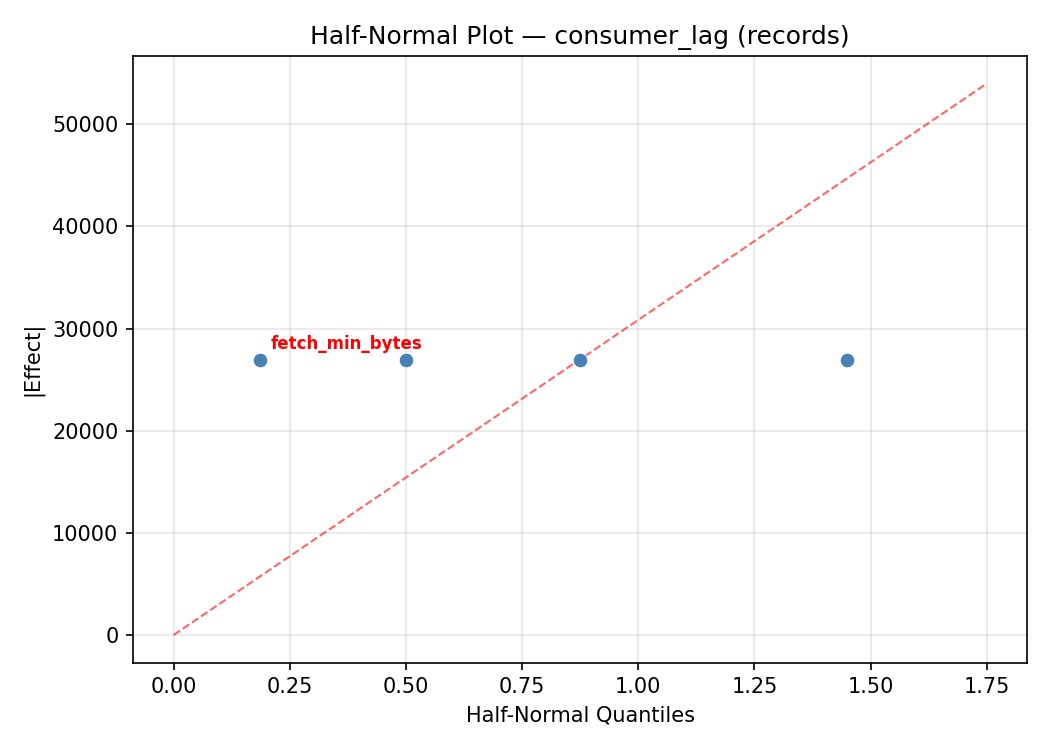
Half-Normal Plot of Effects
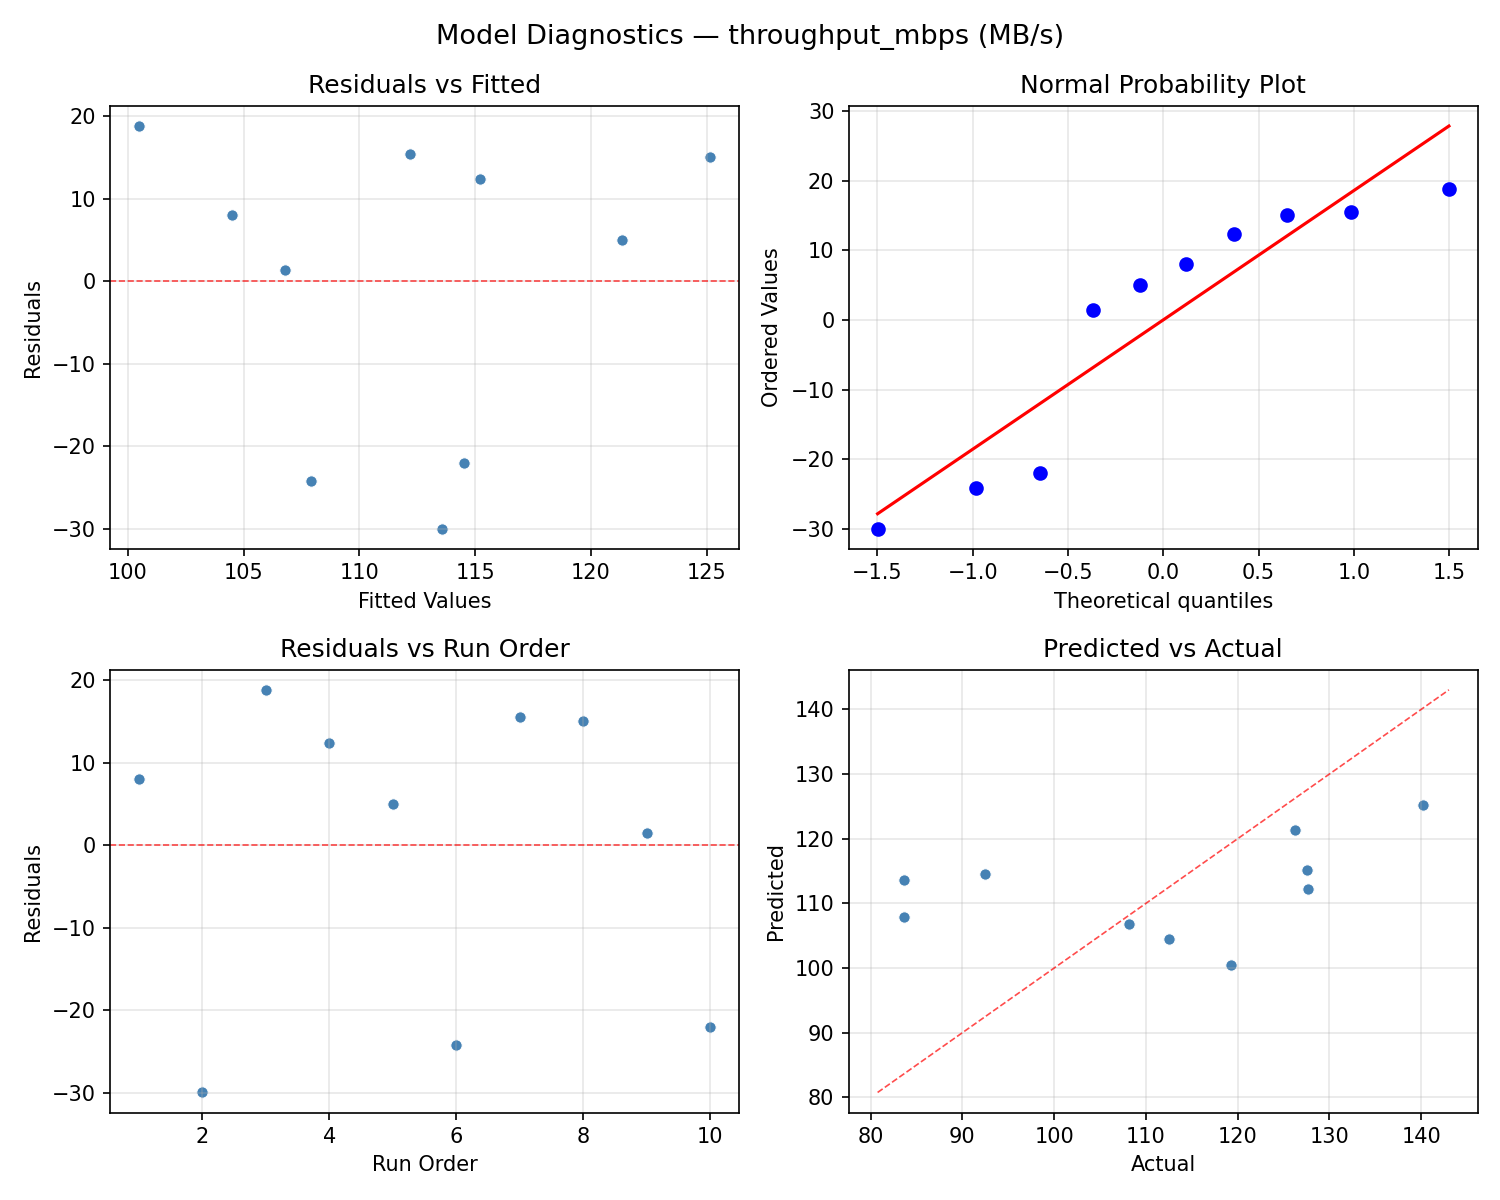
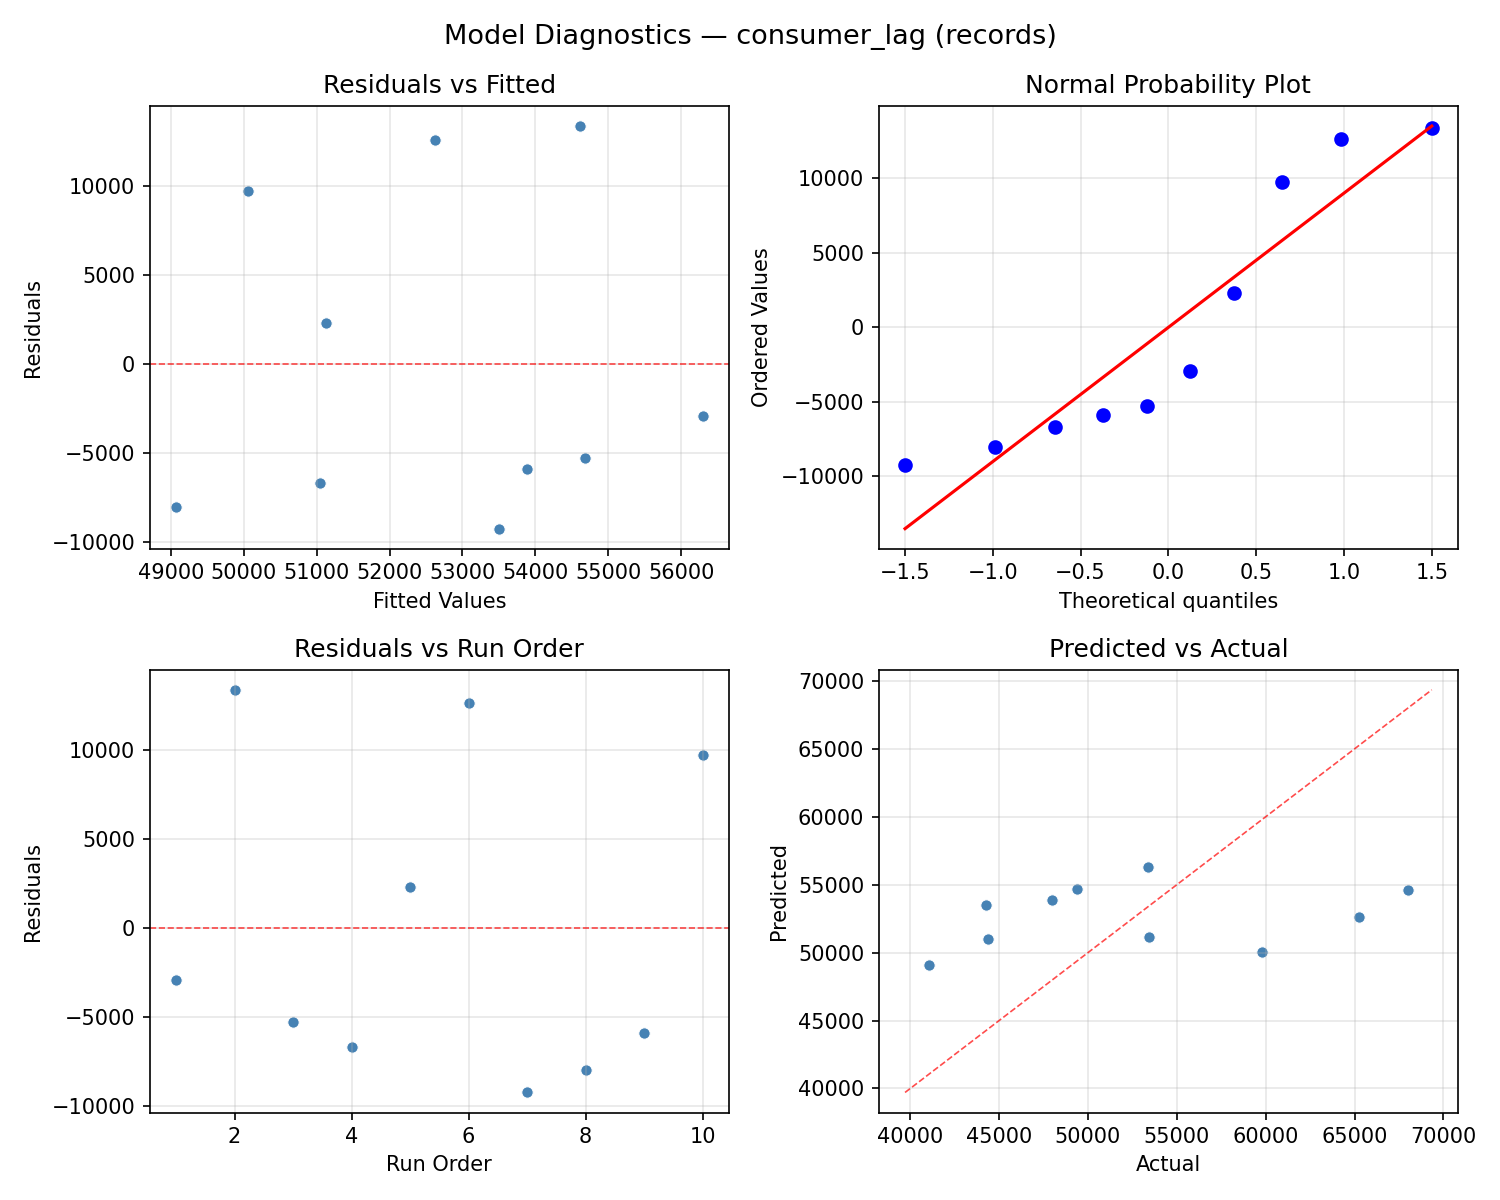
Model Diagnostics
Response: consumer_lag
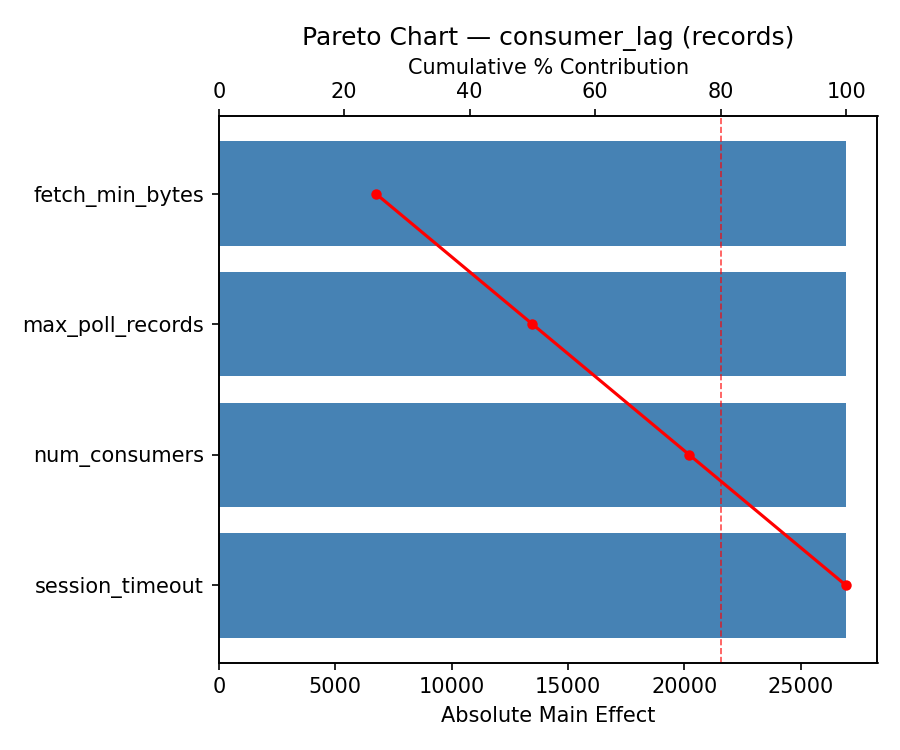
Top factors: fetch_min_bytes (25.0%), max_poll_records (25.0%), num_consumers (25.0%).
ANOVA
| Source | DF | SS | MS | F | p-value |
|---|
| Source | DF | SS | MS | F | p-value |
| fetch_min_bytes | 9 | 752536281.6000 | 83615142.4000 | | |
| max_poll_records | 9 | 752536281.6000 | 83615142.4000 | | |
| num_consumers | 9 | 752536281.6000 | 83615142.4000 | | |
| session_timeout | 9 | 752536281.6000 | 83615142.4000 | | |
| Error | (Lenth | PSE) | 0 | 0.0000 | 0.0000 |
| Total | 9 | 752536281.6000 | 83615142.4000 | | |
Pareto Chart
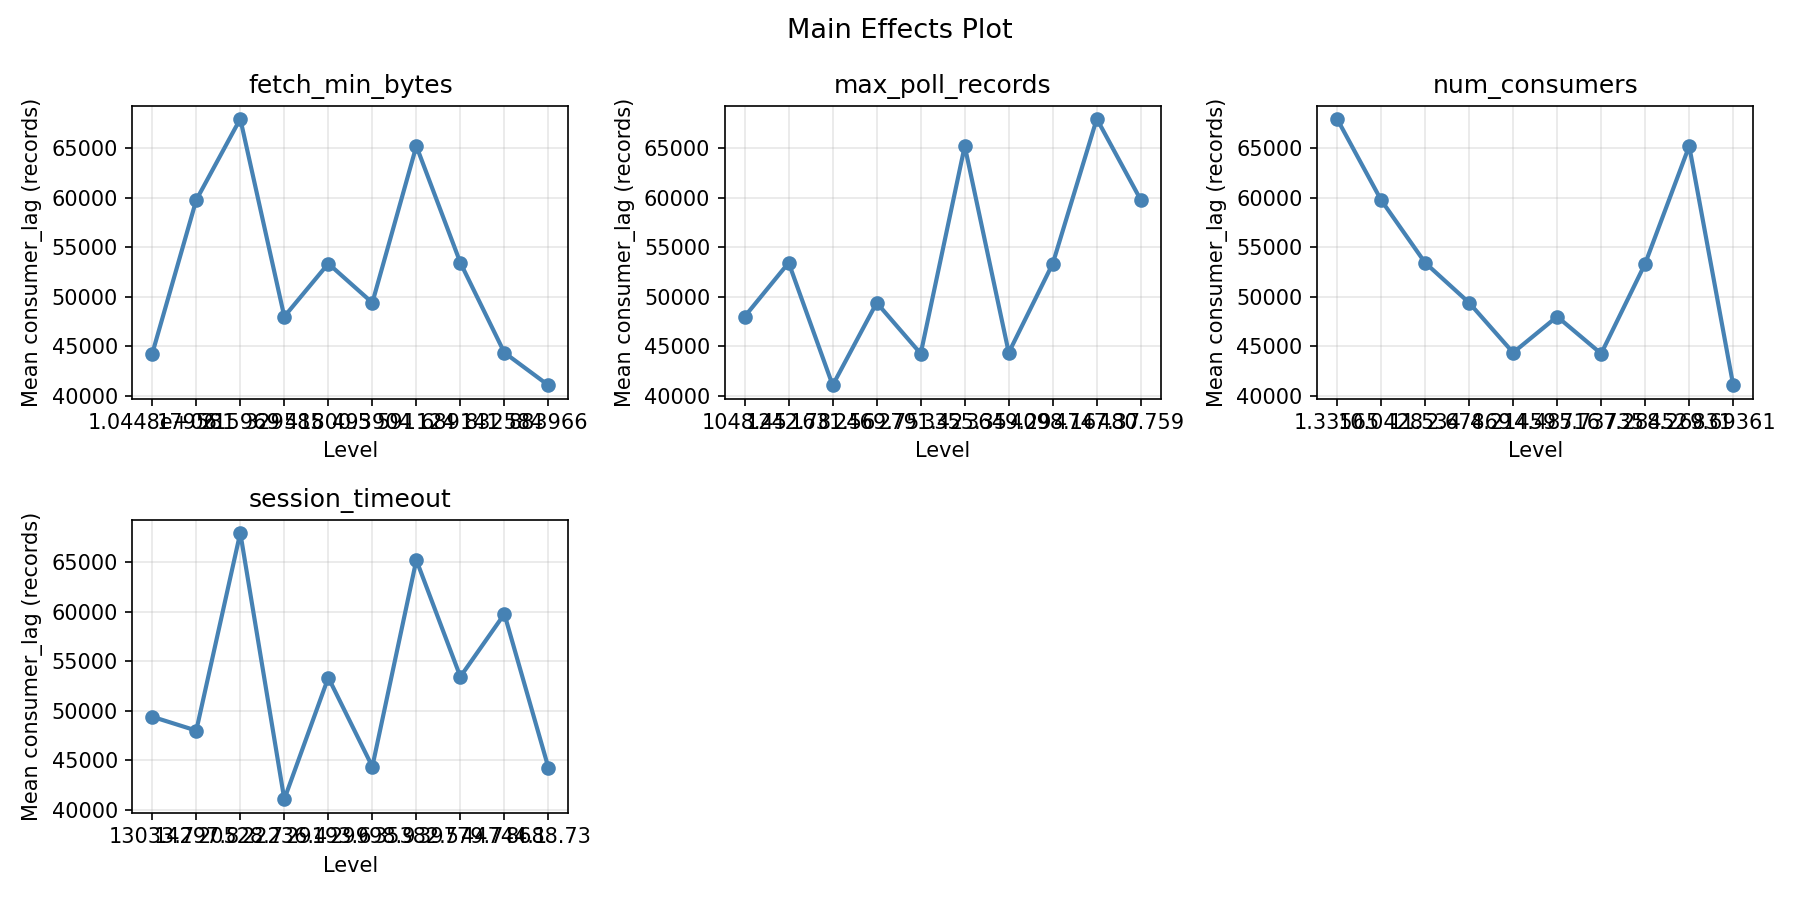
Main Effects Plot
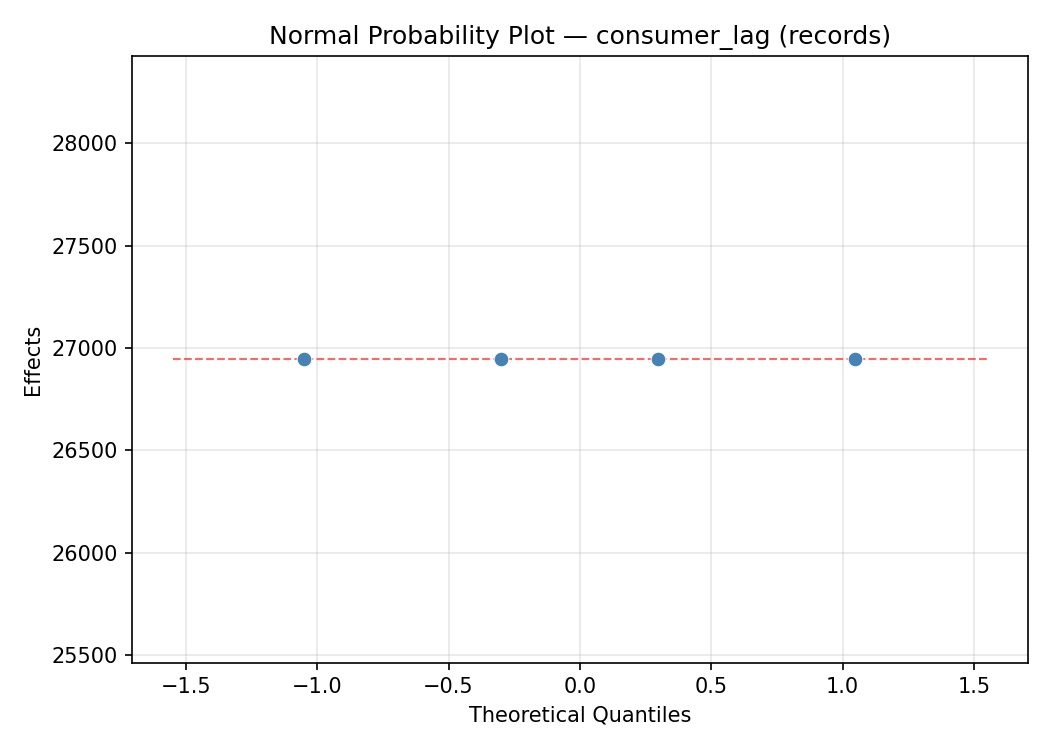
Normal Probability Plot of Effects
Half-Normal Plot of Effects
Model Diagnostics
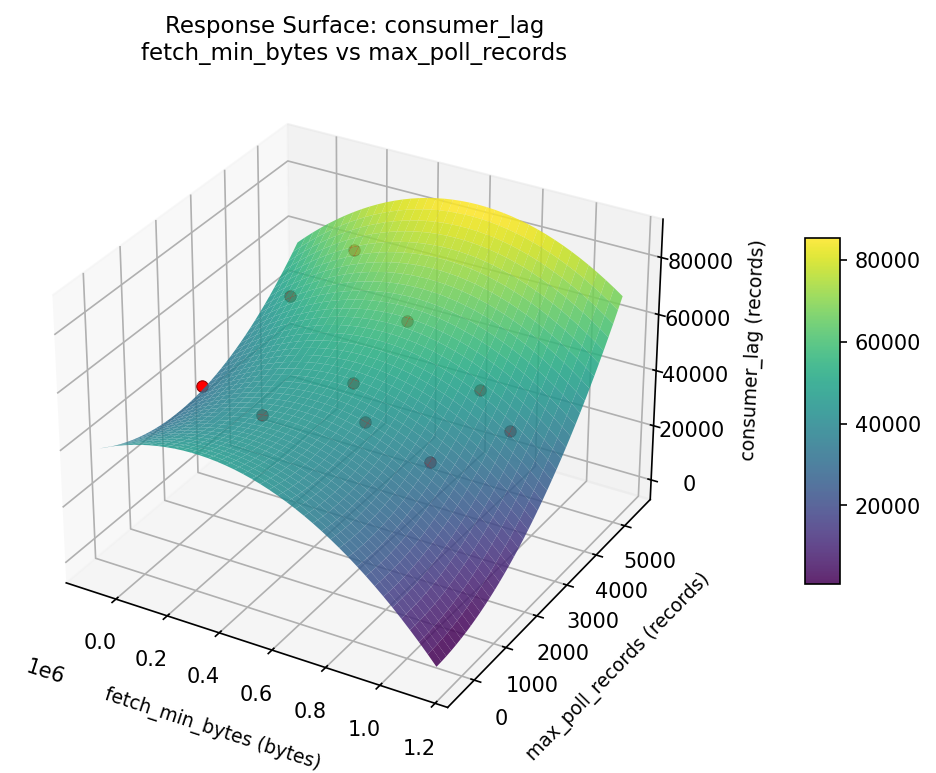
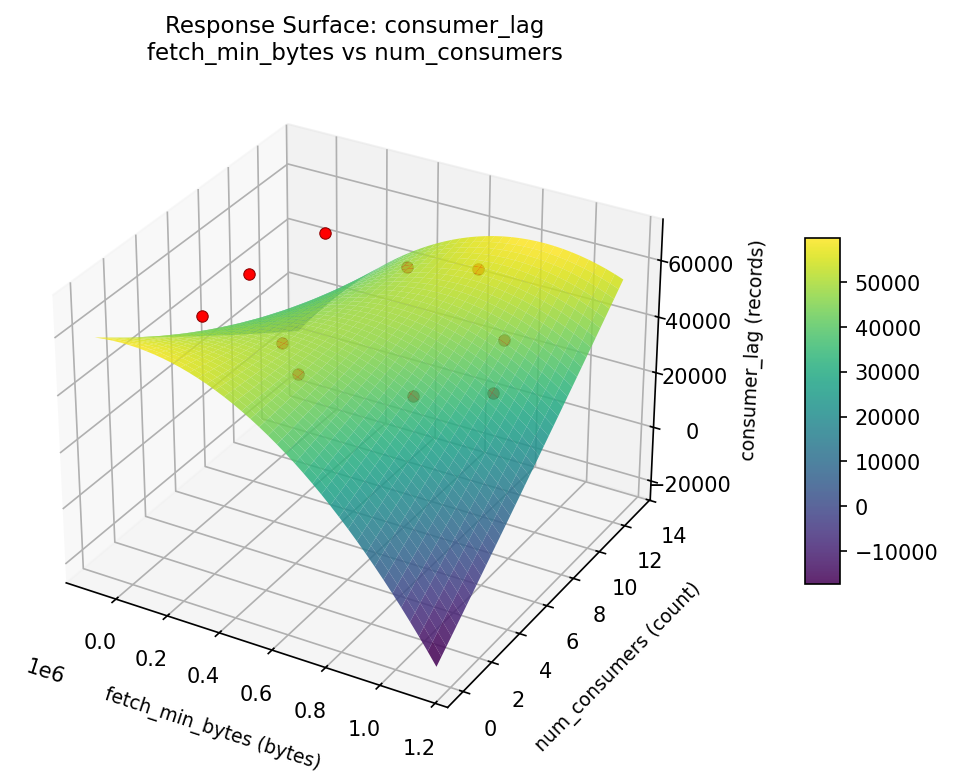
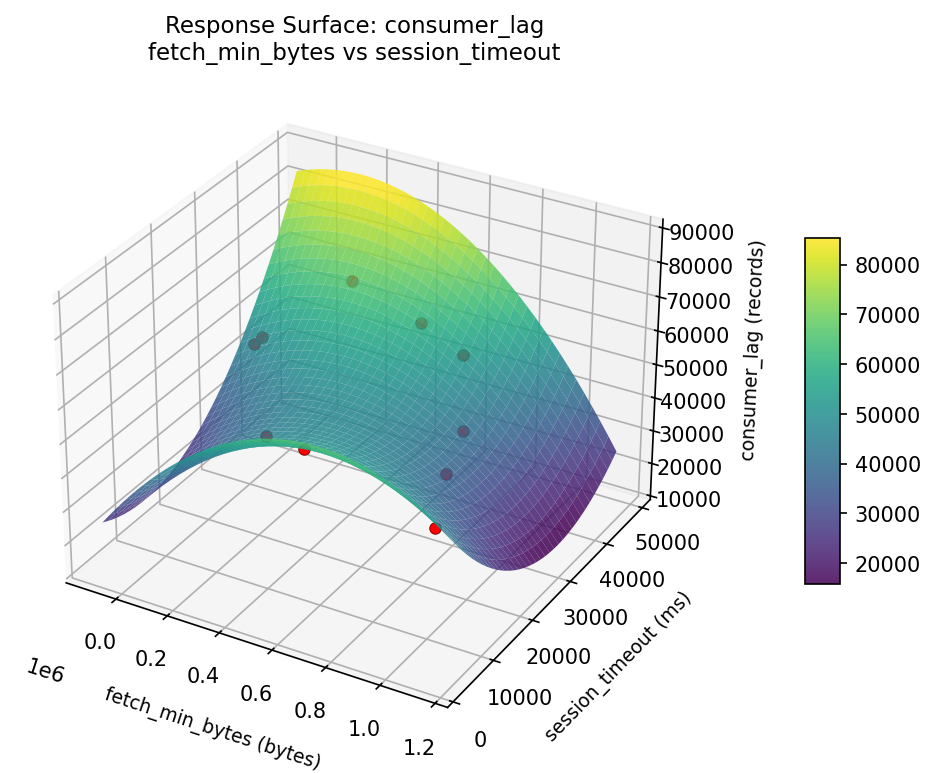
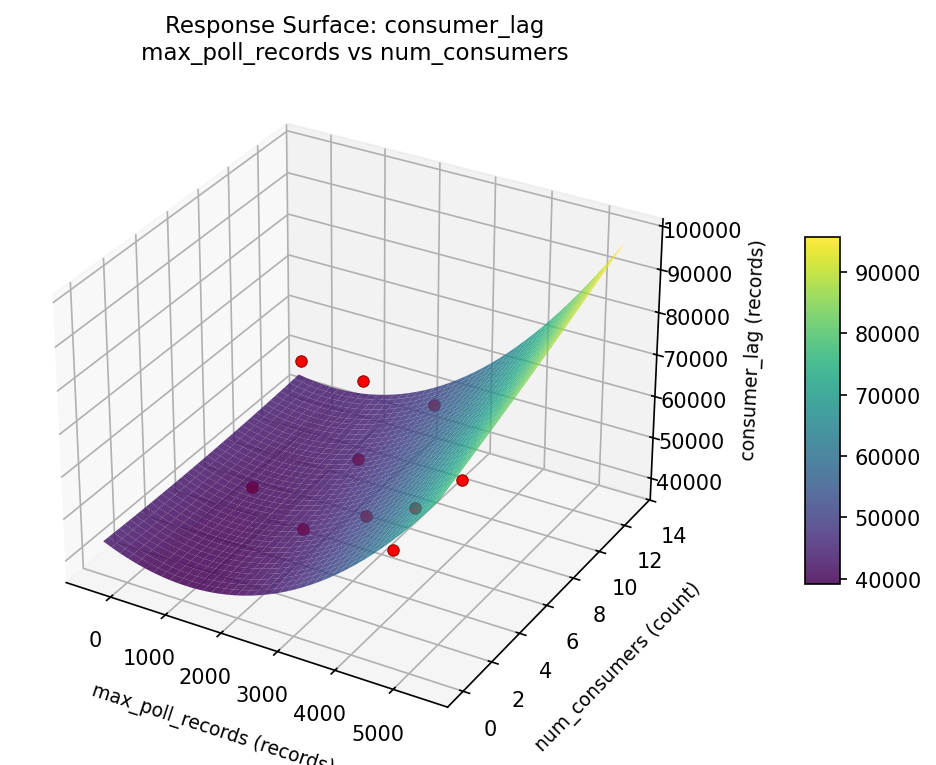
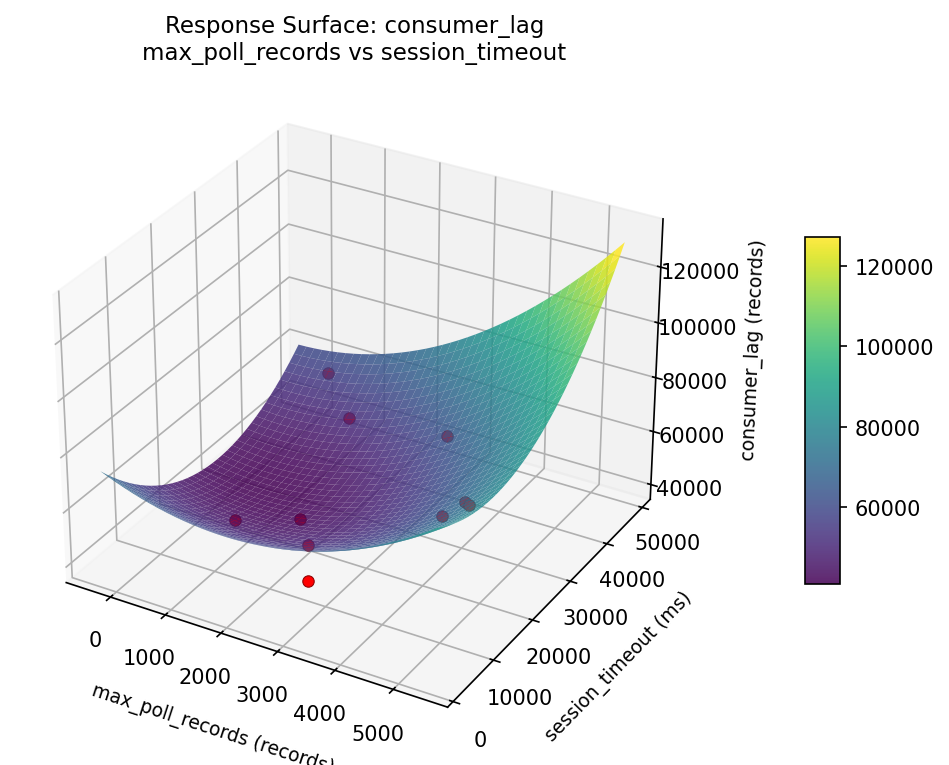
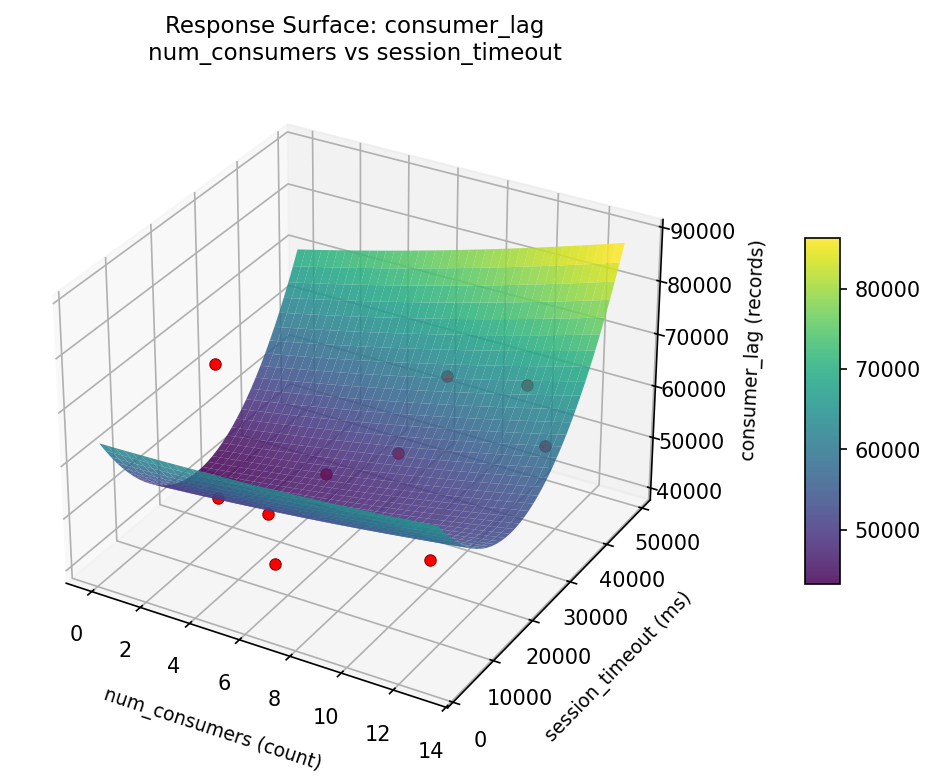
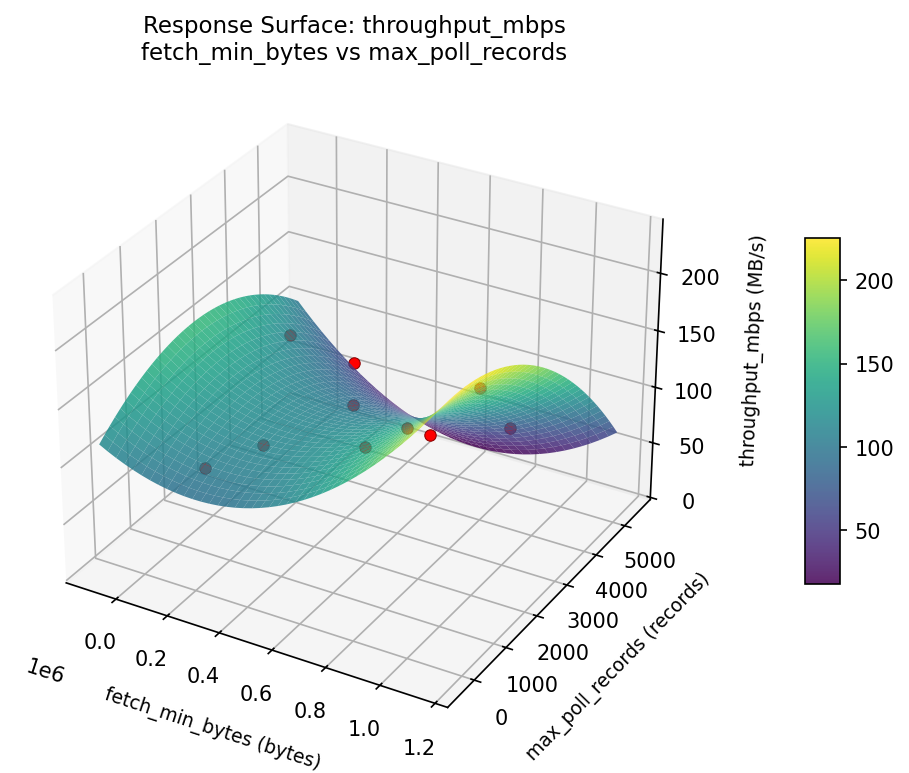
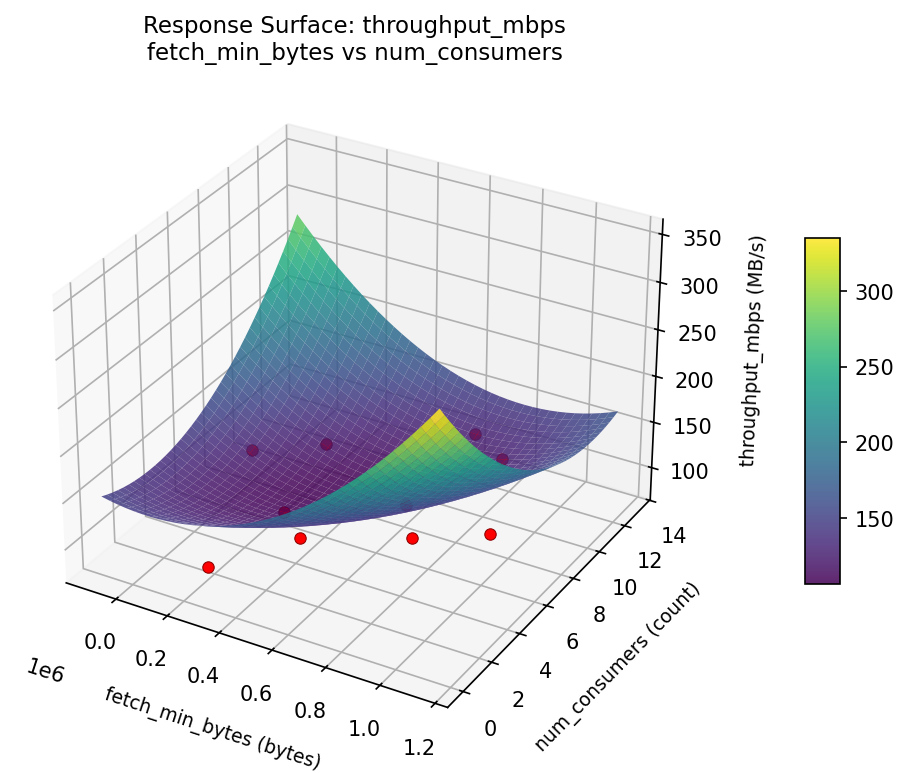
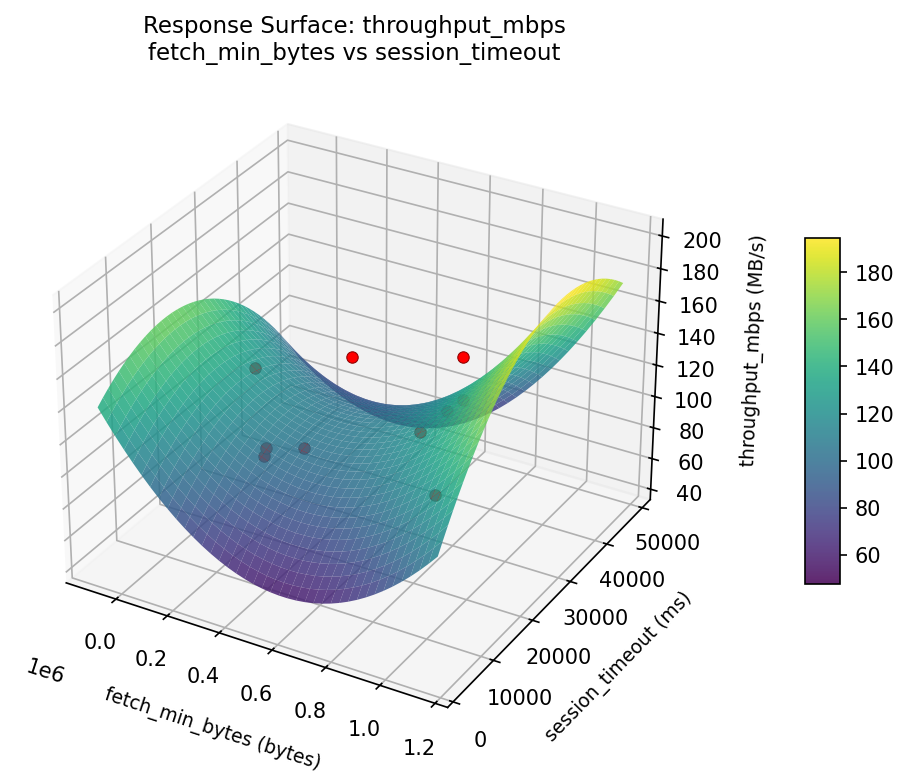
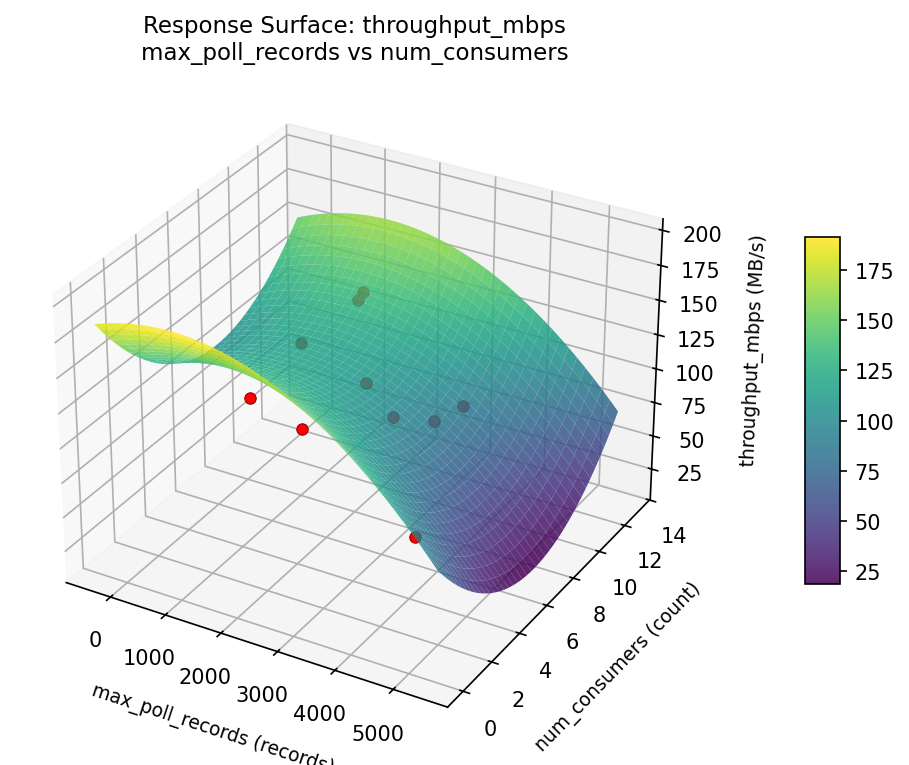
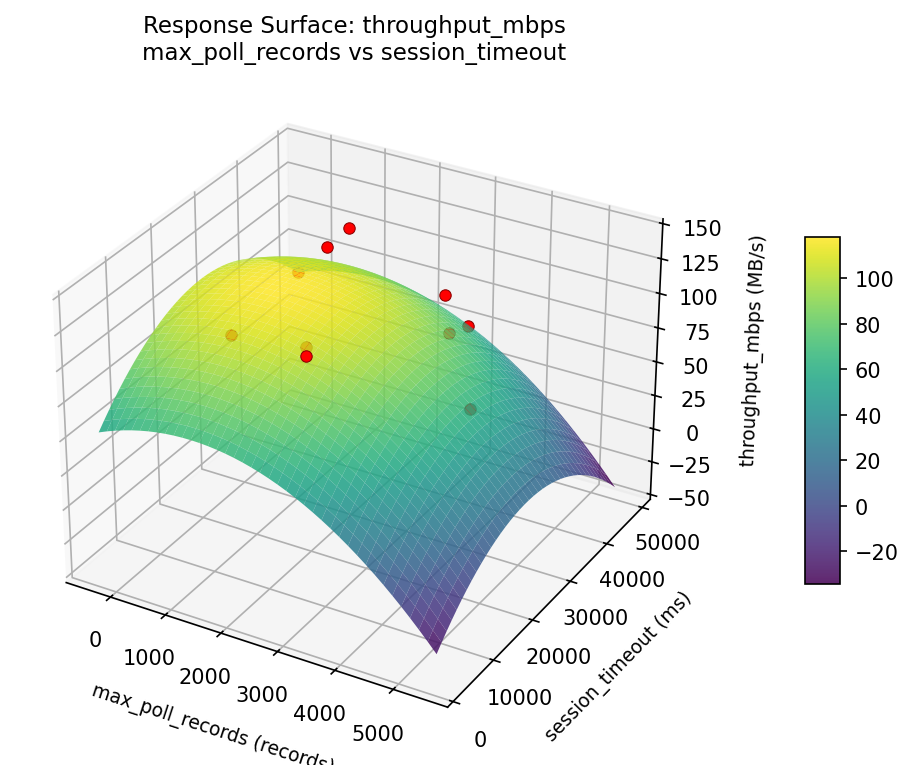
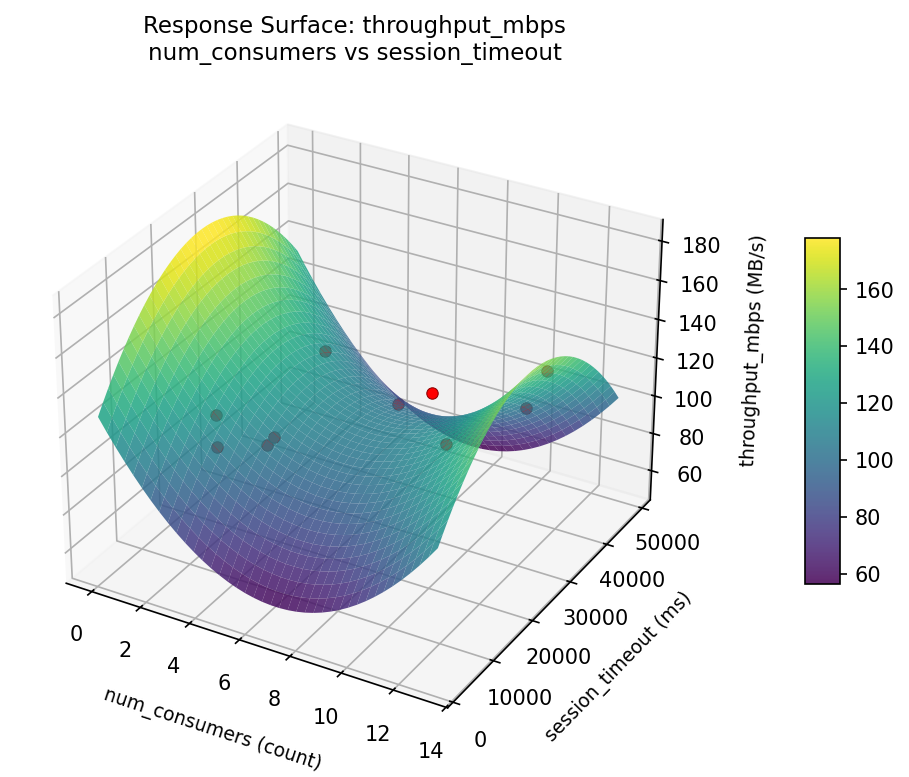
Response Surface Plots
3D surfaces fitted with quadratic RSM. Red dots are observed data points.
consumer lag fetch min bytes vs max poll records
consumer lag fetch min bytes vs num consumers
consumer lag fetch min bytes vs session timeout
consumer lag max poll records vs num consumers
consumer lag max poll records vs session timeout
consumer lag num consumers vs session timeout
throughput mbps fetch min bytes vs max poll records
throughput mbps fetch min bytes vs num consumers
throughput mbps fetch min bytes vs session timeout
throughput mbps max poll records vs num consumers
throughput mbps max poll records vs session timeout
throughput mbps num consumers vs session timeout
Multi-Objective Optimization
When responses compete, Derringer–Suich desirability finds the best compromise.
Each response is scaled to a 0–1 desirability, then combined via a weighted geometric mean.
Overall Desirability
D = 1.0000
Per-Response Desirability
| Response | Weight | Desirability | Predicted | Dir |
|---|
throughput_mbps |
1.5 |
|
153.79 1.0000 153.79 MB/s |
↑ |
consumer_lag |
1.0 |
|
36100.05 1.0000 36100.05 records |
↓ |
Recommended Settings
| Factor | Value |
|---|
fetch_min_bytes | 9.852e+05 bytes |
max_poll_records | 4770 records |
num_consumers | 9.231 count |
session_timeout | 2.643e+04 ms |
Source: from RSM model prediction
Trade-off Summary
Sacrifice = how much worse than single-objective best.
| Response | Predicted | Best Observed | Sacrifice |
|---|
consumer_lag | 36100.05 | 41053.00 | -4952.95 |
Top 3 Runs by Desirability
| Run | D | Factor Settings |
|---|
| #7 | 0.7896 | fetch_min_bytes=454005, max_poll_records=4632.03, num_consumers=9.17463, session_timeout=41435.9 |
| #4 | 0.7874 | fetch_min_bytes=799475, max_poll_records=311.355, num_consumers=10.5724, session_timeout=18028.1 |
Model Quality
| Response | R² | Type |
|---|
consumer_lag | 0.5716 | linear |
Full Multi-Objective Output
============================================================
MULTI-OBJECTIVE OPTIMIZATION
Method: Derringer-Suich Desirability Function
============================================================
Overall desirability: D = 1.0000
Response Weight Desirability Predicted Direction
---------------------------------------------------------------------
throughput_mbps 1.5 1.0000 153.79 MB/s ↑
consumer_lag 1.0 1.0000 36100.05 records ↓
Recommended settings:
fetch_min_bytes = 9.852e+05 bytes
max_poll_records = 4770 records
num_consumers = 9.231 count
session_timeout = 2.643e+04 ms
(from RSM model prediction)
Trade-off summary:
throughput_mbps: 153.79 (best observed: 140.20, sacrifice: -13.59)
consumer_lag: 36100.05 (best observed: 41053.00, sacrifice: -4952.95)
Model quality:
throughput_mbps: R² = 0.7799 (linear)
consumer_lag: R² = 0.5716 (linear)
Top 3 observed runs by overall desirability:
1. Run #8 (D=0.9545): fetch_min_bytes=870780, max_poll_records=885.544, num_consumers=8.09972, session_timeout=40153.6
2. Run #7 (D=0.7896): fetch_min_bytes=454005, max_poll_records=4632.03, num_consumers=9.17463, session_timeout=41435.9
3. Run #4 (D=0.7874): fetch_min_bytes=799475, max_poll_records=311.355, num_consumers=10.5724, session_timeout=18028.1
Full Analysis Output
=== Main Effects: throughput_mbps ===
Factor Effect Std Error % Contribution
--------------------------------------------------------------
fetch_min_bytes 56.6000 6.2761 25.0%
max_poll_records 56.6000 6.2761 25.0%
num_consumers 56.6000 6.2761 25.0%
session_timeout 56.6000 6.2761 25.0%
=== ANOVA Table: throughput_mbps ===
Source DF SS MS F p-value
-----------------------------------------------------------------------------
fetch_min_bytes 9 3545.0040 393.8893
max_poll_records 9 3545.0040 393.8893
num_consumers 9 3545.0040 393.8893
session_timeout 9 3545.0040 393.8893
Error (Lenth PSE) 0 0.0000 0.0000
Total 9 3545.0040 393.8893
Note: Error estimated using Lenth's pseudo-standard-error (unreplicated design)
=== Summary Statistics: throughput_mbps ===
fetch_min_bytes:
Level N Mean Std Min Max
------------------------------------------------------------
1.0336e+06 1 119.3000 0.0000 119.3000 119.3000
15356.2 1 127.7000 0.0000 127.7000 127.7000
163954 1 140.2000 0.0000 140.2000 140.2000
299933 1 83.6000 0.0000 83.6000 83.6000
380045 1 92.5000 0.0000 92.5000 92.5000
520612 1 127.6000 0.0000 127.6000 127.6000
609944 1 108.2000 0.0000 108.2000 108.2000
698210 1 83.7000 0.0000 83.7000 83.7000
757530 1 112.5000 0.0000 112.5000 112.5000
892524 1 126.3000 0.0000 126.3000 126.3000
max_poll_records:
Level N Mean Std Min Max
------------------------------------------------------------
1319.92 1 127.6000 0.0000 127.6000 127.6000
1574.92 1 126.3000 0.0000 126.3000 126.3000
2085.21 1 83.6000 0.0000 83.6000 83.6000
220.517 1 108.2000 0.0000 108.2000 108.2000
2733.33 1 140.2000 0.0000 140.2000 140.2000
3360.07 1 83.7000 0.0000 83.7000 83.7000
3813.25 1 127.7000 0.0000 127.7000 127.7000
4156.63 1 112.5000 0.0000 112.5000 112.5000
4871.73 1 92.5000 0.0000 92.5000 92.5000
878.977 1 119.3000 0.0000 119.3000 119.3000
num_consumers:
Level N Mean Std Min Max
------------------------------------------------------------
1.79478 1 83.7000 0.0000 83.7000 83.7000
10.3309 1 83.6000 0.0000 83.6000 83.6000
11.5825 1 127.7000 0.0000 127.7000 127.7000
3.09512 1 92.5000 0.0000 92.5000 92.5000
4.04136 1 126.3000 0.0000 126.3000 126.3000
5.16223 1 127.6000 0.0000 127.6000 127.6000
6.31549 1 119.3000 0.0000 119.3000 119.3000
7.37684 1 140.2000 0.0000 140.2000 140.2000
7.69578 1 112.5000 0.0000 112.5000 112.5000
8.75552 1 108.2000 0.0000 108.2000 108.2000
session_timeout:
Level N Mean Std Min Max
------------------------------------------------------------
12852 1 83.7000 0.0000 83.7000 83.7000
16963.7 1 127.6000 0.0000 127.6000 127.6000
20531.3 1 83.6000 0.0000 83.6000 83.6000
21757.5 1 108.2000 0.0000 108.2000 108.2000
25760.8 1 112.5000 0.0000 112.5000 112.5000
31653.8 1 140.2000 0.0000 140.2000 140.2000
36484.3 1 127.7000 0.0000 127.7000 127.7000
39865.3 1 92.5000 0.0000 92.5000 92.5000
43991 1 119.3000 0.0000 119.3000 119.3000
7673.13 1 126.3000 0.0000 126.3000 126.3000
=== Main Effects: consumer_lag ===
Factor Effect Std Error % Contribution
--------------------------------------------------------------
fetch_min_bytes 26945.0000 2891.6283 25.0%
max_poll_records 26945.0000 2891.6283 25.0%
num_consumers 26945.0000 2891.6283 25.0%
session_timeout 26945.0000 2891.6283 25.0%
=== ANOVA Table: consumer_lag ===
Source DF SS MS F p-value
-----------------------------------------------------------------------------
fetch_min_bytes 9 752536281.6000 83615142.4000
max_poll_records 9 752536281.6000 83615142.4000
num_consumers 9 752536281.6000 83615142.4000
session_timeout 9 752536281.6000 83615142.4000
Error (Lenth PSE) 0 0.0000 0.0000
Total 9 752536281.6000 83615142.4000
Note: Error estimated using Lenth's pseudo-standard-error (unreplicated design)
=== Summary Statistics: consumer_lag ===
fetch_min_bytes:
Level N Mean Std Min Max
------------------------------------------------------------
1.0336e+06 1 49398.0000 0.0000 49398.0000 49398.0000
15356.2 1 44250.0000 0.0000 44250.0000 44250.0000
163954 1 41053.0000 0.0000 41053.0000 41053.0000
299933 1 67998.0000 0.0000 67998.0000 67998.0000
380045 1 59790.0000 0.0000 59790.0000 59790.0000
520612 1 44350.0000 0.0000 44350.0000 44350.0000
609944 1 47997.0000 0.0000 47997.0000 47997.0000
698210 1 65248.0000 0.0000 65248.0000 65248.0000
757530 1 53359.0000 0.0000 53359.0000 53359.0000
892524 1 53445.0000 0.0000 53445.0000 53445.0000
max_poll_records:
Level N Mean Std Min Max
------------------------------------------------------------
1319.92 1 44350.0000 0.0000 44350.0000 44350.0000
1574.92 1 53445.0000 0.0000 53445.0000 53445.0000
2085.21 1 67998.0000 0.0000 67998.0000 67998.0000
220.517 1 47997.0000 0.0000 47997.0000 47997.0000
2733.33 1 41053.0000 0.0000 41053.0000 41053.0000
3360.07 1 65248.0000 0.0000 65248.0000 65248.0000
3813.25 1 44250.0000 0.0000 44250.0000 44250.0000
4156.63 1 53359.0000 0.0000 53359.0000 53359.0000
4871.73 1 59790.0000 0.0000 59790.0000 59790.0000
878.977 1 49398.0000 0.0000 49398.0000 49398.0000
num_consumers:
Level N Mean Std Min Max
------------------------------------------------------------
1.79478 1 65248.0000 0.0000 65248.0000 65248.0000
10.3309 1 67998.0000 0.0000 67998.0000 67998.0000
11.5825 1 44250.0000 0.0000 44250.0000 44250.0000
3.09512 1 59790.0000 0.0000 59790.0000 59790.0000
4.04136 1 53445.0000 0.0000 53445.0000 53445.0000
5.16223 1 44350.0000 0.0000 44350.0000 44350.0000
6.31549 1 49398.0000 0.0000 49398.0000 49398.0000
7.37684 1 41053.0000 0.0000 41053.0000 41053.0000
7.69578 1 53359.0000 0.0000 53359.0000 53359.0000
8.75552 1 47997.0000 0.0000 47997.0000 47997.0000
session_timeout:
Level N Mean Std Min Max
------------------------------------------------------------
12852 1 65248.0000 0.0000 65248.0000 65248.0000
16963.7 1 44350.0000 0.0000 44350.0000 44350.0000
20531.3 1 67998.0000 0.0000 67998.0000 67998.0000
21757.5 1 47997.0000 0.0000 47997.0000 47997.0000
25760.8 1 53359.0000 0.0000 53359.0000 53359.0000
31653.8 1 41053.0000 0.0000 41053.0000 41053.0000
36484.3 1 44250.0000 0.0000 44250.0000 44250.0000
39865.3 1 59790.0000 0.0000 59790.0000 59790.0000
43991 1 49398.0000 0.0000 49398.0000 49398.0000
7673.13 1 53445.0000 0.0000 53445.0000 53445.0000
Optimization Recommendations
=== Optimization: throughput_mbps ===
Direction: maximize
Best observed run: #8
fetch_min_bytes = 970069
max_poll_records = 3331.44
num_consumers = 4.31814
session_timeout = 12633.7
Value: 140.2
RSM Model (linear, R² = 0.5593, Adj R² = 0.2067):
Coefficients:
intercept +112.2549
fetch_min_bytes +13.0494
max_poll_records -18.7241
num_consumers -13.1177
session_timeout -1.8402
Predicted optimum (from linear model, at observed points):
fetch_min_bytes = 510416
max_poll_records = 438.719
num_consumers = 3.95258
session_timeout = 33998.2
Predicted value: 133.3187
Surface optimum (via L-BFGS-B, linear model):
fetch_min_bytes = 1.04858e+06
max_poll_records = 100
num_consumers = 1
session_timeout = 6000
Predicted value: 158.9862
Model quality: Moderate fit — use predictions directionally, not precisely.
Factor importance:
1. fetch_min_bytes (effect: 56.6, contribution: 25.0%)
2. max_poll_records (effect: 56.6, contribution: 25.0%)
3. num_consumers (effect: 56.6, contribution: 25.0%)
4. session_timeout (effect: 56.6, contribution: 25.0%)
=== Optimization: consumer_lag ===
Direction: minimize
Best observed run: #8
fetch_min_bytes = 970069
max_poll_records = 3331.44
num_consumers = 4.31814
session_timeout = 12633.7
Value: 41053.0
RSM Model (linear, R² = 0.7825, Adj R² = 0.6085):
Coefficients:
intercept +52652.1380
fetch_min_bytes -6703.0612
max_poll_records +9372.9667
num_consumers +8354.2386
session_timeout +1202.9993
Predicted optimum (from linear model, at observed points):
fetch_min_bytes = 80107.4
max_poll_records = 2501.35
num_consumers = 11.0078
session_timeout = 17155.5
Predicted value: 64477.2543
Surface optimum (via L-BFGS-B, linear model):
fetch_min_bytes = 1.04858e+06
max_poll_records = 100
num_consumers = 1
session_timeout = 6000
Predicted value: 27018.8722
Model quality: Good fit — general trends are captured, some noise remains.
Factor importance:
1. fetch_min_bytes (effect: 26945.0, contribution: 25.0%)
2. max_poll_records (effect: 26945.0, contribution: 25.0%)
3. num_consumers (effect: 26945.0, contribution: 25.0%)
4. session_timeout (effect: 26945.0, contribution: 25.0%)