Summary
This experiment investigates tcp congestion control. Full factorial of congestion algorithm, initial window, buffer sizes, and ECN for throughput and fairness.
The design varies 4 factors: congestion algo, ranging from cubic to bbr, init cwnd (segments), ranging from 10 to 40, rmem max kb (KB), ranging from 256 to 4096, and ecn, ranging from off to on. The goal is to optimize 2 responses: throughput gbps (Gbps) (maximize) and retransmit pct (%) (minimize). Fixed conditions held constant across all runs include mtu = 1500, link speed = 10Gbps.
A full factorial design was used to explore all 16 possible combinations of the 4 factors at two levels. This guarantees that every main effect and interaction can be estimated independently, at the cost of a larger experiment (16 runs).
Quadratic response surface models were fitted to capture potential curvature and factor interactions. The RSM contour plots below visualize how pairs of factors jointly affect each response.
Key Findings
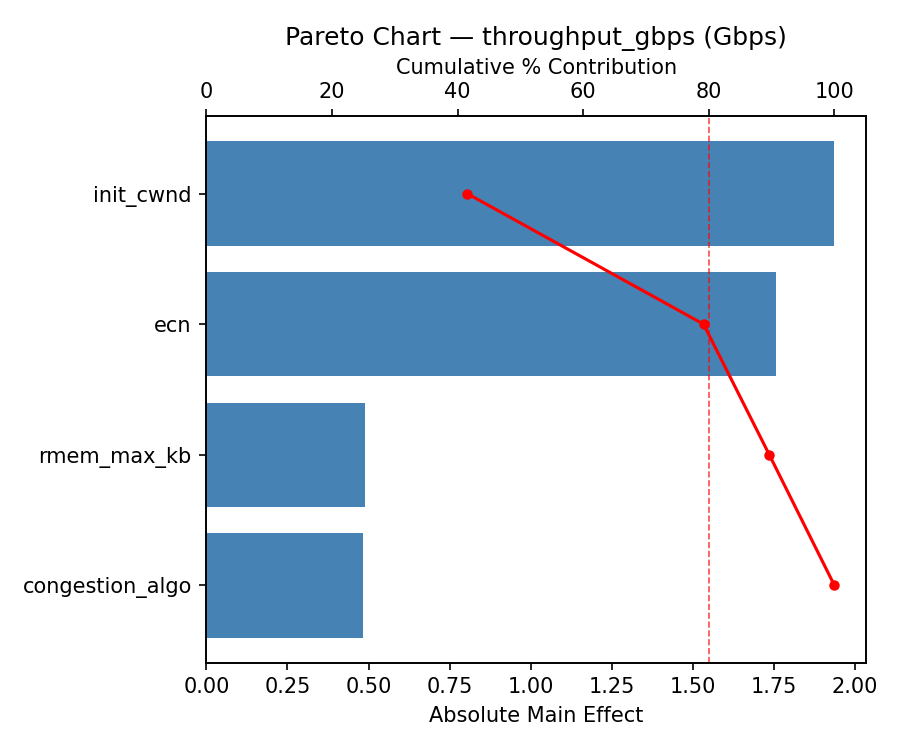
For throughput gbps, the most influential factors were init cwnd (31.9%), ecn (28.0%), rmem max kb (26.9%). The best observed value was 10.2 (at congestion algo = bbr, init cwnd = 40, rmem max kb = 4096).
For retransmit pct, the most influential factors were ecn (47.8%), init cwnd (27.2%), congestion algo (18.2%). The best observed value was 0.424 (at congestion algo = bbr, init cwnd = 10, rmem max kb = 256).
Recommended Next Steps
- Consider whether any fixed factors should be varied in a future study.
Experimental Setup
Factors
| Factor | Low | High | Unit |
|---|
congestion_algo | cubic | bbr | |
init_cwnd | 10 | 40 | segments |
rmem_max_kb | 256 | 4096 | KB |
ecn | off | on | |
Fixed: mtu = 1500, link_speed = 10Gbps
Responses
| Response | Direction | Unit |
|---|
throughput_gbps | ↑ maximize | Gbps |
retransmit_pct | ↓ minimize | % |
Configuration
{
"metadata": {
"name": "TCP Congestion Control",
"description": "Full factorial of congestion algorithm, initial window, buffer sizes, and ECN for throughput and fairness"
},
"factors": [
{
"name": "congestion_algo",
"levels": [
"cubic",
"bbr"
],
"type": "categorical",
"unit": ""
},
{
"name": "init_cwnd",
"levels": [
"10",
"40"
],
"type": "continuous",
"unit": "segments"
},
{
"name": "rmem_max_kb",
"levels": [
"256",
"4096"
],
"type": "continuous",
"unit": "KB"
},
{
"name": "ecn",
"levels": [
"off",
"on"
],
"type": "categorical",
"unit": ""
}
],
"fixed_factors": {
"mtu": "1500",
"link_speed": "10Gbps"
},
"responses": [
{
"name": "throughput_gbps",
"optimize": "maximize",
"unit": "Gbps"
},
{
"name": "retransmit_pct",
"optimize": "minimize",
"unit": "%"
}
],
"settings": {
"operation": "full_factorial",
"test_script": "use_cases/47_tcp_congestion_control/sim.sh"
}
}
Experimental Matrix
The Full Factorial Design produces 16 runs. Each row is one experiment with specific factor settings.
| Run | congestion_algo | init_cwnd | rmem_max_kb | ecn |
|---|
| 1 | cubic | 40 | 4096 | on |
| 2 | bbr | 10 | 256 | on |
| 3 | cubic | 40 | 256 | on |
| 4 | cubic | 40 | 4096 | off |
| 5 | bbr | 40 | 4096 | off |
| 6 | bbr | 10 | 4096 | off |
| 7 | bbr | 40 | 256 | off |
| 8 | bbr | 10 | 256 | off |
| 9 | cubic | 10 | 256 | on |
| 10 | cubic | 10 | 4096 | off |
| 11 | bbr | 40 | 256 | on |
| 12 | bbr | 40 | 4096 | on |
| 13 | cubic | 40 | 256 | off |
| 14 | bbr | 10 | 4096 | on |
| 15 | cubic | 10 | 256 | off |
| 16 | cubic | 10 | 4096 | on |
Step-by-Step Workflow
1
Preview the design
$ doe info --config use_cases/47_tcp_congestion_control/config.json
2
Generate the runner script
$ doe generate --config use_cases/47_tcp_congestion_control/config.json \
--output use_cases/47_tcp_congestion_control/results/run.sh --seed 42
3
Execute the experiments
$ bash use_cases/47_tcp_congestion_control/results/run.sh
4
Analyze results
$ doe analyze --config use_cases/47_tcp_congestion_control/config.json
5
Get optimization recommendations
$ doe optimize --config use_cases/47_tcp_congestion_control/config.json
6
Multi-objective optimization
With 2 competing responses, use --multi to find the best compromise via Derringer–Suich desirability.
$ doe optimize --config use_cases/47_tcp_congestion_control/config.json --multi
7
Generate the HTML report
$ doe report --config use_cases/47_tcp_congestion_control/config.json \
--output use_cases/47_tcp_congestion_control/results/report.html
Features Exercised
| Feature | Value |
|---|
| Design type | full_factorial |
| Factor types | continuous (2), categorical (2) |
| Arg style | double-dash |
| Responses | 2 (throughput_gbps ↑, retransmit_pct ↓) |
| Total runs | 16 |
Analysis Results
Generated from actual experiment runs using the DOE Helper Tool.
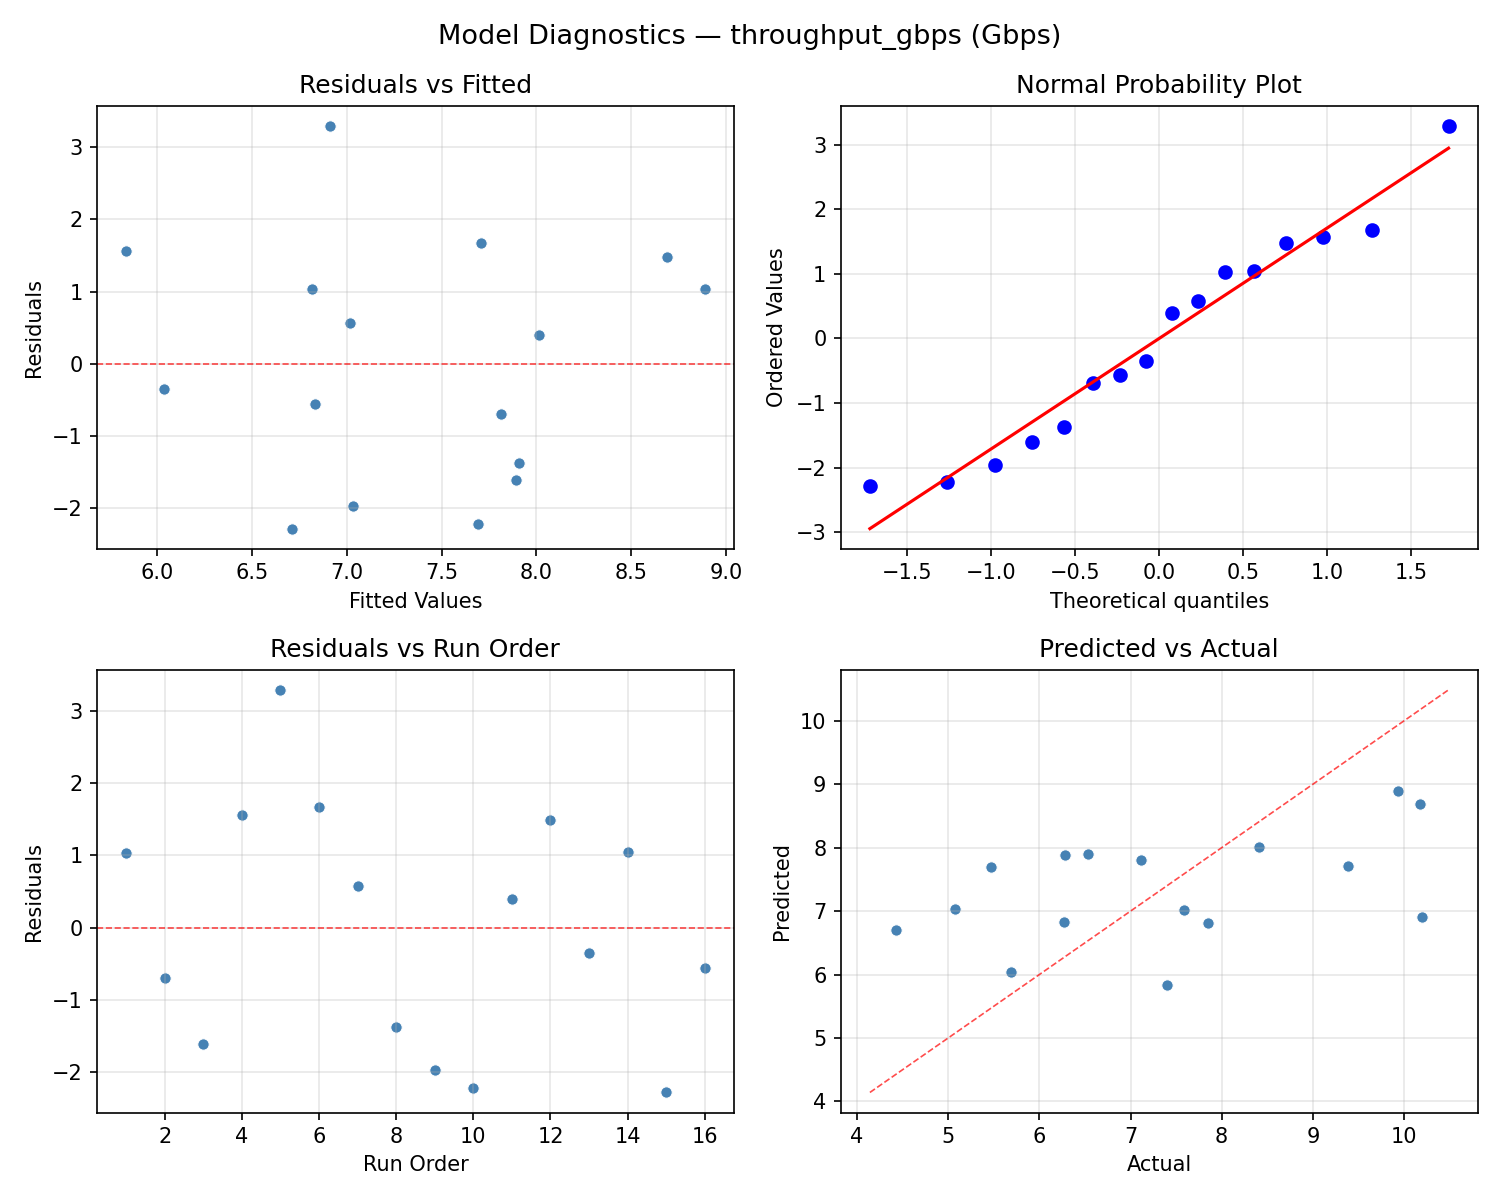
Response: throughput_gbps
Top factors: init_cwnd (31.9%), ecn (28.0%), rmem_max_kb (26.9%).
ANOVA
| Source | DF | SS | MS | F | p-value |
|---|
| Source | DF | SS | MS | F | p-value |
| congestion_algo | 1 | 0.8696 | 0.8696 | 1.287 | 0.3081 |
| init_cwnd | 1 | 5.0513 | 5.0513 | 7.474 | 0.0411 |
| rmem_max_kb | 1 | 3.6005 | 3.6005 | 5.328 | 0.0691 |
| ecn | 1 | 3.8908 | 3.8908 | 5.757 | 0.0617 |
| congestion_algo*init_cwnd | 1 | 5.9903 | 5.9903 | 8.864 | 0.0309 |
| congestion_algo*rmem_max_kb | 1 | 1.2488 | 1.2488 | 1.848 | 0.2321 |
| congestion_algo*ecn | 1 | 1.8838 | 1.8838 | 2.787 | 0.1559 |
| init_cwnd*rmem_max_kb | 1 | 12.6558 | 12.6558 | 18.727 | 0.0075 |
| init_cwnd*ecn | 1 | 0.3221 | 0.3221 | 0.477 | 0.5207 |
| rmem_max_kb*ecn | 1 | 12.4433 | 12.4433 | 18.412 | 0.0078 |
| Error | 5 | 3.3790 | 0.6758 | | |
| Total | 15 | 51.3350 | 3.4223 | | |
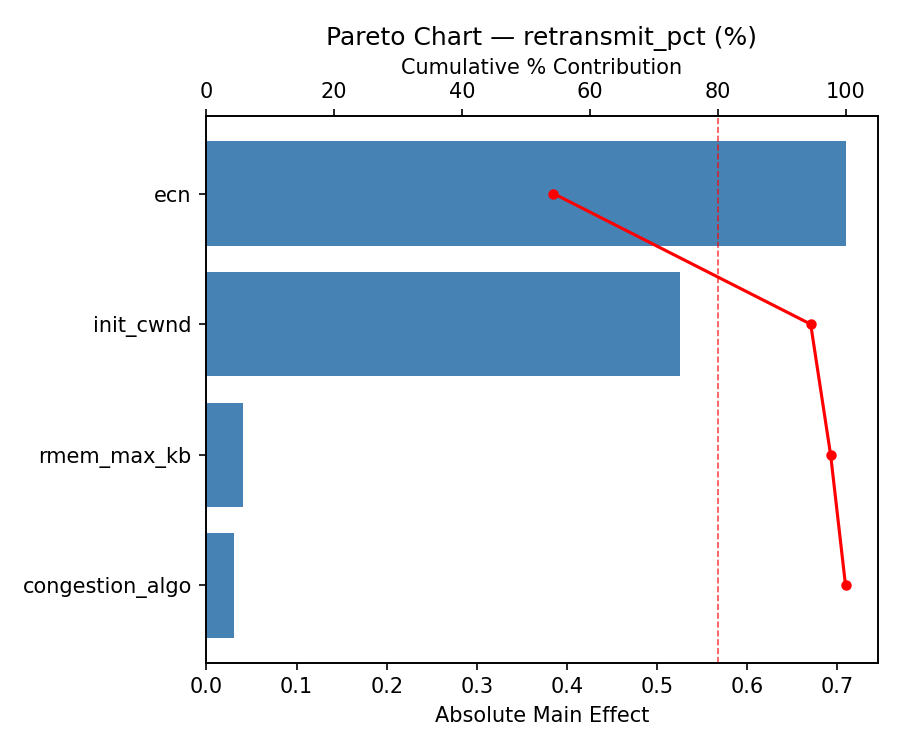
Pareto Chart
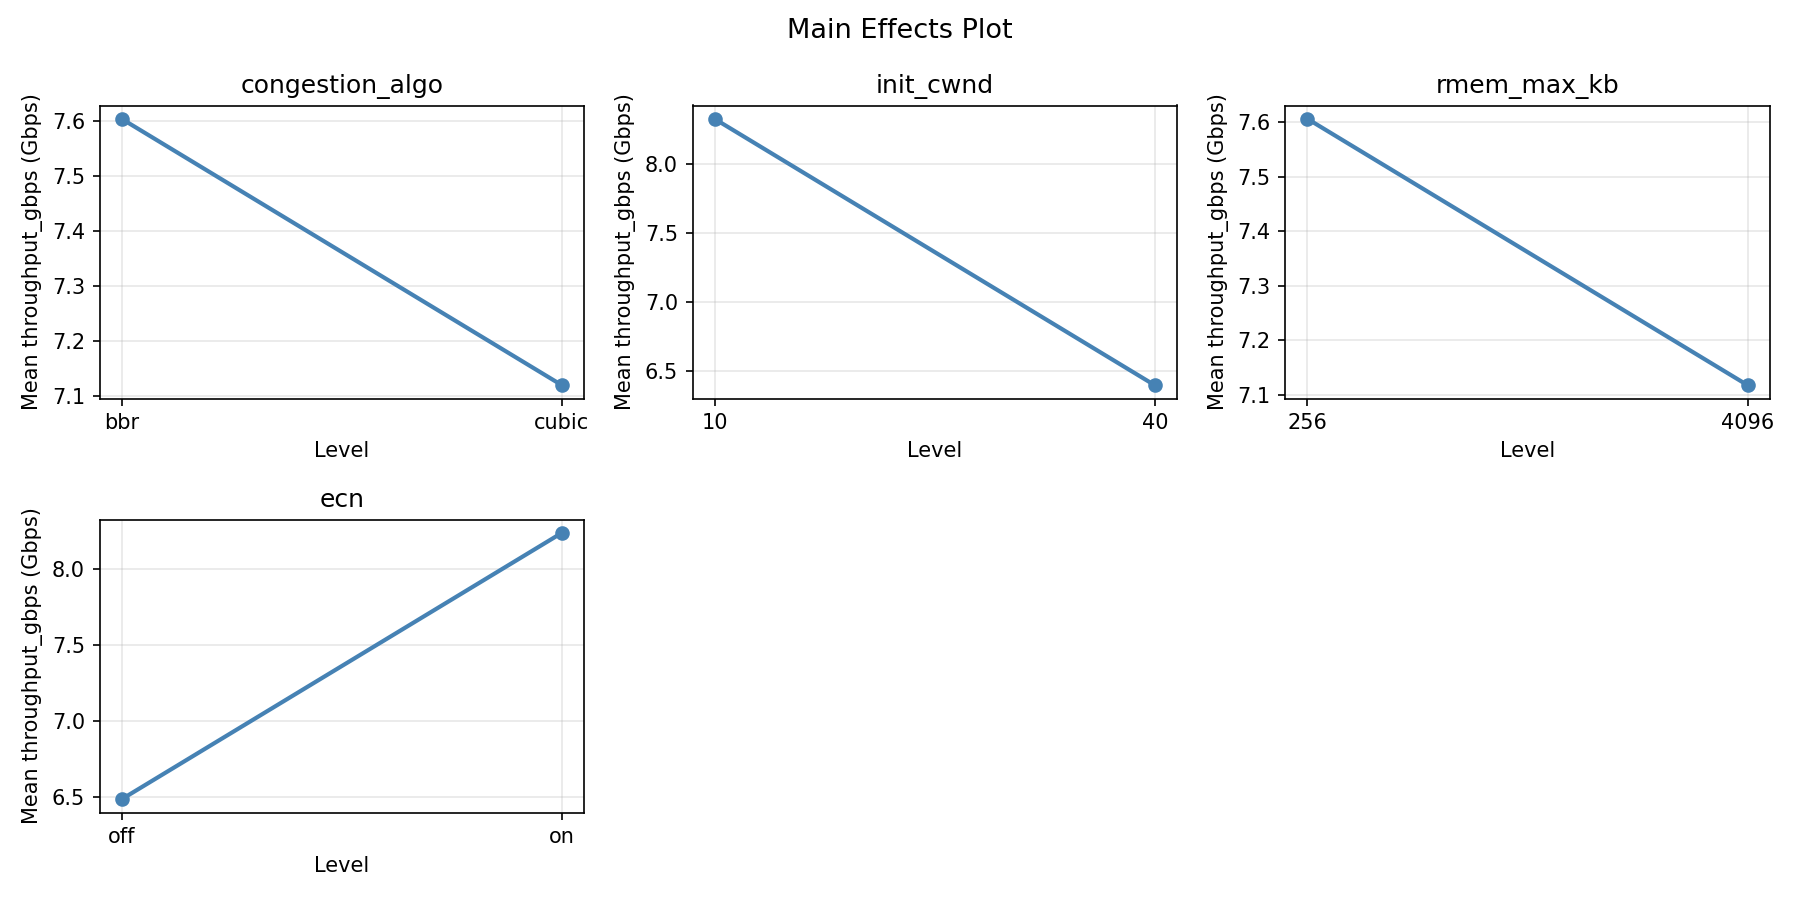
Main Effects Plot
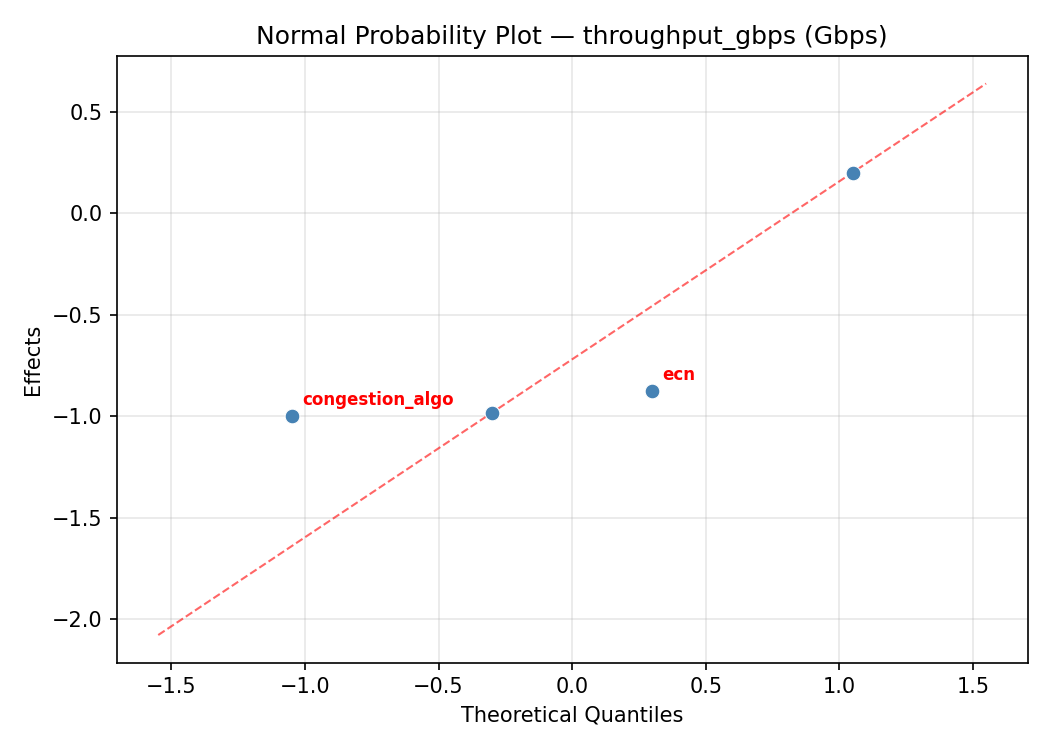
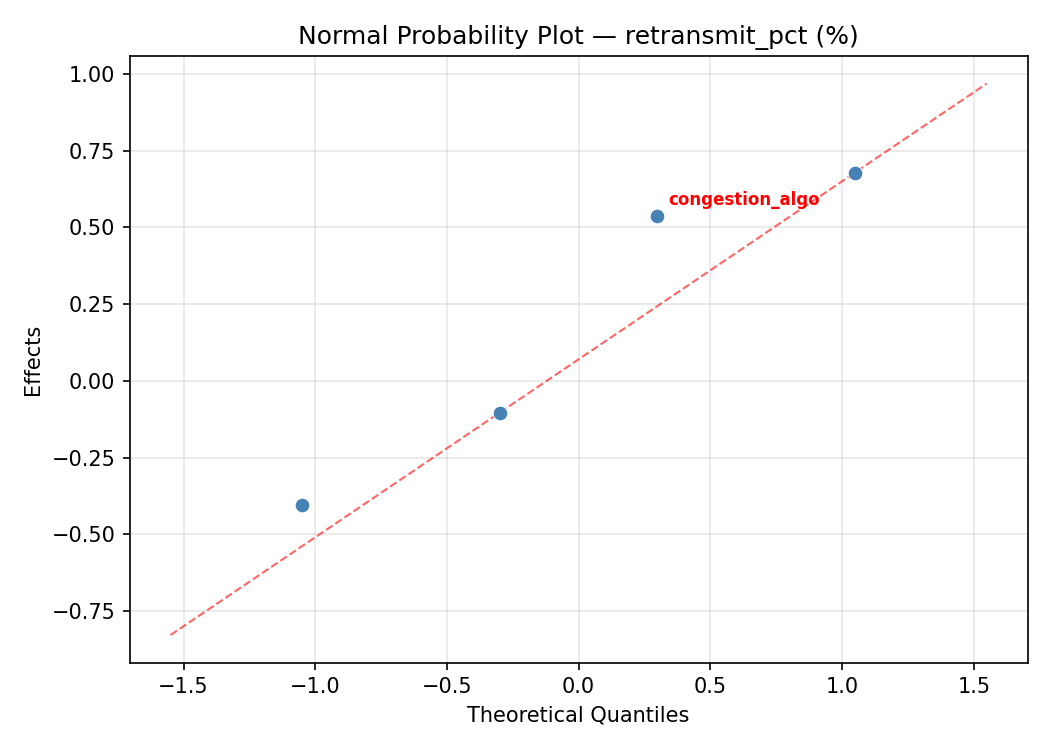
Normal Probability Plot of Effects
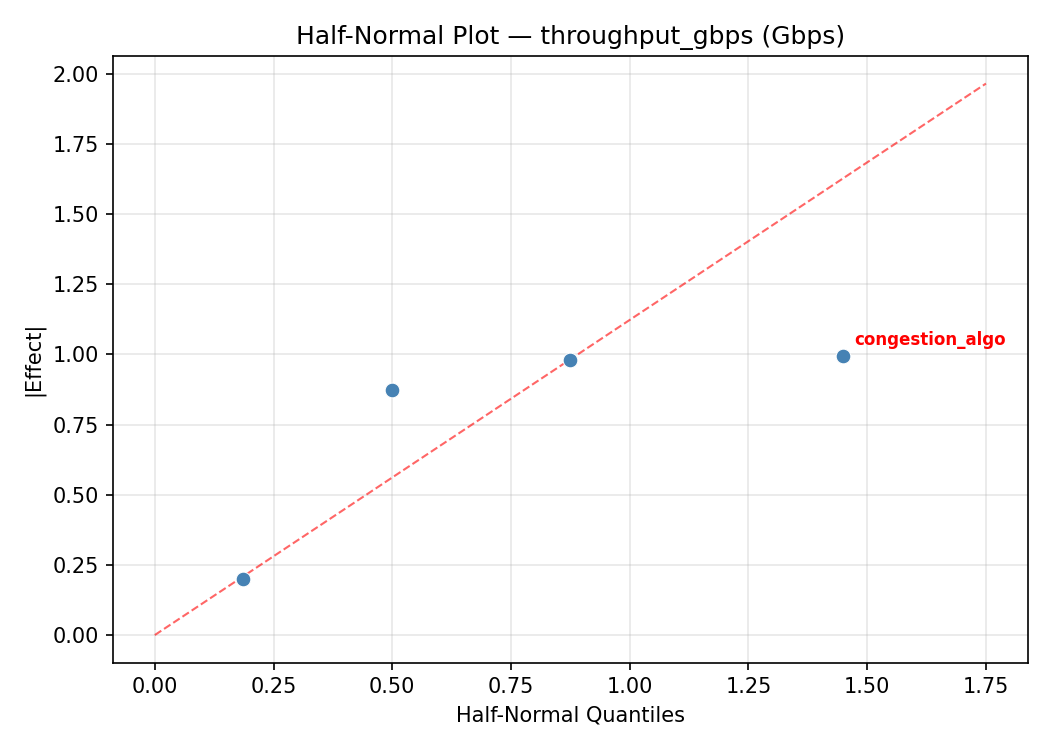
Half-Normal Plot of Effects
Model Diagnostics
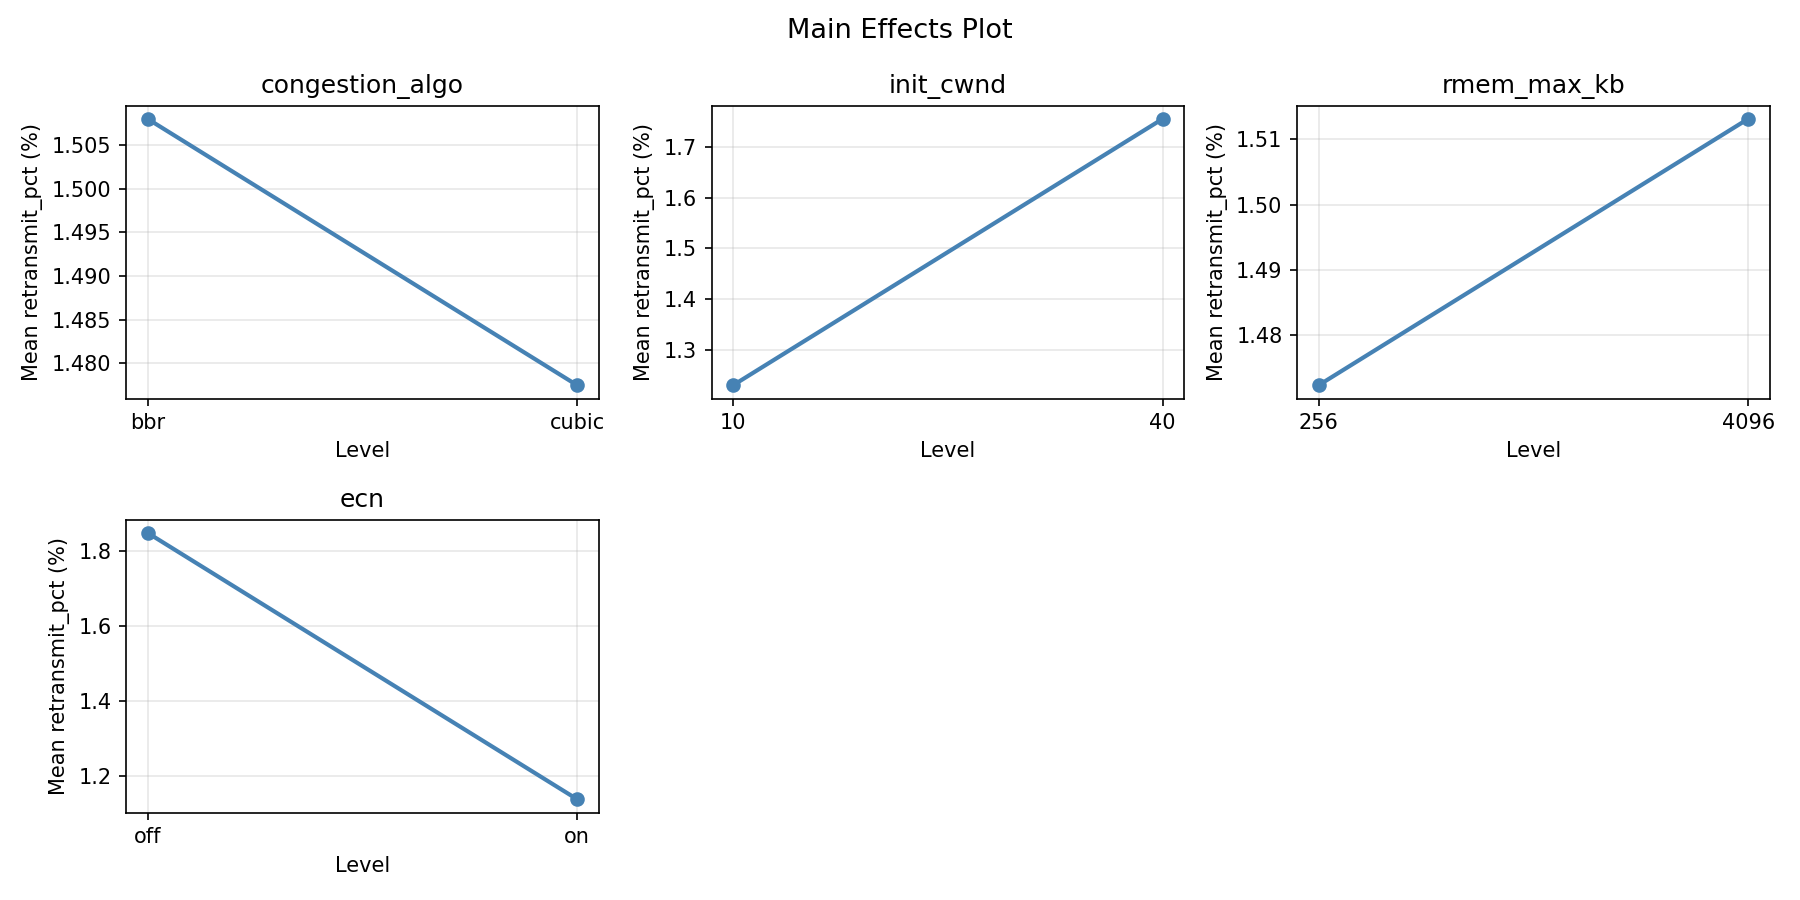
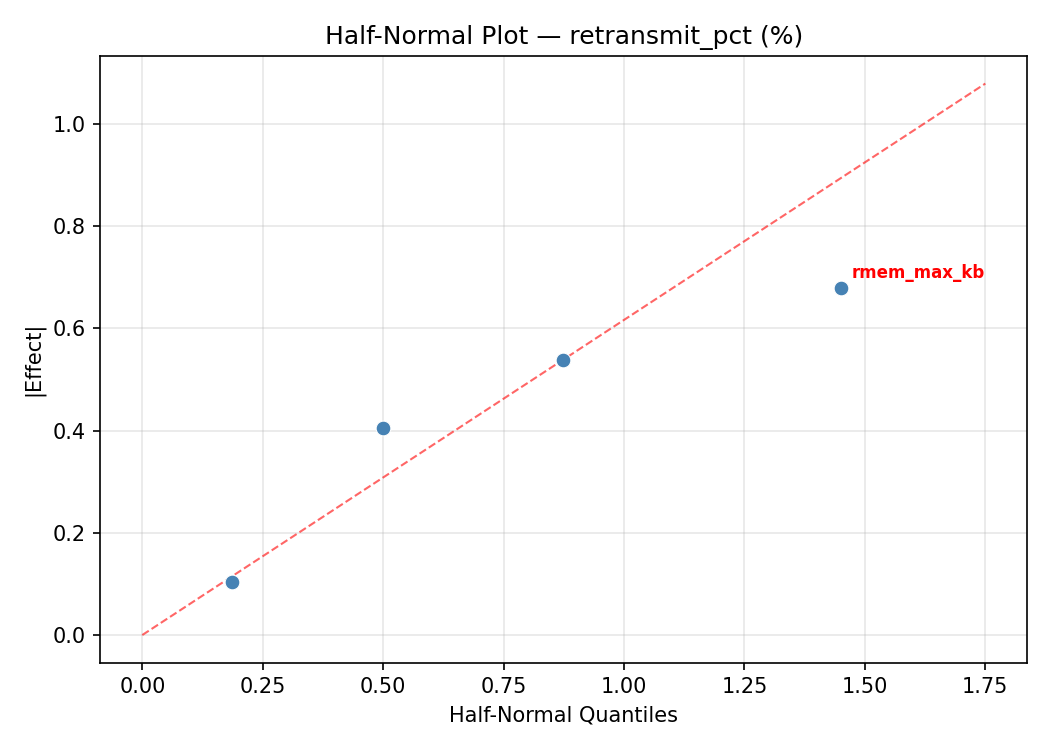
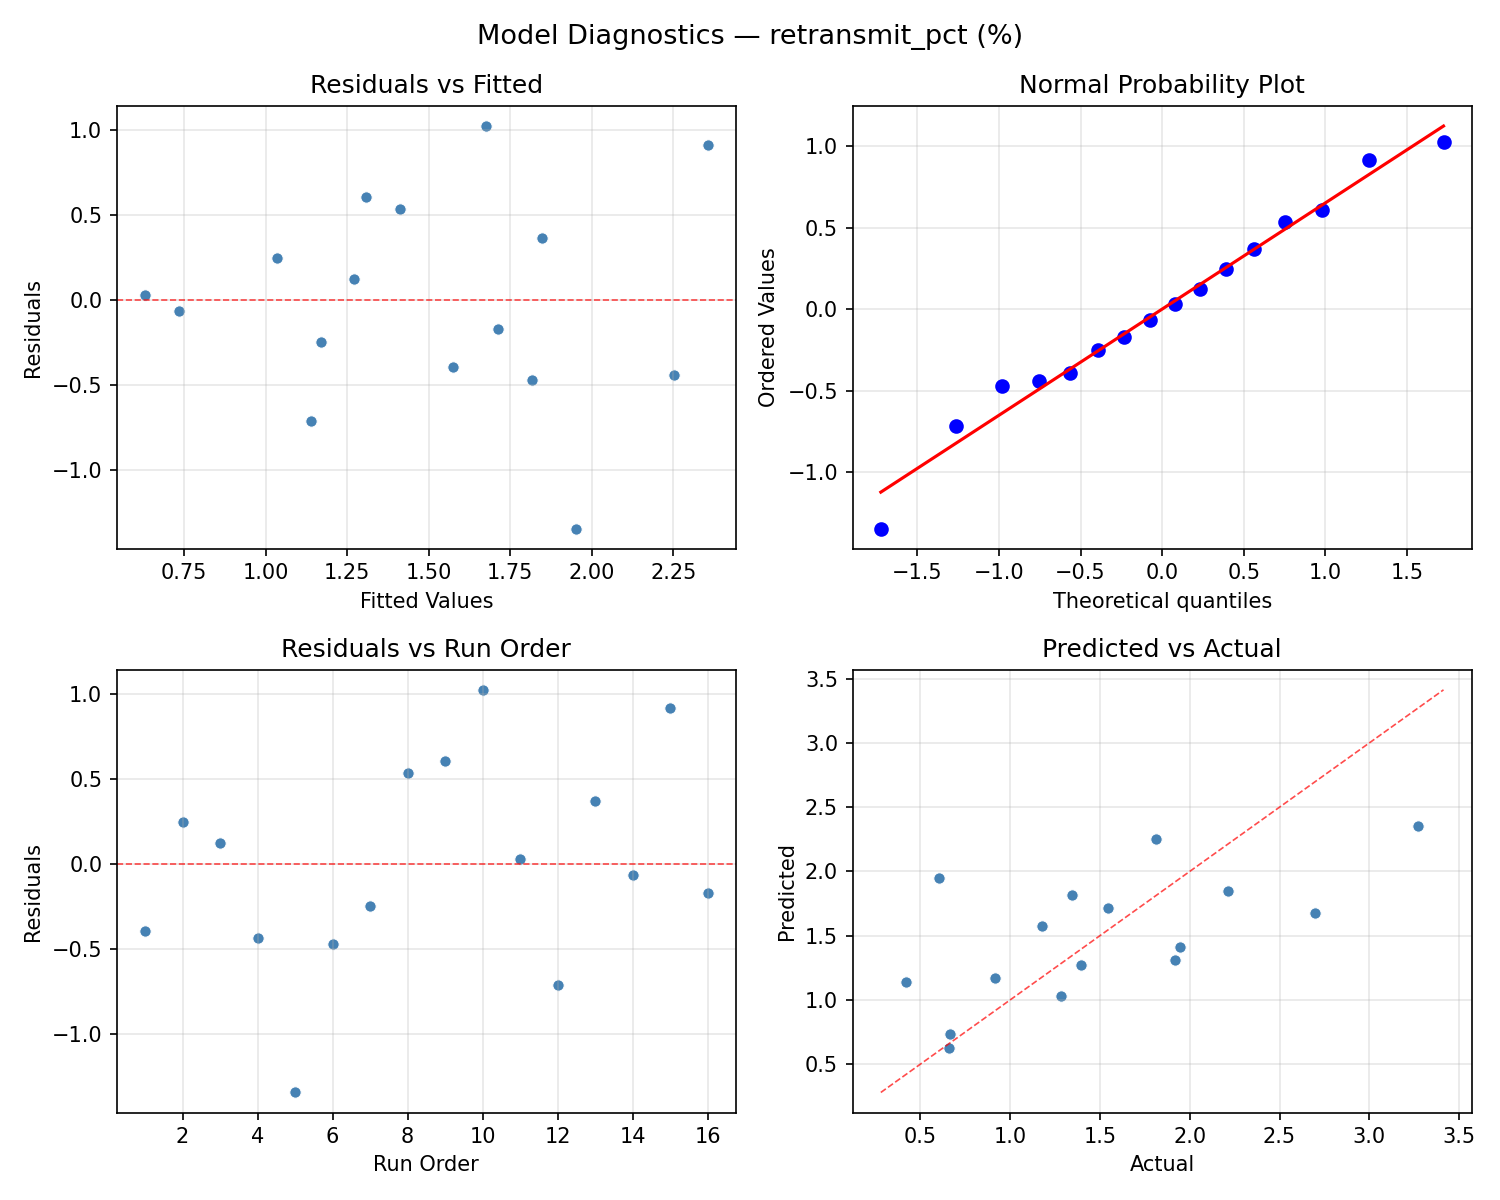
Response: retransmit_pct
Top factors: ecn (47.8%), init_cwnd (27.2%), congestion_algo (18.2%).
ANOVA
| Source | DF | SS | MS | F | p-value |
|---|
| Source | DF | SS | MS | F | p-value |
| congestion_algo | 1 | 0.1475 | 0.1475 | 0.348 | 0.5810 |
| init_cwnd | 1 | 0.3283 | 0.3283 | 0.775 | 0.4191 |
| rmem_max_kb | 1 | 0.0207 | 0.0207 | 0.049 | 0.8337 |
| ecn | 1 | 1.0130 | 1.0130 | 2.390 | 0.1828 |
| congestion_algo*init_cwnd | 1 | 0.6773 | 0.6773 | 1.598 | 0.2619 |
| congestion_algo*rmem_max_kb | 1 | 0.3080 | 0.3080 | 0.727 | 0.4329 |
| congestion_algo*ecn | 1 | 1.2780 | 1.2780 | 3.015 | 0.1430 |
| init_cwnd*rmem_max_kb | 1 | 1.8333 | 1.8333 | 4.325 | 0.0921 |
| init_cwnd*ecn | 1 | 0.0447 | 0.0447 | 0.106 | 0.7584 |
| rmem_max_kb*ecn | 1 | 1.6680 | 1.6680 | 3.935 | 0.1041 |
| Error | 5 | 2.1194 | 0.4239 | | |
| Total | 15 | 9.4384 | 0.6292 | | |
Pareto Chart
Main Effects Plot
Normal Probability Plot of Effects
Half-Normal Plot of Effects
Model Diagnostics
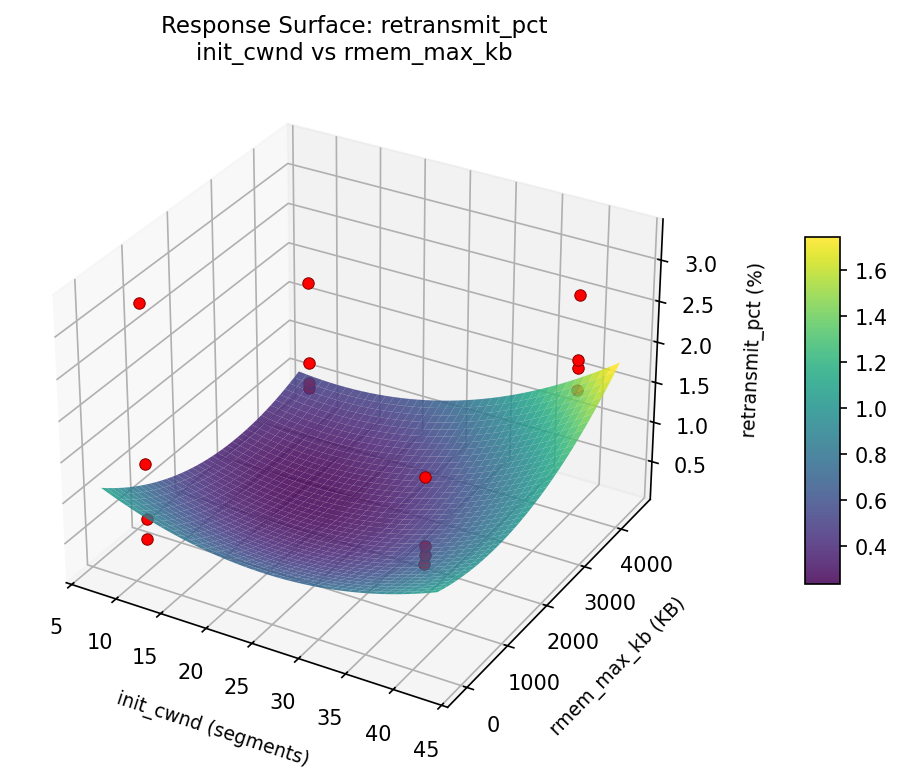
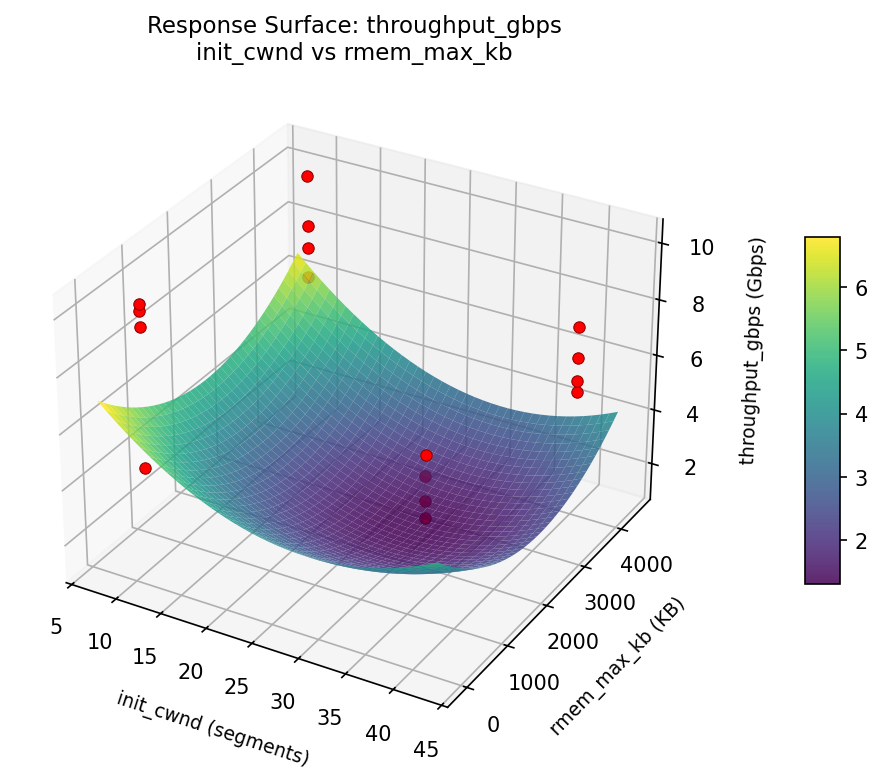
Response Surface Plots
3D surfaces fitted with quadratic RSM. Red dots are observed data points.
retransmit pct init cwnd vs rmem max kb
throughput gbps init cwnd vs rmem max kb
Multi-Objective Optimization
When responses compete, Derringer–Suich desirability finds the best compromise.
Each response is scaled to a 0–1 desirability, then combined via a weighted geometric mean.
Overall Desirability
D = 0.9517
Per-Response Desirability
| Response | Weight | Desirability | Predicted | Dir |
|---|
throughput_gbps |
1.5 |
|
10.17 0.9498 10.17 Gbps |
↑ |
retransmit_pct |
1.0 |
|
0.42 0.9545 0.42 % |
↓ |
Recommended Settings
| Factor | Value |
|---|
congestion_algo | bbr |
init_cwnd | 10 segments |
rmem_max_kb | 4096 KB |
ecn | on |
Source: from observed run #12
Trade-off Summary
Sacrifice = how much worse than single-objective best.
| Response | Predicted | Best Observed | Sacrifice |
|---|
retransmit_pct | 0.42 | 0.42 | +0.00 |
Top 3 Runs by Desirability
| Run | D | Factor Settings |
|---|
| #5 | 0.9310 | congestion_algo=cubic, init_cwnd=10, rmem_max_kb=4096, ecn=off |
| #14 | 0.8978 | congestion_algo=bbr, init_cwnd=40, rmem_max_kb=256, ecn=on |
Model Quality
| Response | R² | Type |
|---|
retransmit_pct | 0.0904 | linear |
Full Multi-Objective Output
============================================================
MULTI-OBJECTIVE OPTIMIZATION
Method: Derringer-Suich Desirability Function
============================================================
Overall desirability: D = 0.9517
Response Weight Desirability Predicted Direction
---------------------------------------------------------------------
throughput_gbps 1.5 0.9498 10.17 Gbps ↑
retransmit_pct 1.0 0.9545 0.42 % ↓
Recommended settings:
congestion_algo = bbr
init_cwnd = 10 segments
rmem_max_kb = 4096 KB
ecn = on
(from observed run #12)
Trade-off summary:
throughput_gbps: 10.17 (best observed: 10.20, sacrifice: +0.03)
retransmit_pct: 0.42 (best observed: 0.42, sacrifice: +0.00)
Model quality:
throughput_gbps: R² = 0.1545 (linear)
retransmit_pct: R² = 0.0904 (linear)
Top 3 observed runs by overall desirability:
1. Run #12 (D=0.9517): congestion_algo=bbr, init_cwnd=10, rmem_max_kb=4096, ecn=on
2. Run #5 (D=0.9310): congestion_algo=cubic, init_cwnd=10, rmem_max_kb=4096, ecn=off
3. Run #14 (D=0.8978): congestion_algo=bbr, init_cwnd=40, rmem_max_kb=256, ecn=on
Full Analysis Output
=== Main Effects: throughput_gbps ===
Factor Effect Std Error % Contribution
--------------------------------------------------------------
init_cwnd 1.1238 0.4625 31.9%
ecn -0.9863 0.4625 28.0%
rmem_max_kb -0.9487 0.4625 26.9%
congestion_algo -0.4662 0.4625 13.2%
=== ANOVA Table: throughput_gbps ===
Source DF SS MS F p-value
-----------------------------------------------------------------------------
congestion_algo 1 0.8696 0.8696 1.287 0.3081
init_cwnd 1 5.0513 5.0513 7.474 0.0411
rmem_max_kb 1 3.6005 3.6005 5.328 0.0691
ecn 1 3.8908 3.8908 5.757 0.0617
congestion_algo*init_cwnd 1 5.9903 5.9903 8.864 0.0309
congestion_algo*rmem_max_kb 1 1.2488 1.2488 1.848 0.2321
congestion_algo*ecn 1 1.8838 1.8838 2.787 0.1559
init_cwnd*rmem_max_kb 1 12.6558 12.6558 18.727 0.0075
init_cwnd*ecn 1 0.3221 0.3221 0.477 0.5207
rmem_max_kb*ecn 1 12.4433 12.4433 18.412 0.0078
Error 5 3.3790 0.6758
Total 15 51.3350 3.4223
=== Interaction Effects: throughput_gbps ===
Factor A Factor B Interaction % Contribution
------------------------------------------------------------------------
init_cwnd rmem_max_kb -1.7788 28.3%
rmem_max_kb ecn -1.7637 28.0%
congestion_algo init_cwnd 1.2237 19.4%
congestion_algo ecn -0.6863 10.9%
congestion_algo rmem_max_kb -0.5587 8.9%
init_cwnd ecn 0.2838 4.5%
=== Summary Statistics: throughput_gbps ===
congestion_algo:
Level N Mean Std Min Max
------------------------------------------------------------
bbr 8 7.5950 1.3932 6.2700 9.9300
cubic 8 7.1288 2.2953 4.4300 10.2000
init_cwnd:
Level N Mean Std Min Max
------------------------------------------------------------
10 8 6.8000 1.5978 5.0700 9.9300
40 8 7.9238 2.0147 4.4300 10.2000
rmem_max_kb:
Level N Mean Std Min Max
------------------------------------------------------------
256 8 7.8362 1.9093 5.4700 10.2000
4096 8 6.8875 1.7815 4.4300 9.9300
ecn:
Level N Mean Std Min Max
------------------------------------------------------------
off 8 7.8550 1.5690 5.6900 10.1700
on 8 6.8688 2.0775 4.4300 10.2000
=== Main Effects: retransmit_pct ===
Factor Effect Std Error % Contribution
--------------------------------------------------------------
ecn 0.5032 0.1983 47.8%
init_cwnd -0.2865 0.1983 27.2%
congestion_algo 0.1920 0.1983 18.2%
rmem_max_kb -0.0720 0.1983 6.8%
=== ANOVA Table: retransmit_pct ===
Source DF SS MS F p-value
-----------------------------------------------------------------------------
congestion_algo 1 0.1475 0.1475 0.348 0.5810
init_cwnd 1 0.3283 0.3283 0.775 0.4191
rmem_max_kb 1 0.0207 0.0207 0.049 0.8337
ecn 1 1.0130 1.0130 2.390 0.1828
congestion_algo*init_cwnd 1 0.6773 0.6773 1.598 0.2619
congestion_algo*rmem_max_kb 1 0.3080 0.3080 0.727 0.4329
congestion_algo*ecn 1 1.2780 1.2780 3.015 0.1430
init_cwnd*rmem_max_kb 1 1.8333 1.8333 4.325 0.0921
init_cwnd*ecn 1 0.0447 0.0447 0.106 0.7584
rmem_max_kb*ecn 1 1.6680 1.6680 3.935 0.1041
Error 5 2.1194 0.4239
Total 15 9.4384 0.6292
=== Interaction Effects: retransmit_pct ===
Factor A Factor B Interaction % Contribution
------------------------------------------------------------------------
init_cwnd rmem_max_kb 0.6770 25.2%
rmem_max_kb ecn 0.6458 24.1%
congestion_algo ecn 0.5653 21.1%
congestion_algo init_cwnd -0.4115 15.3%
congestion_algo rmem_max_kb 0.2775 10.3%
init_cwnd ecn 0.1058 3.9%
=== Summary Statistics: retransmit_pct ===
congestion_algo:
Level N Mean Std Min Max
------------------------------------------------------------
bbr 8 1.3967 0.3953 0.6670 1.9480
cubic 8 1.5888 1.0821 0.4240 3.2700
init_cwnd:
Level N Mean Std Min Max
------------------------------------------------------------
10 8 1.6360 0.6881 0.6670 2.7000
40 8 1.3495 0.9099 0.4240 3.2700
rmem_max_kb:
Level N Mean Std Min Max
------------------------------------------------------------
256 8 1.5288 0.7864 0.4240 2.7000
4096 8 1.4567 0.8526 0.6600 3.2700
ecn:
Level N Mean Std Min Max
------------------------------------------------------------
off 8 1.2411 0.6778 0.4240 2.2150
on 8 1.7444 0.8627 0.6050 3.2700
Optimization Recommendations
=== Optimization: throughput_gbps ===
Direction: maximize
Best observed run: #5
congestion_algo = bbr
init_cwnd = 40
rmem_max_kb = 4096
ecn = off
Value: 10.2
RSM Model (linear, R² = 0.1324, Adj R² = -0.1831):
Coefficients:
intercept +7.3619
congestion_algo -0.5456
init_cwnd -0.2431
rmem_max_kb +0.0969
ecn -0.2419
RSM Model (quadratic, R² = 0.7459, Adj R² = -2.8118):
Coefficients:
intercept +1.4724
congestion_algo -0.5456
init_cwnd -0.2431
rmem_max_kb +0.0969
ecn -0.2419
congestion_algo*init_cwnd -0.5681
congestion_algo*rmem_max_kb +0.3519
congestion_algo*ecn +0.5556
init_cwnd*rmem_max_kb -0.0756
init_cwnd*ecn -0.7894
rmem_max_kb*ecn -0.7644
congestion_algo^2 +1.4724
init_cwnd^2 +1.4724
rmem_max_kb^2 +1.4724
ecn^2 +1.4724
Curvature analysis:
congestion_algo coef=+1.4724 convex (has a minimum)
init_cwnd coef=+1.4724 convex (has a minimum)
rmem_max_kb coef=+1.4724 convex (has a minimum)
ecn coef=+1.4724 convex (has a minimum)
Notable interactions:
init_cwnd*ecn coef=-0.7894 (antagonistic)
rmem_max_kb*ecn coef=-0.7644 (antagonistic)
congestion_algo*init_cwnd coef=-0.5681 (antagonistic)
congestion_algo*ecn coef=+0.5556 (synergistic)
congestion_algo*rmem_max_kb coef=+0.3519 (synergistic)
Predicted optimum (from linear model, at observed points):
congestion_algo = bbr
init_cwnd = 10
rmem_max_kb = 4096
ecn = off
Predicted value: 8.4894
Surface optimum (via L-BFGS-B, linear model):
congestion_algo = cubic
init_cwnd = 10
rmem_max_kb = 4096
ecn = off
Predicted value: 8.4894
Model quality: Weak fit — consider adding center points or using a different design.
Factor importance:
1. congestion_algo (effect: -1.1, contribution: 48.4%)
2. init_cwnd (effect: -0.5, contribution: 21.6%)
3. ecn (effect: -0.5, contribution: 21.5%)
4. rmem_max_kb (effect: 0.2, contribution: 8.6%)
=== Optimization: retransmit_pct ===
Direction: minimize
Best observed run: #12
congestion_algo = bbr
init_cwnd = 10
rmem_max_kb = 256
ecn = on
Value: 0.424
RSM Model (linear, R² = 0.2632, Adj R² = -0.0048):
Coefficients:
intercept +1.4928
congestion_algo +0.2500
init_cwnd +0.1380
rmem_max_kb +0.1974
ecn +0.1864
RSM Model (quadratic, R² = 0.8146, Adj R² = -1.7810):
Coefficients:
intercept +0.2986
congestion_algo +0.2500
init_cwnd +0.1380
rmem_max_kb +0.1974
ecn +0.1864
congestion_algo*init_cwnd +0.1900
congestion_algo*rmem_max_kb -0.0381
congestion_algo*ecn -0.2246
init_cwnd*rmem_max_kb +0.0809
init_cwnd*ecn +0.1939
rmem_max_kb*ecn +0.4395
congestion_algo^2 +0.2986
init_cwnd^2 +0.2985
rmem_max_kb^2 +0.2986
ecn^2 +0.2986
Curvature analysis:
rmem_max_kb coef=+0.2986 convex (has a minimum)
ecn coef=+0.2986 convex (has a minimum)
congestion_algo coef=+0.2986 convex (has a minimum)
init_cwnd coef=+0.2985 convex (has a minimum)
Notable interactions:
rmem_max_kb*ecn coef=+0.4395 (synergistic)
Predicted optimum (from linear model, at observed points):
congestion_algo = cubic
init_cwnd = 40
rmem_max_kb = 4096
ecn = on
Predicted value: 2.2645
Surface optimum (via L-BFGS-B, linear model):
congestion_algo = cubic
init_cwnd = 10
rmem_max_kb = 256
ecn = off
Predicted value: 0.7210
Model quality: Weak fit — consider adding center points or using a different design.
Factor importance:
1. congestion_algo (effect: 0.5, contribution: 32.4%)
2. rmem_max_kb (effect: 0.4, contribution: 25.6%)
3. ecn (effect: 0.4, contribution: 24.1%)
4. init_cwnd (effect: 0.3, contribution: 17.9%)