Summary
This experiment investigates log aggregation pipeline. Latin Hypercube exploration of 4 log aggregation parameters for ingestion rate and query latency.
The design varies 4 factors: batch size kb (KB), ranging from 64 to 2048, flush interval sec (sec), ranging from 1 to 30, parser threads (threads), ranging from 1 to 16, and compression ratio (level), ranging from 1 to 9. The goal is to optimize 2 responses: ingestion rate gbps (Gbps) (maximize) and query latency ms (ms) (minimize). Fixed conditions held constant across all runs include stack = elk, retention days = 30.
Latin Hypercube Sampling was used to space 10 runs across the 4-dimensional factor space with good coverage and minimal gaps, making it ideal for computer experiments where the response surface may be complex.
Key Findings
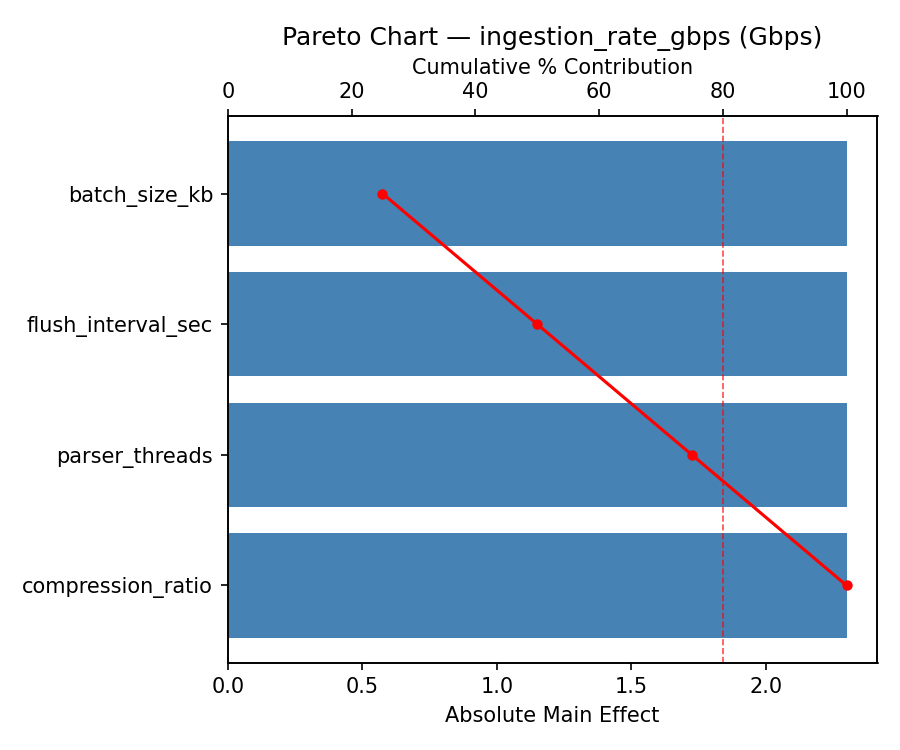
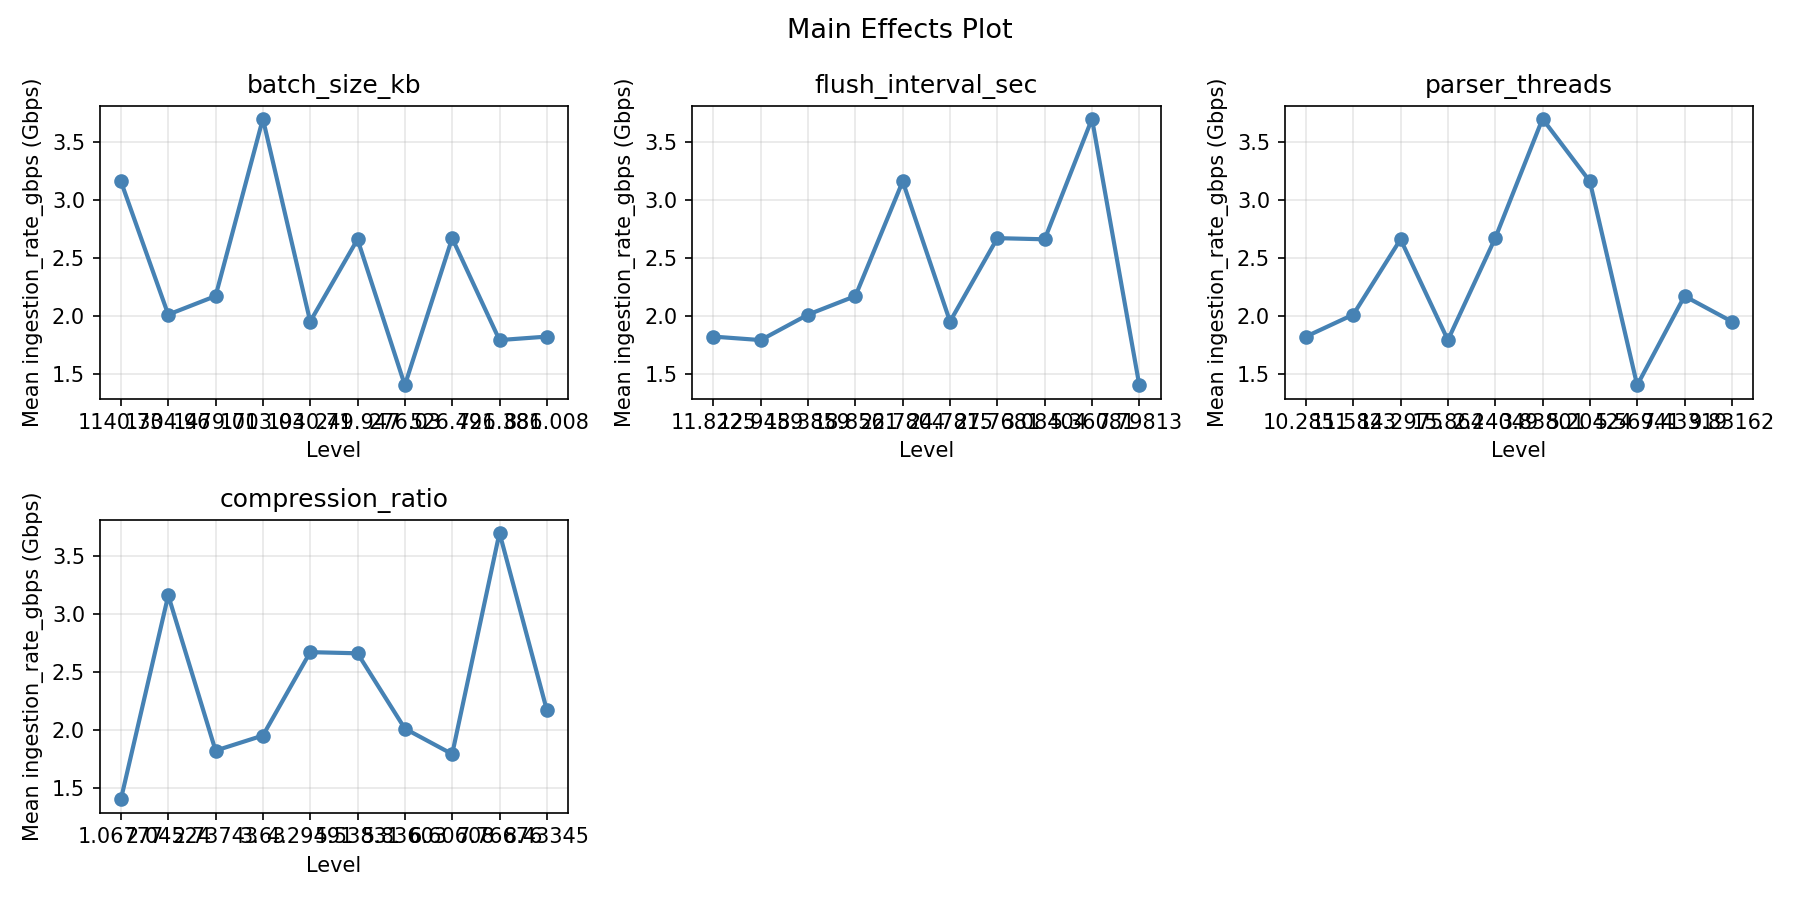
For ingestion rate gbps, the most influential factors were batch size kb (25.0%), flush interval sec (25.0%), parser threads (25.0%). The best observed value was 3.7 (at batch size kb = 710.913, flush interval sec = 6.36183, parser threads = 15.6821).
For query latency ms, the most influential factors were batch size kb (25.0%), flush interval sec (25.0%), parser threads (25.0%). The best observed value was 68.0 (at batch size kb = 710.913, flush interval sec = 6.36183, parser threads = 15.6821).
Recommended Next Steps
- Consider whether any fixed factors should be varied in a future study.
Experimental Setup
Factors
| Factor | Low | High | Unit |
|---|
batch_size_kb | 64 | 2048 | KB |
flush_interval_sec | 1 | 30 | sec |
parser_threads | 1 | 16 | threads |
compression_ratio | 1 | 9 | level |
Fixed: stack = elk, retention_days = 30
Responses
| Response | Direction | Unit |
|---|
ingestion_rate_gbps | ↑ maximize | Gbps |
query_latency_ms | ↓ minimize | ms |
Configuration
{
"metadata": {
"name": "Log Aggregation Pipeline",
"description": "Latin Hypercube exploration of 4 log aggregation parameters for ingestion rate and query latency"
},
"factors": [
{
"name": "batch_size_kb",
"levels": [
"64",
"2048"
],
"type": "continuous",
"unit": "KB"
},
{
"name": "flush_interval_sec",
"levels": [
"1",
"30"
],
"type": "continuous",
"unit": "sec"
},
{
"name": "parser_threads",
"levels": [
"1",
"16"
],
"type": "continuous",
"unit": "threads"
},
{
"name": "compression_ratio",
"levels": [
"1",
"9"
],
"type": "continuous",
"unit": "level"
}
],
"fixed_factors": {
"stack": "elk",
"retention_days": "30"
},
"responses": [
{
"name": "ingestion_rate_gbps",
"optimize": "maximize",
"unit": "Gbps"
},
{
"name": "query_latency_ms",
"optimize": "minimize",
"unit": "ms"
}
],
"settings": {
"operation": "latin_hypercube",
"test_script": "use_cases/83_log_aggregation_pipeline/sim.sh"
}
}
Experimental Matrix
The Latin Hypercube Design produces 10 runs. Each row is one experiment with specific factor settings.
| Run | batch_size_kb | flush_interval_sec | parser_threads | compression_ratio |
|---|
| 1 | 1482.9 | 14.0657 | 6.78174 | 7.52215 |
| 2 | 1884.25 | 21.5992 | 9.57745 | 7.16199 |
| 3 | 279.962 | 3.69628 | 13.1013 | 2.34752 |
| 4 | 1377.42 | 11.2718 | 14.6558 | 8.66235 |
| 5 | 91.8077 | 16.7039 | 12.1488 | 4.86661 |
| 6 | 939.117 | 29.5385 | 8.38169 | 5.77894 |
| 7 | 519.254 | 5.61604 | 3.22518 | 6.18972 |
| 8 | 1843.05 | 7.5369 | 10.4606 | 1.75768 |
| 9 | 806.947 | 27.0412 | 4.14223 | 2.78195 |
| 10 | 1182.84 | 19.7785 | 1.18843 | 3.68116 |
Step-by-Step Workflow
1
Preview the design
$ doe info --config use_cases/83_log_aggregation_pipeline/config.json
2
Generate the runner script
$ doe generate --config use_cases/83_log_aggregation_pipeline/config.json \
--output use_cases/83_log_aggregation_pipeline/results/run.sh --seed 42
3
Execute the experiments
$ bash use_cases/83_log_aggregation_pipeline/results/run.sh
4
Analyze results
$ doe analyze --config use_cases/83_log_aggregation_pipeline/config.json
5
Get optimization recommendations
$ doe optimize --config use_cases/83_log_aggregation_pipeline/config.json
6
Multi-objective optimization
With 2 competing responses, use --multi to find the best compromise via Derringer–Suich desirability.
$ doe optimize --config use_cases/83_log_aggregation_pipeline/config.json --multi
7
Generate the HTML report
$ doe report --config use_cases/83_log_aggregation_pipeline/config.json \
--output use_cases/83_log_aggregation_pipeline/results/report.html
Features Exercised
| Feature | Value |
|---|
| Design type | latin_hypercube |
| Factor types | continuous (all 4) |
| Arg style | double-dash |
| Responses | 2 (ingestion_rate_gbps ↑, query_latency_ms ↓) |
| Total runs | 10 |
Analysis Results
Generated from actual experiment runs using the DOE Helper Tool.
Response: ingestion_rate_gbps
Top factors: batch_size_kb (25.0%), flush_interval_sec (25.0%), parser_threads (25.0%).
ANOVA
| Source | DF | SS | MS | F | p-value |
|---|
| Source | DF | SS | MS | F | p-value |
| batch_size_kb | 9 | 4.4792 | 0.4977 | | |
| flush_interval_sec | 9 | 4.4792 | 0.4977 | | |
| parser_threads | 9 | 4.4792 | 0.4977 | | |
| compression_ratio | 9 | 4.4792 | 0.4977 | | |
| Error | (Lenth | PSE) | 0 | 0.0000 | 0.0000 |
| Total | 9 | 4.4792 | 0.4977 | | |
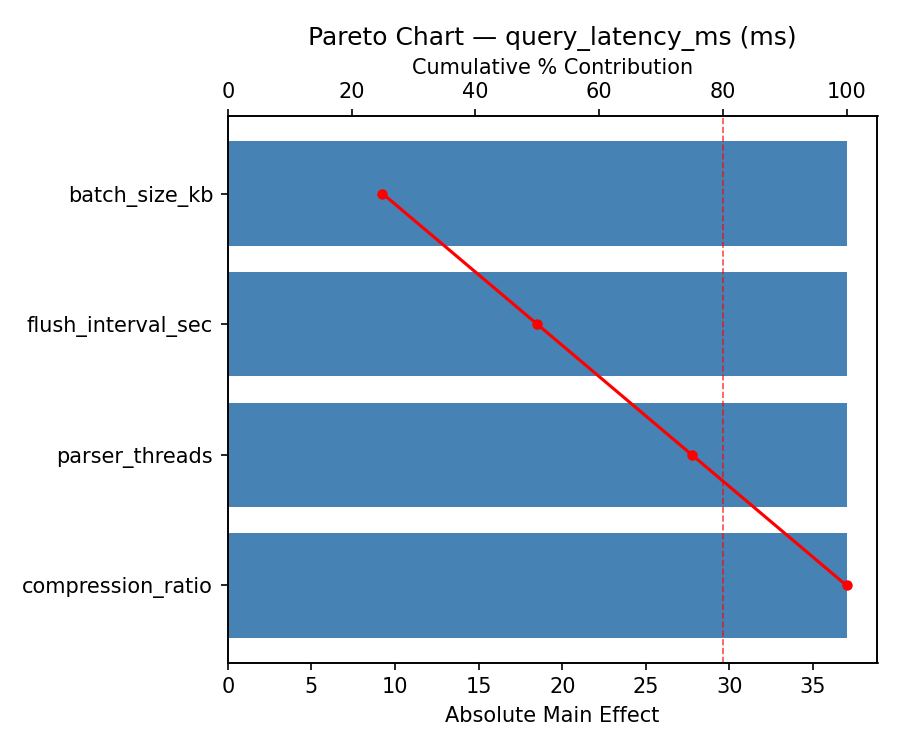
Pareto Chart
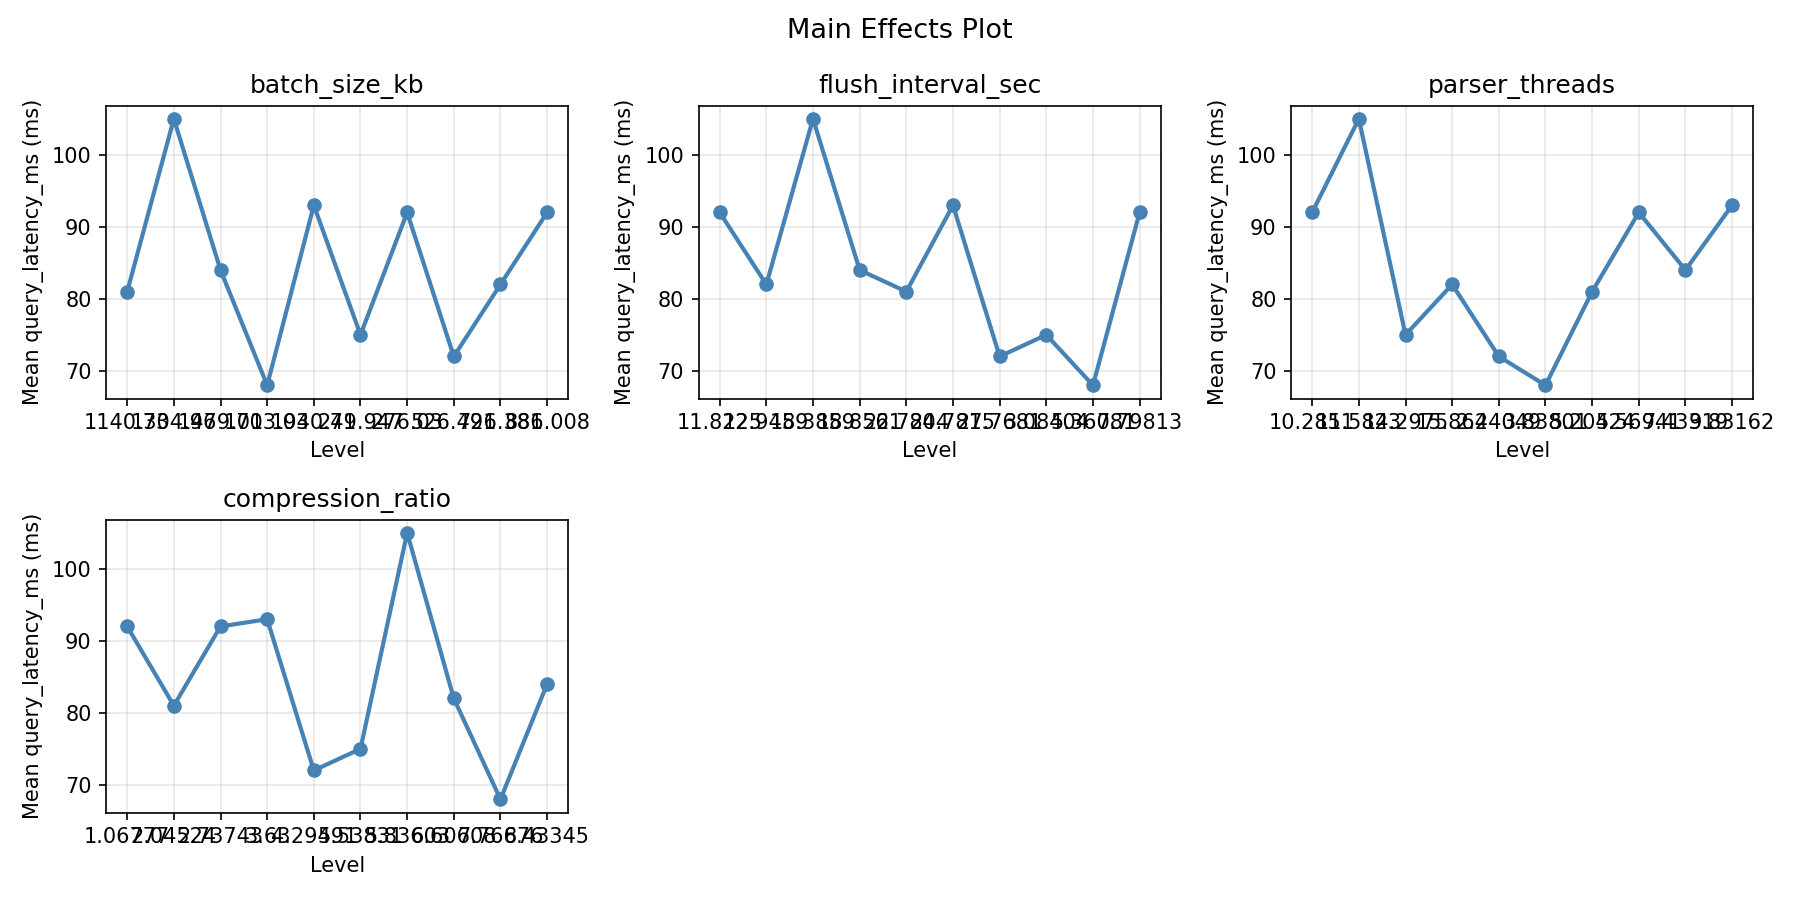
Main Effects Plot
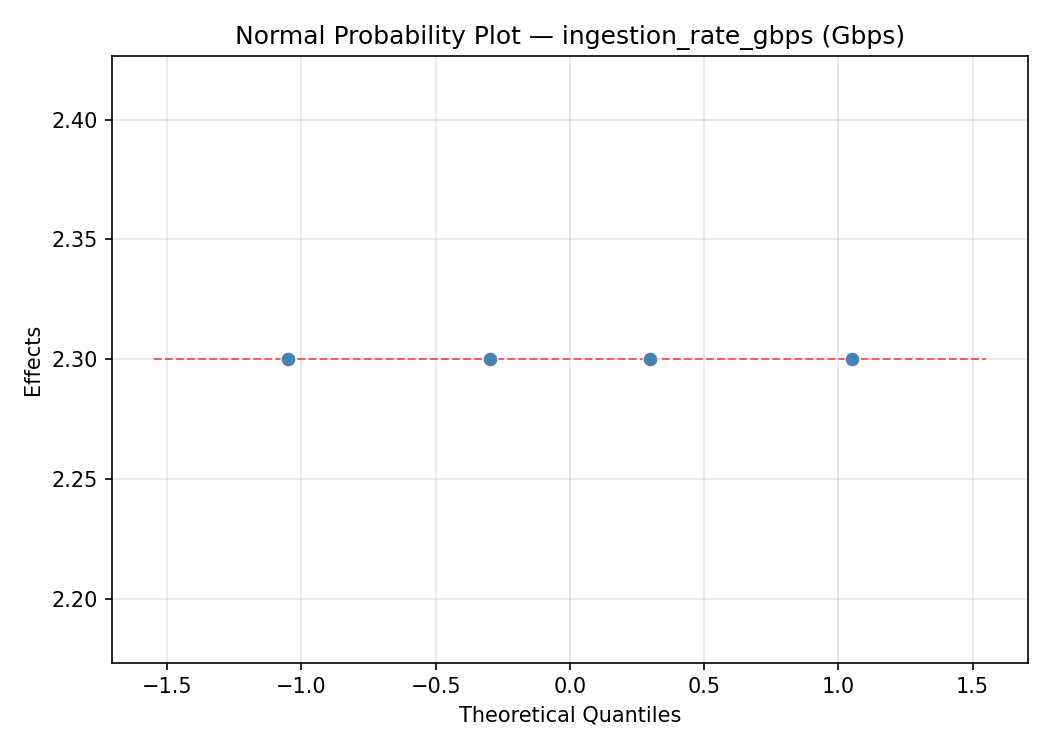
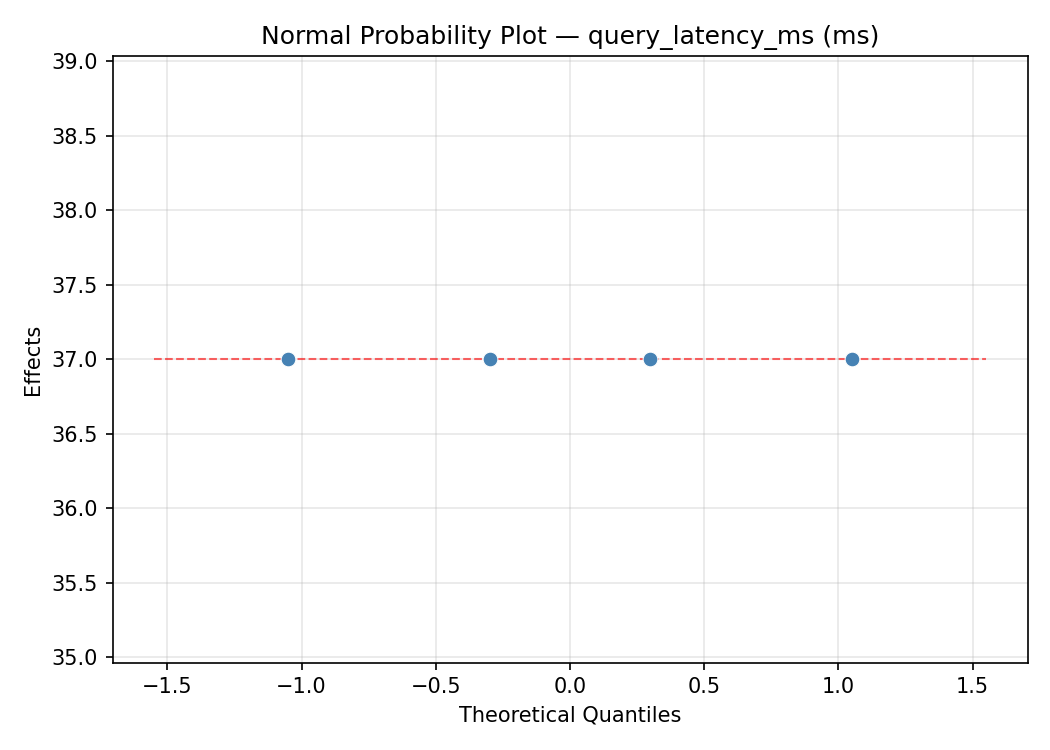
Normal Probability Plot of Effects
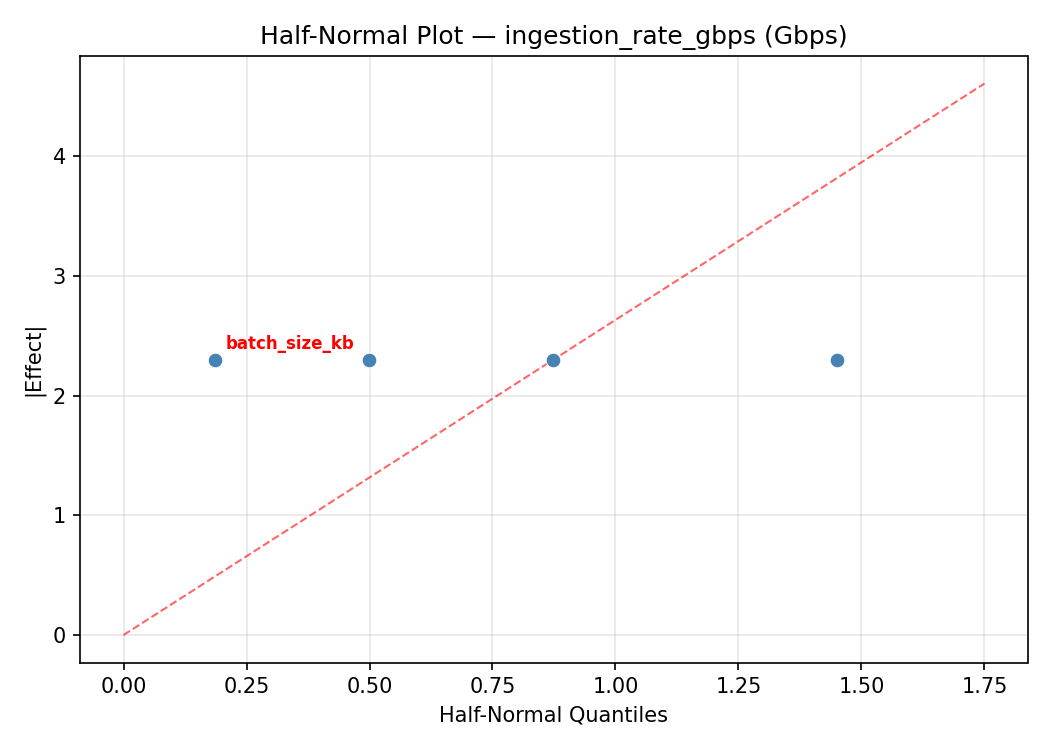
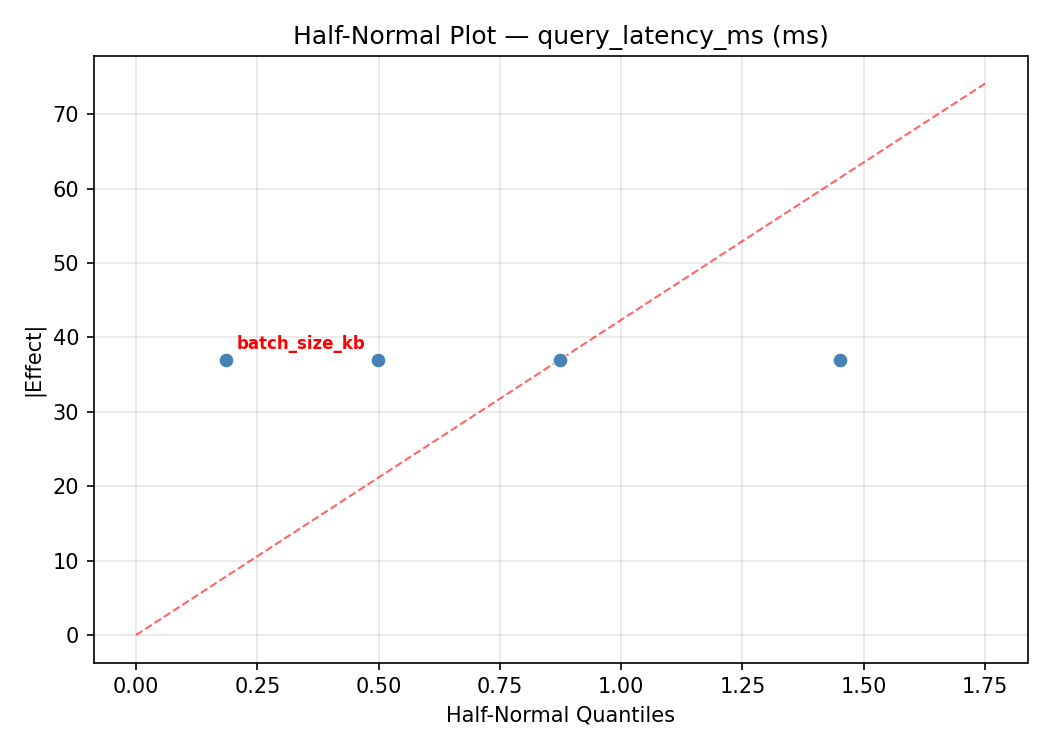
Half-Normal Plot of Effects
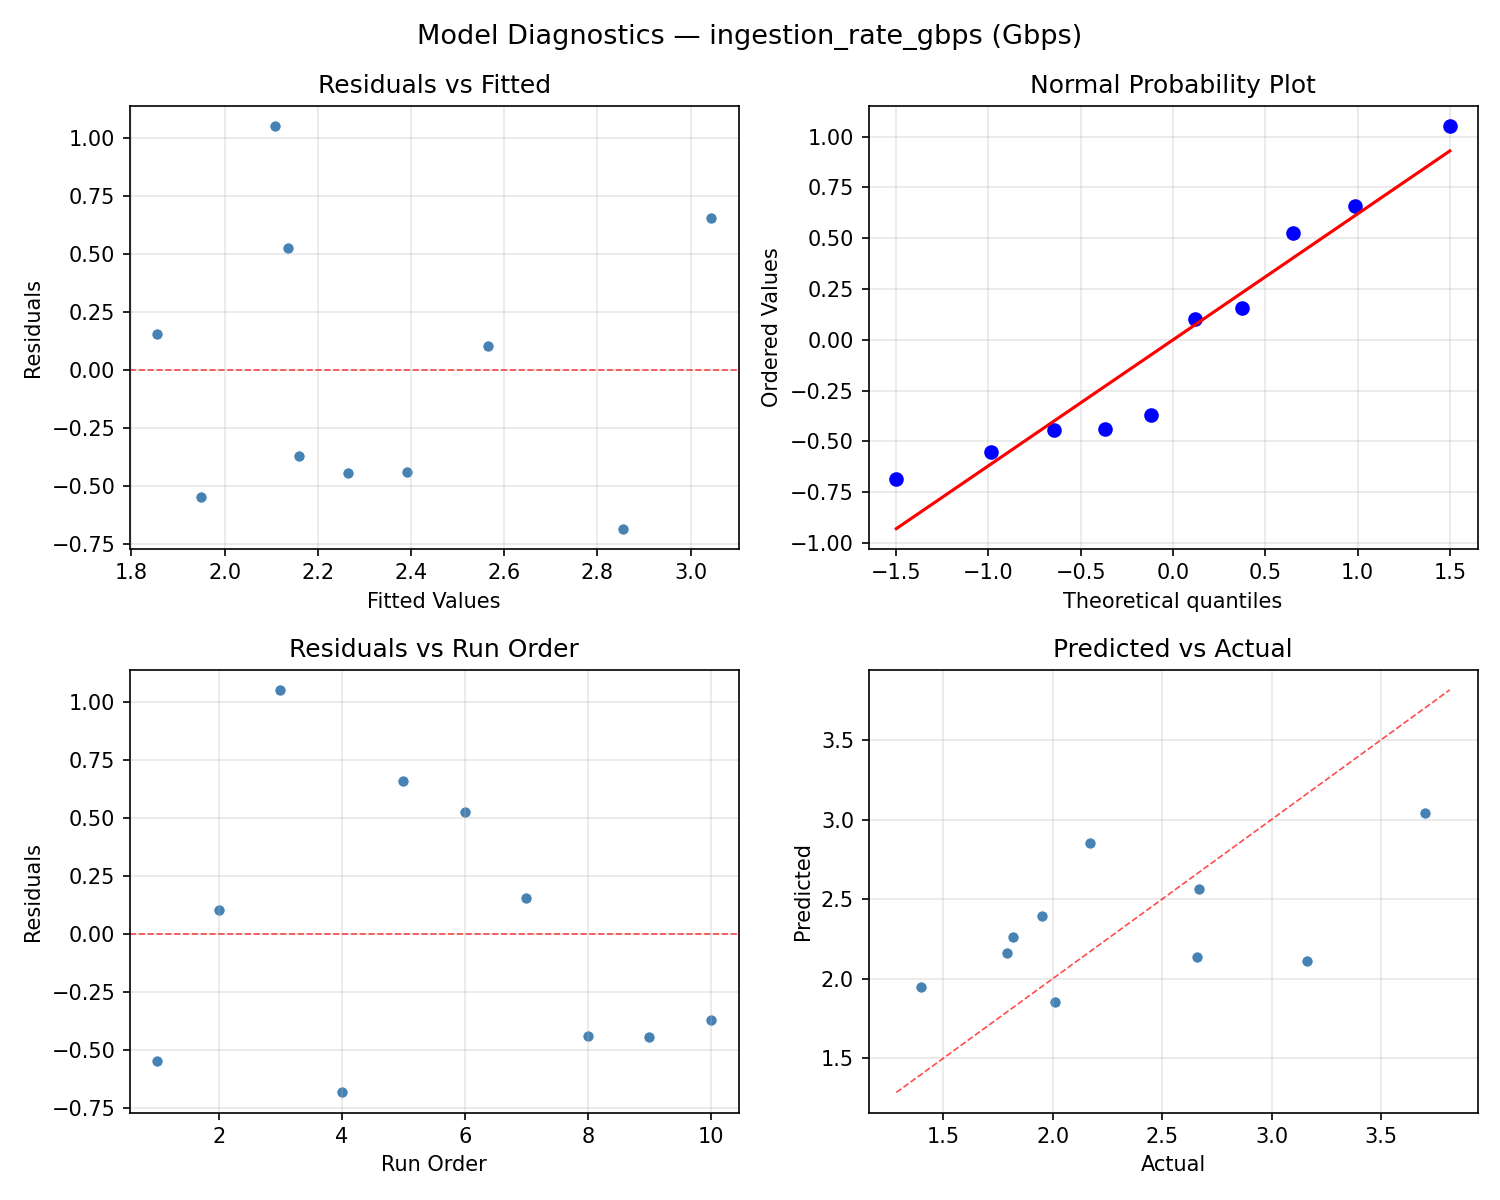
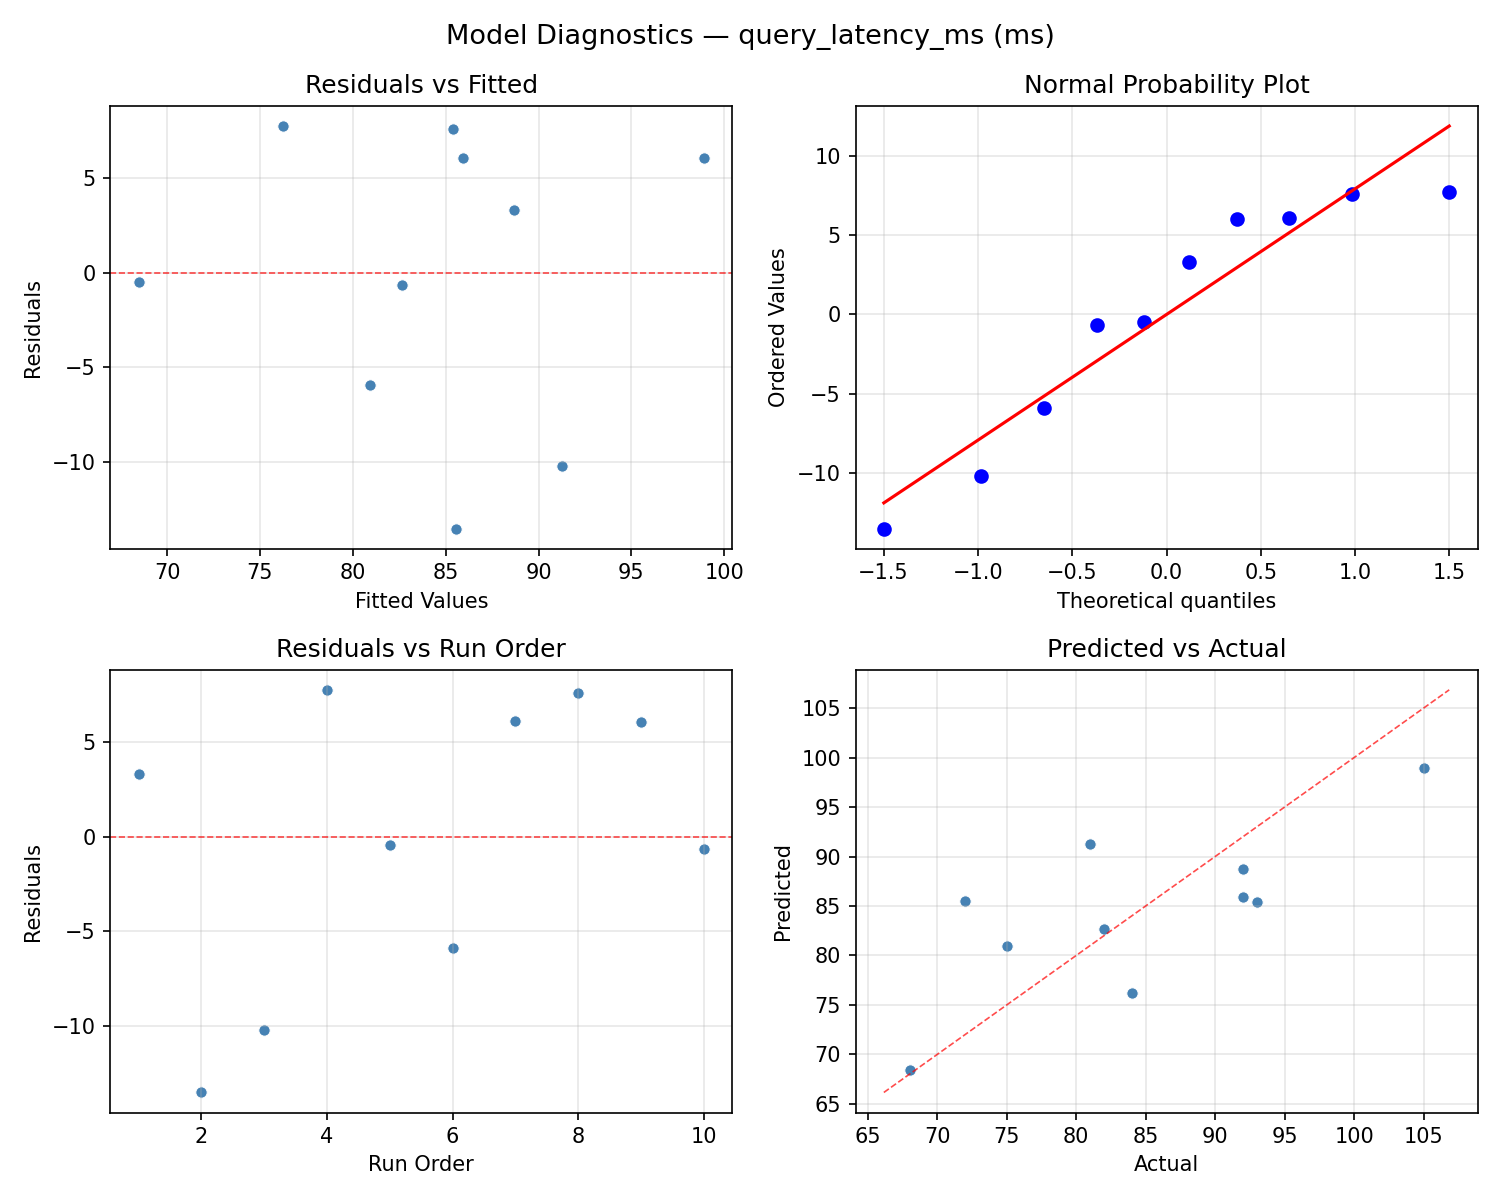
Model Diagnostics
Response: query_latency_ms
Top factors: batch_size_kb (25.0%), flush_interval_sec (25.0%), parser_threads (25.0%).
ANOVA
| Source | DF | SS | MS | F | p-value |
|---|
| Source | DF | SS | MS | F | p-value |
| batch_size_kb | 9 | 1142.4000 | 126.9333 | | |
| flush_interval_sec | 9 | 1142.4000 | 126.9333 | | |
| parser_threads | 9 | 1142.4000 | 126.9333 | | |
| compression_ratio | 9 | 1142.4000 | 126.9333 | | |
| Error | (Lenth | PSE) | 0 | 0.0000 | 0.0000 |
| Total | 9 | 1142.4000 | 126.9333 | | |
Pareto Chart
Main Effects Plot
Normal Probability Plot of Effects
Half-Normal Plot of Effects
Model Diagnostics
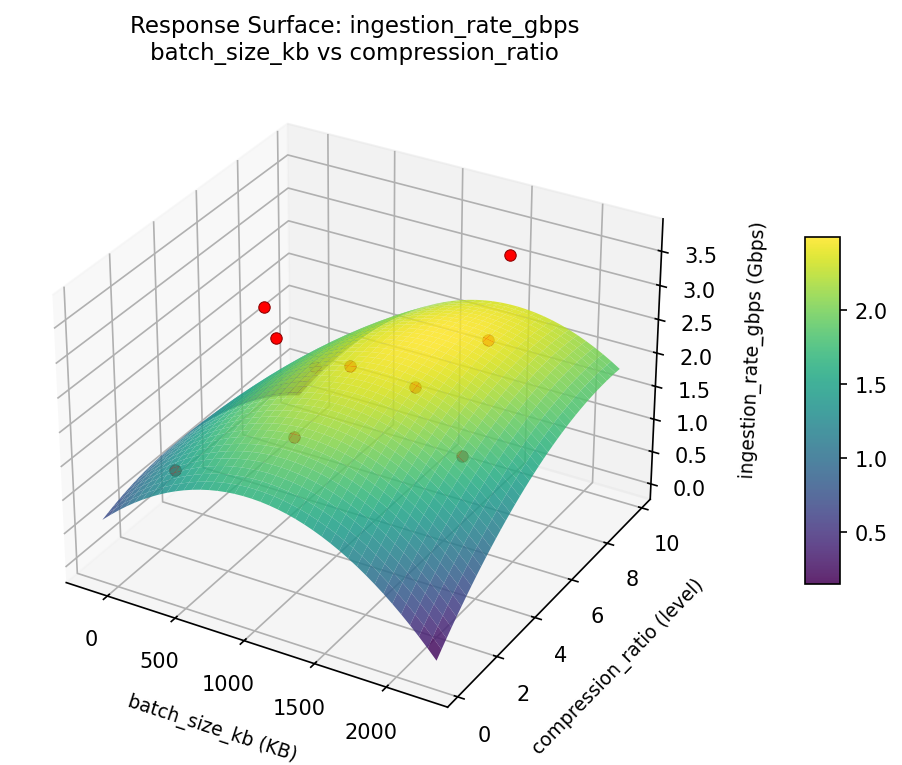
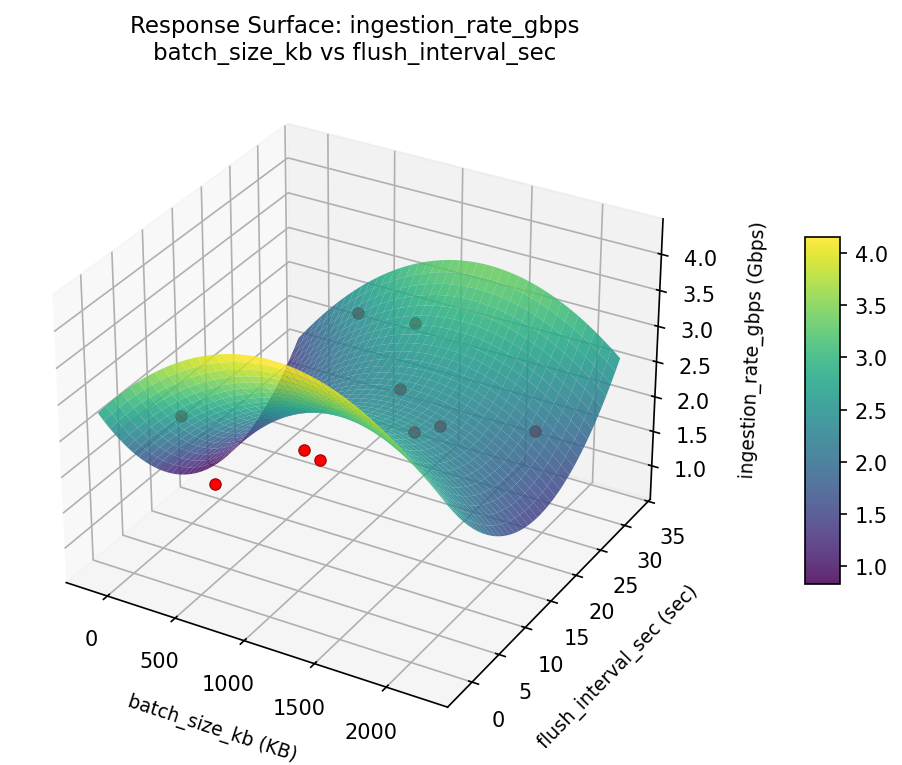
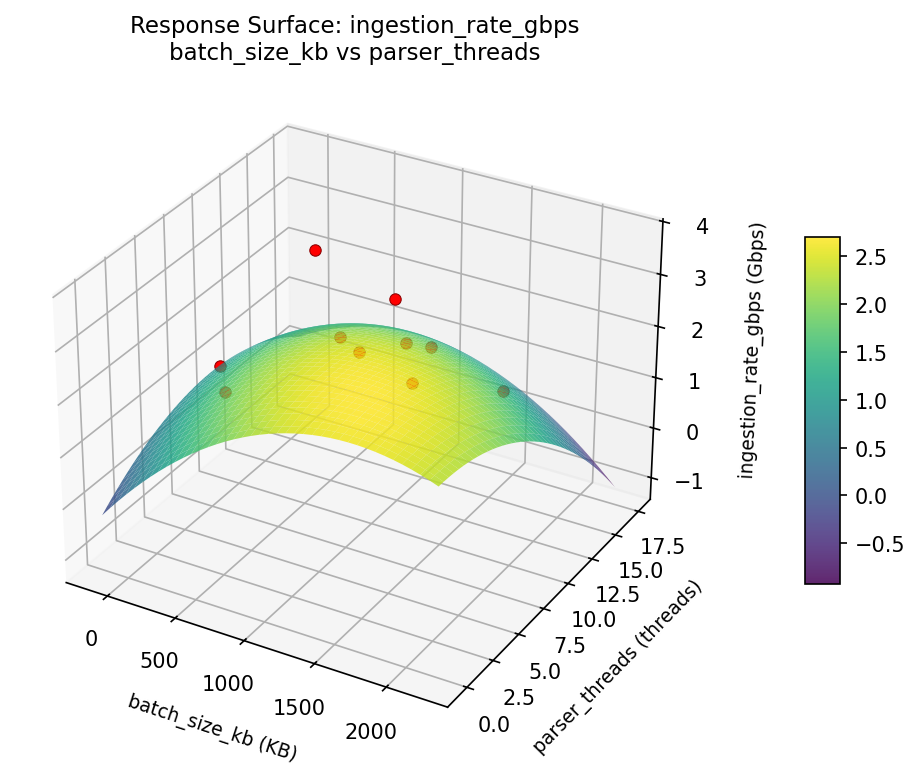
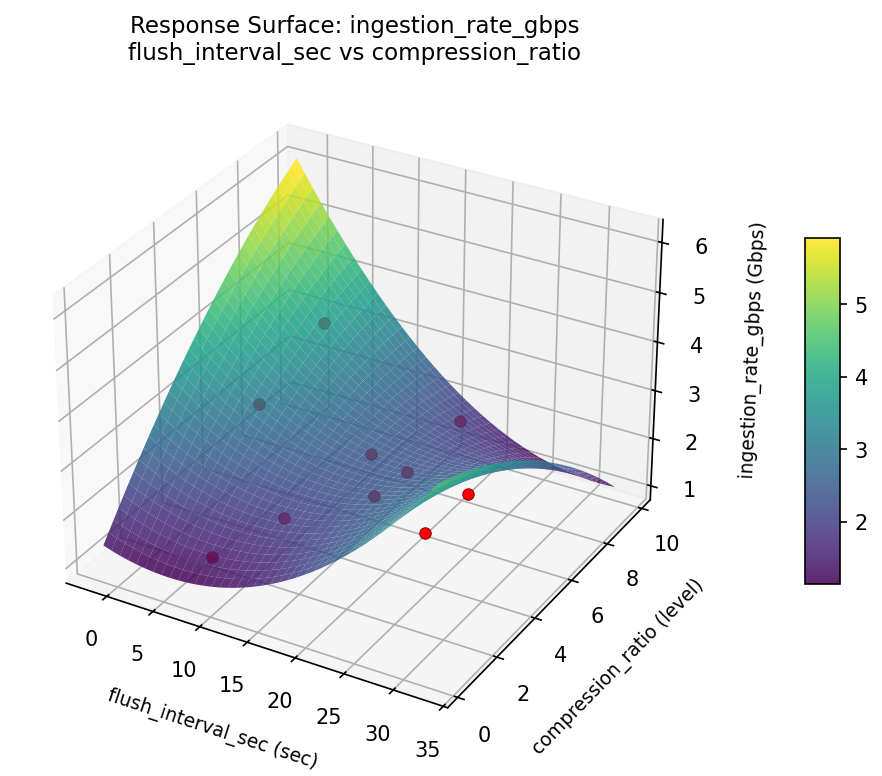
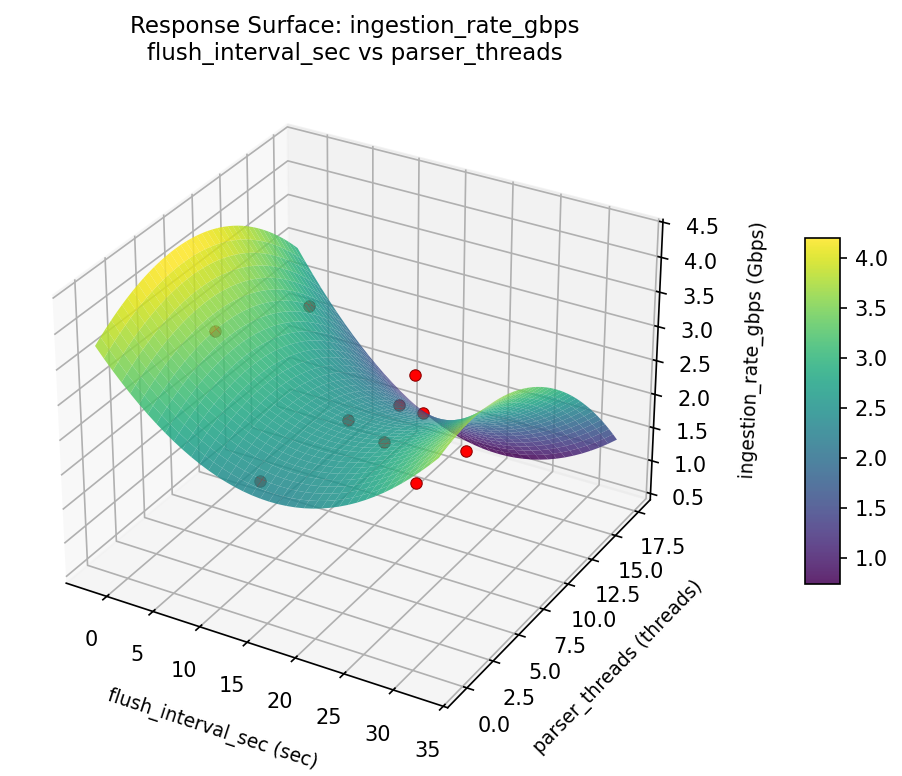
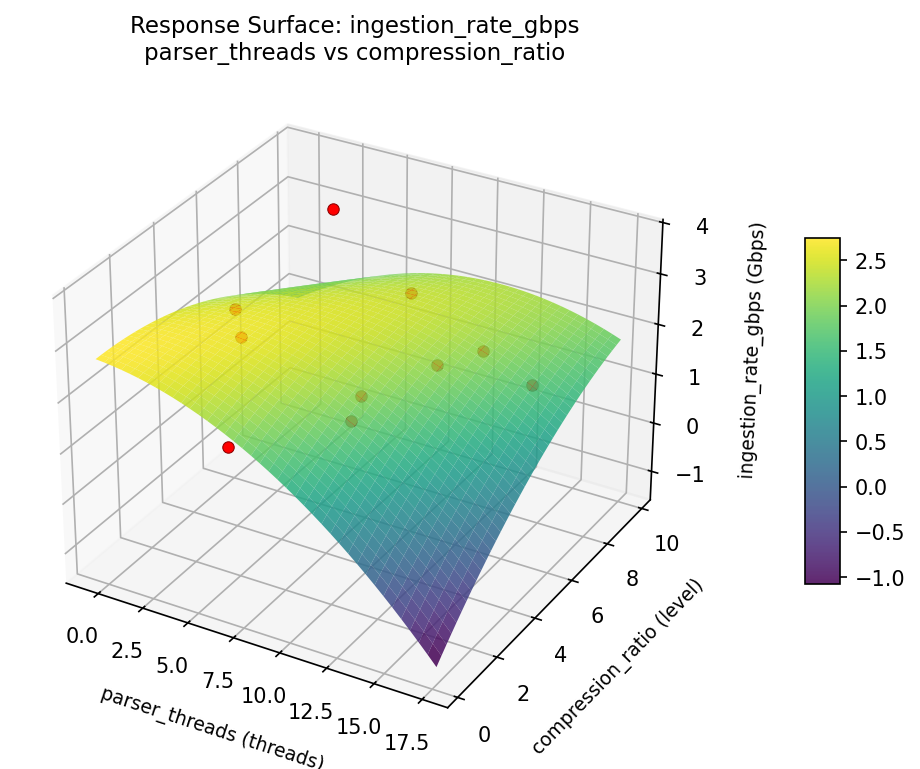
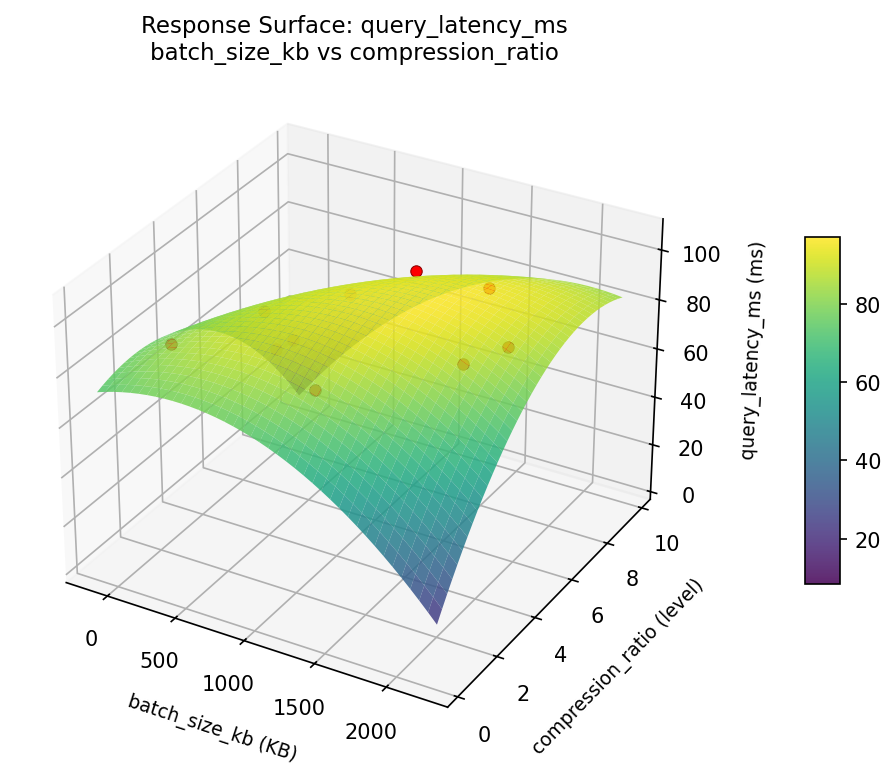
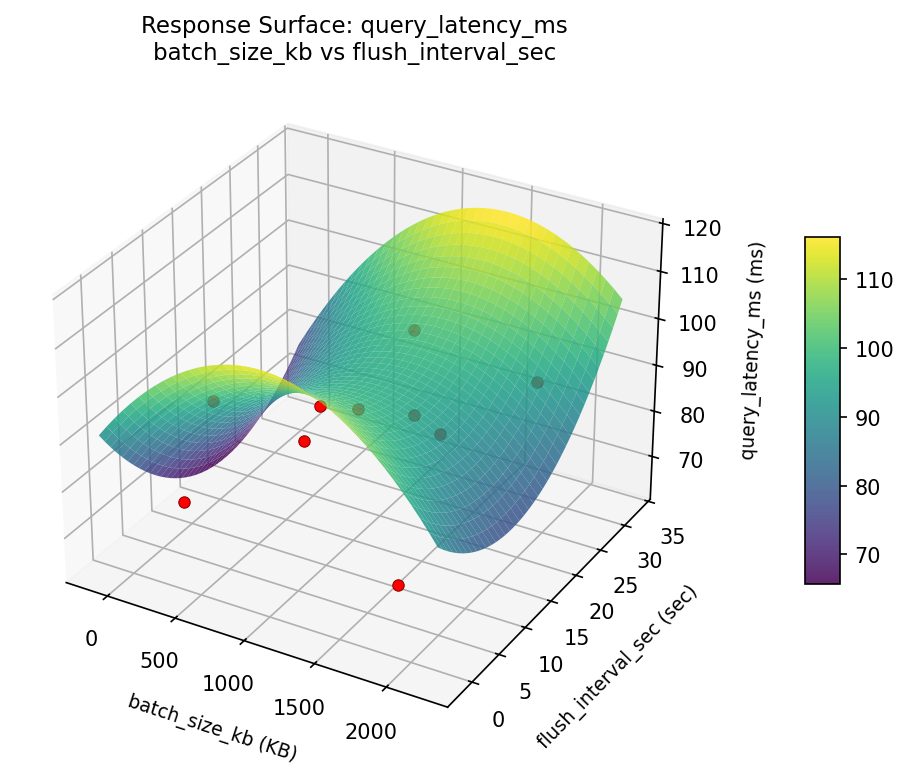
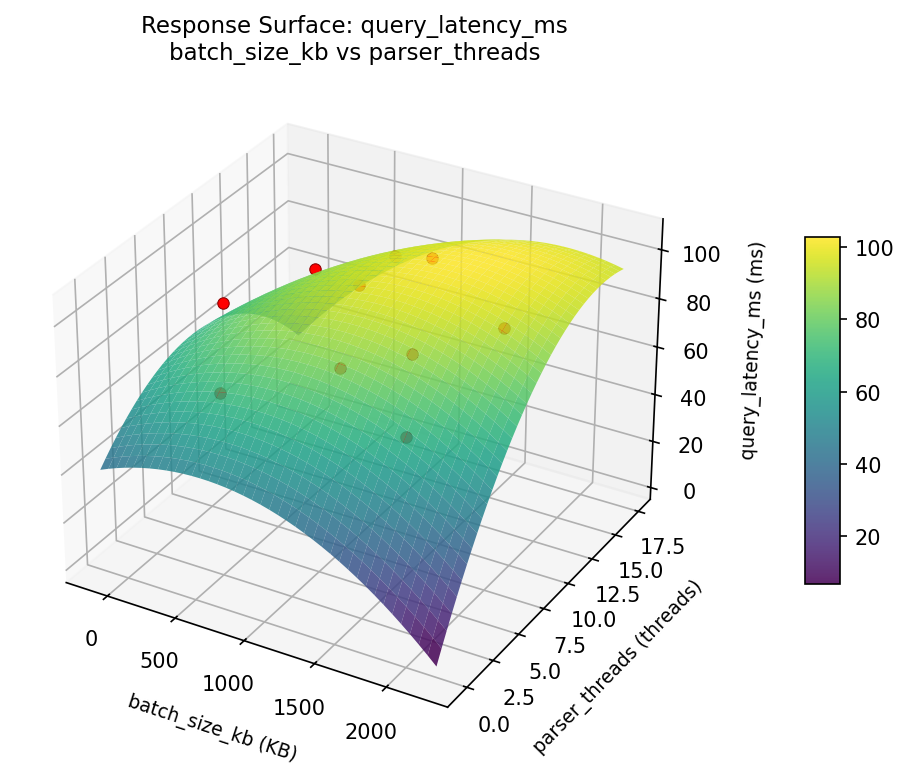
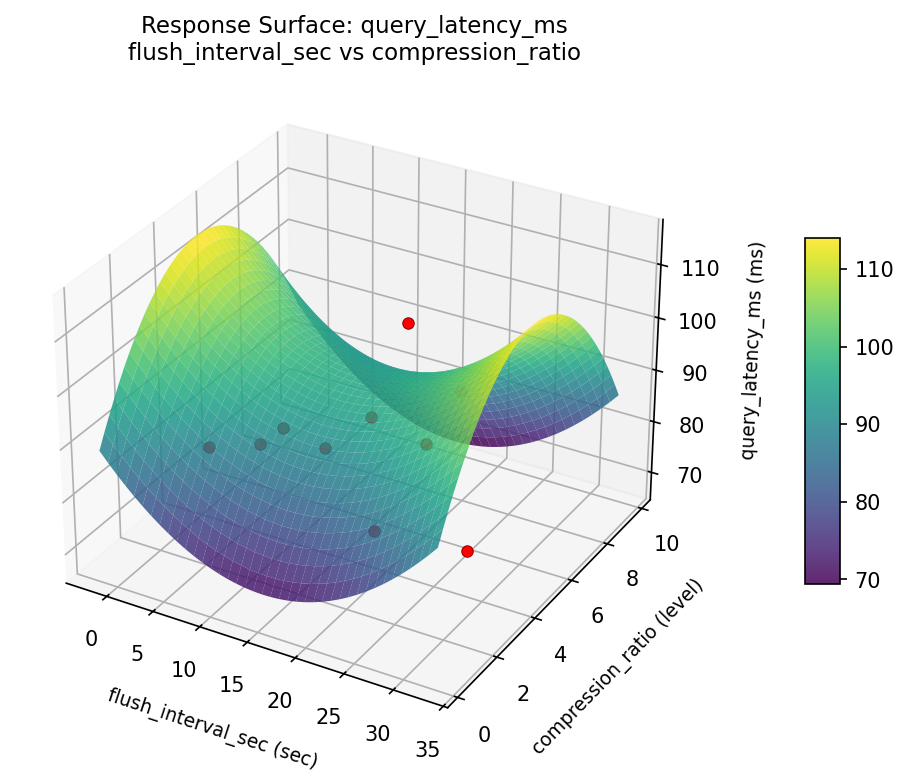
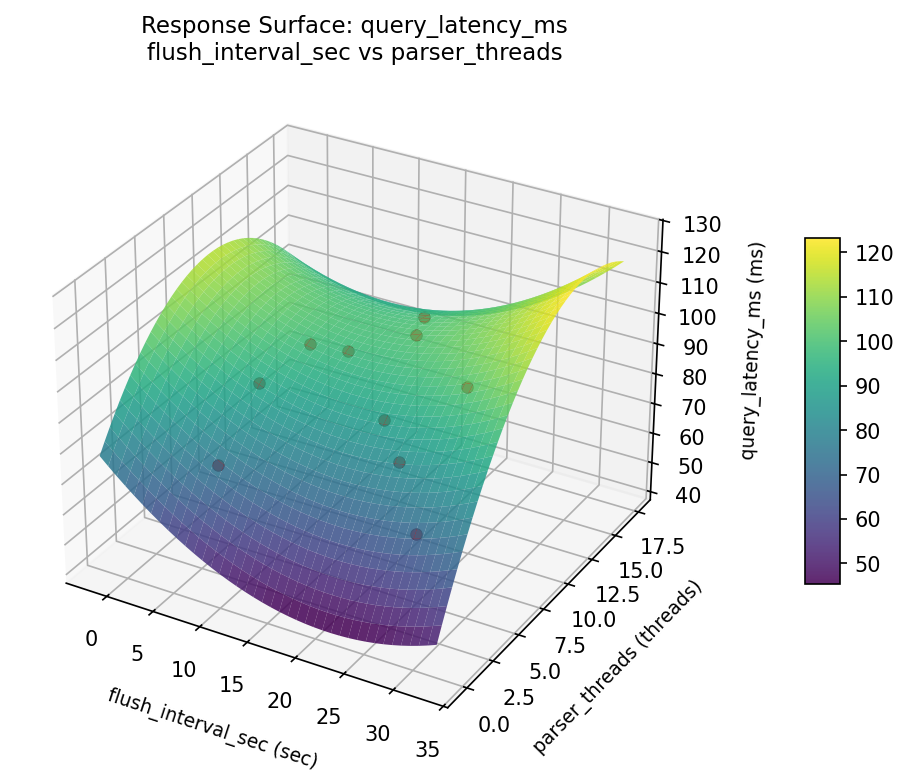
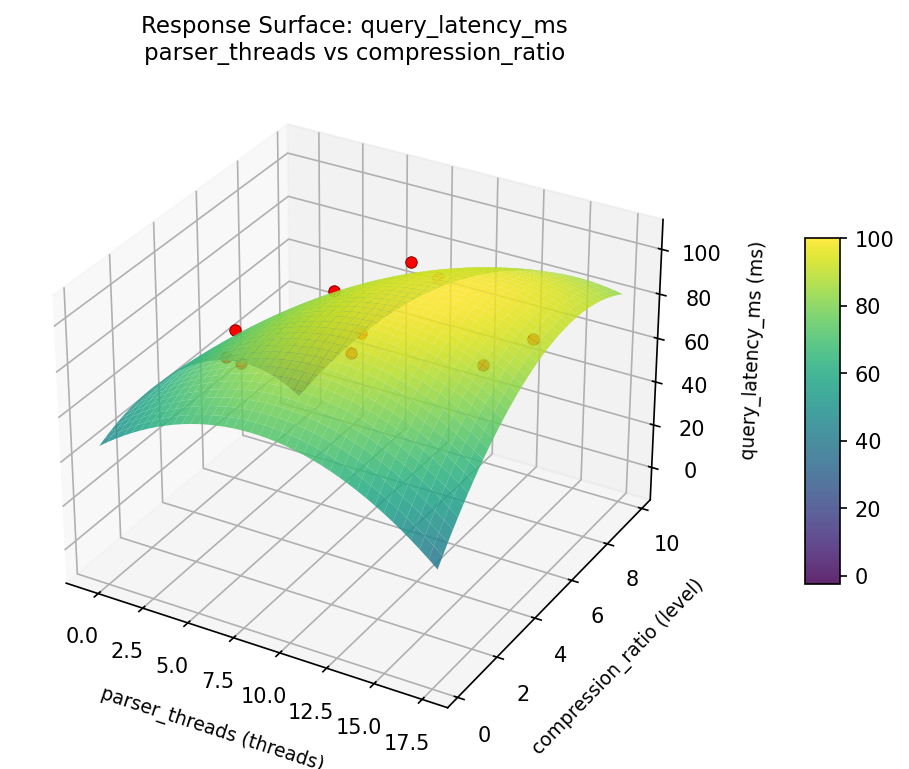
Response Surface Plots
3D surfaces fitted with quadratic RSM. Red dots are observed data points.
ingestion rate gbps batch size kb vs compression ratio
ingestion rate gbps batch size kb vs flush interval sec
ingestion rate gbps batch size kb vs parser threads
ingestion rate gbps flush interval sec vs compression ratio
ingestion rate gbps flush interval sec vs parser threads
ingestion rate gbps parser threads vs compression ratio
query latency ms batch size kb vs compression ratio
query latency ms batch size kb vs flush interval sec
query latency ms batch size kb vs parser threads
query latency ms flush interval sec vs compression ratio
query latency ms flush interval sec vs parser threads
query latency ms parser threads vs compression ratio
Multi-Objective Optimization
When responses compete, Derringer–Suich desirability finds the best compromise.
Each response is scaled to a 0–1 desirability, then combined via a weighted geometric mean.
Overall Desirability
D = 0.9545
Per-Response Desirability
| Response | Weight | Desirability | Predicted | Dir |
|---|
ingestion_rate_gbps |
1.5 |
|
3.70 0.9545 3.70 Gbps |
↑ |
query_latency_ms |
1.0 |
|
68.00 0.9545 68.00 ms |
↓ |
Recommended Settings
| Factor | Value |
|---|
batch_size_kb | 1872.78 KB |
flush_interval_sec | 14.64 sec |
parser_threads | 5.19131 threads |
compression_ratio | 5.47832 level |
Source: from observed run #5
Trade-off Summary
Sacrifice = how much worse than single-objective best.
| Response | Predicted | Best Observed | Sacrifice |
|---|
query_latency_ms | 68.00 | 68.00 | +0.00 |
Top 3 Runs by Desirability
| Run | D | Factor Settings |
|---|
| #3 | 0.6967 | batch_size_kb=736.725, flush_interval_sec=28.5047, parser_threads=11.9486, compression_ratio=7.20914 |
| #2 | 0.6547 | batch_size_kb=204.795, flush_interval_sec=8.69273, parser_threads=8.14509, compression_ratio=6.46288 |
Model Quality
| Response | R² | Type |
|---|
query_latency_ms | 0.1993 | linear |
Full Multi-Objective Output
============================================================
MULTI-OBJECTIVE OPTIMIZATION
Method: Derringer-Suich Desirability Function
============================================================
Overall desirability: D = 0.9545
Response Weight Desirability Predicted Direction
---------------------------------------------------------------------
ingestion_rate_gbps 1.5 0.9545 3.70 Gbps ↑
query_latency_ms 1.0 0.9545 68.00 ms ↓
Recommended settings:
batch_size_kb = 1872.78 KB
flush_interval_sec = 14.64 sec
parser_threads = 5.19131 threads
compression_ratio = 5.47832 level
(from observed run #5)
Trade-off summary:
ingestion_rate_gbps: 3.70 (best observed: 3.70, sacrifice: +0.00)
query_latency_ms: 68.00 (best observed: 68.00, sacrifice: +0.00)
Model quality:
ingestion_rate_gbps: R² = 0.1189 (linear)
query_latency_ms: R² = 0.1993 (linear)
Top 3 observed runs by overall desirability:
1. Run #5 (D=0.9545): batch_size_kb=1872.78, flush_interval_sec=14.64, parser_threads=5.19131, compression_ratio=5.47832
2. Run #3 (D=0.6967): batch_size_kb=736.725, flush_interval_sec=28.5047, parser_threads=11.9486, compression_ratio=7.20914
3. Run #2 (D=0.6547): batch_size_kb=204.795, flush_interval_sec=8.69273, parser_threads=8.14509, compression_ratio=6.46288
Full Analysis Output
=== Main Effects: ingestion_rate_gbps ===
Factor Effect Std Error % Contribution
--------------------------------------------------------------
batch_size_kb 2.3000 0.2231 25.0%
flush_interval_sec 2.3000 0.2231 25.0%
parser_threads 2.3000 0.2231 25.0%
compression_ratio 2.3000 0.2231 25.0%
=== ANOVA Table: ingestion_rate_gbps ===
Source DF SS MS F p-value
-----------------------------------------------------------------------------
batch_size_kb 9 4.4792 0.4977
flush_interval_sec 9 4.4792 0.4977
parser_threads 9 4.4792 0.4977
compression_ratio 9 4.4792 0.4977
Error (Lenth PSE) 0 0.0000 0.0000
Total 9 4.4792 0.4977
Note: Error estimated using Lenth's pseudo-standard-error (unreplicated design)
=== Summary Statistics: ingestion_rate_gbps ===
batch_size_kb:
Level N Mean Std Min Max
------------------------------------------------------------
1153.06 1 1.9500 0.0000 1.9500 1.9500
1358.87 1 2.6600 0.0000 2.6600 2.6600
1472.44 1 1.7900 0.0000 1.7900 1.7900
1831.39 1 2.0100 0.0000 2.0100 2.0100
2004.6 1 1.4000 0.0000 1.4000 1.4000
211.376 1 1.8200 0.0000 1.8200 1.8200
293.021 1 3.7000 0.0000 3.7000 3.7000
603.37 1 2.1700 0.0000 2.1700 2.1700
667.876 1 2.6700 0.0000 2.6700 2.6700
968.682 1 3.1600 0.0000 3.1600 3.1600
flush_interval_sec:
Level N Mean Std Min Max
------------------------------------------------------------
1.59509 1 2.1700 0.0000 2.1700 2.1700
11.8621 1 3.1600 0.0000 3.1600 3.1600
13.2675 1 1.8200 0.0000 1.8200 1.8200
17.7224 1 2.6600 0.0000 2.6600 2.6600
19.3943 1 2.0100 0.0000 2.0100 2.0100
21.4976 1 3.7000 0.0000 3.7000 3.7000
25.5951 1 2.6700 0.0000 2.6700 2.6700
29.4249 1 1.7900 0.0000 1.7900 1.7900
6.23932 1 1.9500 0.0000 1.9500 1.9500
7.85733 1 1.4000 0.0000 1.4000 1.4000
parser_threads:
Level N Mean Std Min Max
------------------------------------------------------------
10.519 1 2.6600 0.0000 2.6600 2.6600
12.076 1 2.6700 0.0000 2.6700 2.6700
13.5711 1 1.9500 0.0000 1.9500 1.9500
15.2336 1 1.7900 0.0000 1.7900 1.7900
2.17838 1 1.4000 0.0000 1.4000 1.4000
3.53524 1 3.7000 0.0000 3.7000 3.7000
5.17024 1 1.8200 0.0000 1.8200 1.8200
6.39347 1 2.0100 0.0000 2.0100 2.0100
8.3353 1 2.1700 0.0000 2.1700 2.1700
9.55697 1 3.1600 0.0000 3.1600 3.1600
compression_ratio:
Level N Mean Std Min Max
------------------------------------------------------------
1.70883 1 1.7900 0.0000 1.7900 1.7900
2.38634 1 2.6600 0.0000 2.6600 2.6600
3.18547 1 1.9500 0.0000 1.9500 1.9500
3.91857 1 1.8200 0.0000 1.8200 1.8200
4.26287 1 1.4000 0.0000 1.4000 1.4000
5.02237 1 2.0100 0.0000 2.0100 2.0100
6.30226 1 3.1600 0.0000 3.1600 3.1600
6.61585 1 2.6700 0.0000 2.6700 2.6700
7.86244 1 2.1700 0.0000 2.1700 2.1700
8.51439 1 3.7000 0.0000 3.7000 3.7000
=== Main Effects: query_latency_ms ===
Factor Effect Std Error % Contribution
--------------------------------------------------------------
batch_size_kb 37.0000 3.5628 25.0%
flush_interval_sec 37.0000 3.5628 25.0%
parser_threads 37.0000 3.5628 25.0%
compression_ratio 37.0000 3.5628 25.0%
=== ANOVA Table: query_latency_ms ===
Source DF SS MS F p-value
-----------------------------------------------------------------------------
batch_size_kb 9 1142.4000 126.9333
flush_interval_sec 9 1142.4000 126.9333
parser_threads 9 1142.4000 126.9333
compression_ratio 9 1142.4000 126.9333
Error (Lenth PSE) 0 0.0000 0.0000
Total 9 1142.4000 126.9333
Note: Error estimated using Lenth's pseudo-standard-error (unreplicated design)
=== Summary Statistics: query_latency_ms ===
batch_size_kb:
Level N Mean Std Min Max
------------------------------------------------------------
1153.06 1 93.0000 0.0000 93.0000 93.0000
1358.87 1 75.0000 0.0000 75.0000 75.0000
1472.44 1 82.0000 0.0000 82.0000 82.0000
1831.39 1 105.0000 0.0000 105.0000 105.0000
2004.6 1 92.0000 0.0000 92.0000 92.0000
211.376 1 92.0000 0.0000 92.0000 92.0000
293.021 1 68.0000 0.0000 68.0000 68.0000
603.37 1 84.0000 0.0000 84.0000 84.0000
667.876 1 72.0000 0.0000 72.0000 72.0000
968.682 1 81.0000 0.0000 81.0000 81.0000
flush_interval_sec:
Level N Mean Std Min Max
------------------------------------------------------------
1.59509 1 84.0000 0.0000 84.0000 84.0000
11.8621 1 81.0000 0.0000 81.0000 81.0000
13.2675 1 92.0000 0.0000 92.0000 92.0000
17.7224 1 75.0000 0.0000 75.0000 75.0000
19.3943 1 105.0000 0.0000 105.0000 105.0000
21.4976 1 68.0000 0.0000 68.0000 68.0000
25.5951 1 72.0000 0.0000 72.0000 72.0000
29.4249 1 82.0000 0.0000 82.0000 82.0000
6.23932 1 93.0000 0.0000 93.0000 93.0000
7.85733 1 92.0000 0.0000 92.0000 92.0000
parser_threads:
Level N Mean Std Min Max
------------------------------------------------------------
10.519 1 75.0000 0.0000 75.0000 75.0000
12.076 1 72.0000 0.0000 72.0000 72.0000
13.5711 1 93.0000 0.0000 93.0000 93.0000
15.2336 1 82.0000 0.0000 82.0000 82.0000
2.17838 1 92.0000 0.0000 92.0000 92.0000
3.53524 1 68.0000 0.0000 68.0000 68.0000
5.17024 1 92.0000 0.0000 92.0000 92.0000
6.39347 1 105.0000 0.0000 105.0000 105.0000
8.3353 1 84.0000 0.0000 84.0000 84.0000
9.55697 1 81.0000 0.0000 81.0000 81.0000
compression_ratio:
Level N Mean Std Min Max
------------------------------------------------------------
1.70883 1 82.0000 0.0000 82.0000 82.0000
2.38634 1 75.0000 0.0000 75.0000 75.0000
3.18547 1 93.0000 0.0000 93.0000 93.0000
3.91857 1 92.0000 0.0000 92.0000 92.0000
4.26287 1 92.0000 0.0000 92.0000 92.0000
5.02237 1 105.0000 0.0000 105.0000 105.0000
6.30226 1 81.0000 0.0000 81.0000 81.0000
6.61585 1 72.0000 0.0000 72.0000 72.0000
7.86244 1 84.0000 0.0000 84.0000 84.0000
8.51439 1 68.0000 0.0000 68.0000 68.0000
Optimization Recommendations
=== Optimization: ingestion_rate_gbps ===
Direction: maximize
Best observed run: #5
batch_size_kb = 710.913
flush_interval_sec = 6.36183
parser_threads = 15.6821
compression_ratio = 8.87697
Value: 3.7
RSM Model (linear, R² = 0.4826, Adj R² = 0.0687):
Coefficients:
intercept +2.3493
batch_size_kb +0.5204
flush_interval_sec -0.6488
parser_threads +0.5207
compression_ratio +0.3249
Predicted optimum (from linear model, at observed points):
batch_size_kb = 710.913
flush_interval_sec = 6.36183
parser_threads = 15.6821
compression_ratio = 8.87697
Predicted value: 3.3907
Surface optimum (via L-BFGS-B, linear model):
batch_size_kb = 2048
flush_interval_sec = 1
parser_threads = 16
compression_ratio = 9
Predicted value: 4.3640
Model quality: Weak fit — consider adding center points or using a different design.
Factor importance:
1. batch_size_kb (effect: 2.3, contribution: 25.0%)
2. flush_interval_sec (effect: 2.3, contribution: 25.0%)
3. parser_threads (effect: 2.3, contribution: 25.0%)
4. compression_ratio (effect: 2.3, contribution: 25.0%)
=== Optimization: query_latency_ms ===
Direction: minimize
Best observed run: #5
batch_size_kb = 710.913
flush_interval_sec = 6.36183
parser_threads = 15.6821
compression_ratio = 8.87697
Value: 68.0
RSM Model (linear, R² = 0.3511, Adj R² = -0.1679):
Coefficients:
intercept +84.1342
batch_size_kb -5.2195
flush_interval_sec +2.8405
parser_threads -5.6604
compression_ratio -8.7842
Predicted optimum (from linear model, at observed points):
batch_size_kb = 558.859
flush_interval_sec = 10.1326
parser_threads = 9.57978
compression_ratio = 1.0075
Predicted value: 93.6513
Surface optimum (via L-BFGS-B, linear model):
batch_size_kb = 2048
flush_interval_sec = 1
parser_threads = 16
compression_ratio = 9
Predicted value: 61.6297
Model quality: Weak fit — consider adding center points or using a different design.
Factor importance:
1. batch_size_kb (effect: 37.0, contribution: 25.0%)
2. flush_interval_sec (effect: 37.0, contribution: 25.0%)
3. parser_threads (effect: 37.0, contribution: 25.0%)
4. compression_ratio (effect: 37.0, contribution: 25.0%)