Summary
This experiment investigates chaos engineering blast radius. Central Composite design to optimize failure injection, experiment duration, and steady state threshold for resilience.
The design varies 3 factors: failure injection pct (%), ranging from 5 to 50, experiment duration min (min), ranging from 5 to 30, and steady state threshold (ratio), ranging from 0.9 to 0.99. The goal is to optimize 2 responses: resilience score (score) (maximize) and blast radius services (count) (minimize). Fixed conditions held constant across all runs include tool = litmus, target = microservices.
A Central Composite Design (CCD) was selected to fit a full quadratic response surface model, including curvature and interaction effects. With 3 factors this produces 22 runs including center points and axial (star) points that extend beyond the factorial range.
Quadratic response surface models were fitted to capture potential curvature and factor interactions. The RSM contour plots below visualize how pairs of factors jointly affect each response.
Key Findings
For resilience score, the most influential factors were steady state threshold (43.3%), experiment duration min (36.5%), failure injection pct (20.1%). The best observed value was 86.7 (at failure injection pct = 50, experiment duration min = 30, steady state threshold = 0.9).
For blast radius services, the most influential factors were steady state threshold (66.7%), experiment duration min (19.0%), failure injection pct (14.3%). The best observed value was 0.0 (at failure injection pct = 27.5, experiment duration min = 40.3218, steady state threshold = 0.945).
Recommended Next Steps
- Run confirmation experiments at the predicted optimal settings to validate the model.
- Consider whether any fixed factors should be varied in a future study.
Experimental Setup
Factors
| Factor | Low | High | Unit |
|---|
failure_injection_pct | 5 | 50 | % |
experiment_duration_min | 5 | 30 | min |
steady_state_threshold | 0.9 | 0.99 | ratio |
Fixed: tool = litmus, target = microservices
Responses
| Response | Direction | Unit |
|---|
resilience_score | ↑ maximize | score |
blast_radius_services | ↓ minimize | count |
Configuration
{
"metadata": {
"name": "Chaos Engineering Blast Radius",
"description": "Central Composite design to optimize failure injection, experiment duration, and steady state threshold for resilience"
},
"factors": [
{
"name": "failure_injection_pct",
"levels": [
"5",
"50"
],
"type": "continuous",
"unit": "%"
},
{
"name": "experiment_duration_min",
"levels": [
"5",
"30"
],
"type": "continuous",
"unit": "min"
},
{
"name": "steady_state_threshold",
"levels": [
"0.9",
"0.99"
],
"type": "continuous",
"unit": "ratio"
}
],
"fixed_factors": {
"tool": "litmus",
"target": "microservices"
},
"responses": [
{
"name": "resilience_score",
"optimize": "maximize",
"unit": "score"
},
{
"name": "blast_radius_services",
"optimize": "minimize",
"unit": "count"
}
],
"settings": {
"operation": "central_composite",
"test_script": "use_cases/86_chaos_engineering_blast_radius/sim.sh"
}
}
Experimental Matrix
The Central Composite Design produces 22 runs. Each row is one experiment with specific factor settings.
| Run | failure_injection_pct | experiment_duration_min | steady_state_threshold |
|---|
| 1 | 27.5 | 17.5 | 0.945 |
| 2 | 50 | 5 | 0.99 |
| 3 | 5 | 30 | 0.9 |
| 4 | 27.5 | 40.3218 | 0.945 |
| 5 | 27.5 | 17.5 | 0.945 |
| 6 | -13.5792 | 17.5 | 0.945 |
| 7 | 27.5 | 17.5 | 0.862842 |
| 8 | 27.5 | 17.5 | 0.945 |
| 9 | 50 | 30 | 0.9 |
| 10 | 68.5792 | 17.5 | 0.945 |
| 11 | 27.5 | 17.5 | 0.945 |
| 12 | 27.5 | -5.32177 | 0.945 |
| 13 | 27.5 | 17.5 | 0.945 |
| 14 | 5 | 5 | 0.99 |
| 15 | 27.5 | 17.5 | 0.945 |
| 16 | 50 | 5 | 0.9 |
| 17 | 27.5 | 17.5 | 1.02716 |
| 18 | 50 | 30 | 0.99 |
| 19 | 27.5 | 17.5 | 0.945 |
| 20 | 5 | 5 | 0.9 |
| 21 | 5 | 30 | 0.99 |
| 22 | 27.5 | 17.5 | 0.945 |
Step-by-Step Workflow
1
Preview the design
$ doe info --config use_cases/86_chaos_engineering_blast_radius/config.json
2
Generate the runner script
$ doe generate --config use_cases/86_chaos_engineering_blast_radius/config.json \
--output use_cases/86_chaos_engineering_blast_radius/results/run.sh --seed 42
3
Execute the experiments
$ bash use_cases/86_chaos_engineering_blast_radius/results/run.sh
4
Analyze results
$ doe analyze --config use_cases/86_chaos_engineering_blast_radius/config.json
5
Get optimization recommendations
$ doe optimize --config use_cases/86_chaos_engineering_blast_radius/config.json
6
Multi-objective optimization
With 2 competing responses, use --multi to find the best compromise via Derringer–Suich desirability.
$ doe optimize --config use_cases/86_chaos_engineering_blast_radius/config.json --multi
7
Generate the HTML report
$ doe report --config use_cases/86_chaos_engineering_blast_radius/config.json \
--output use_cases/86_chaos_engineering_blast_radius/results/report.html
Features Exercised
| Feature | Value |
|---|
| Design type | central_composite |
| Factor types | continuous (all 3) |
| Arg style | double-dash |
| Responses | 2 (resilience_score ↑, blast_radius_services ↓) |
| Total runs | 22 |
Analysis Results
Generated from actual experiment runs using the DOE Helper Tool.
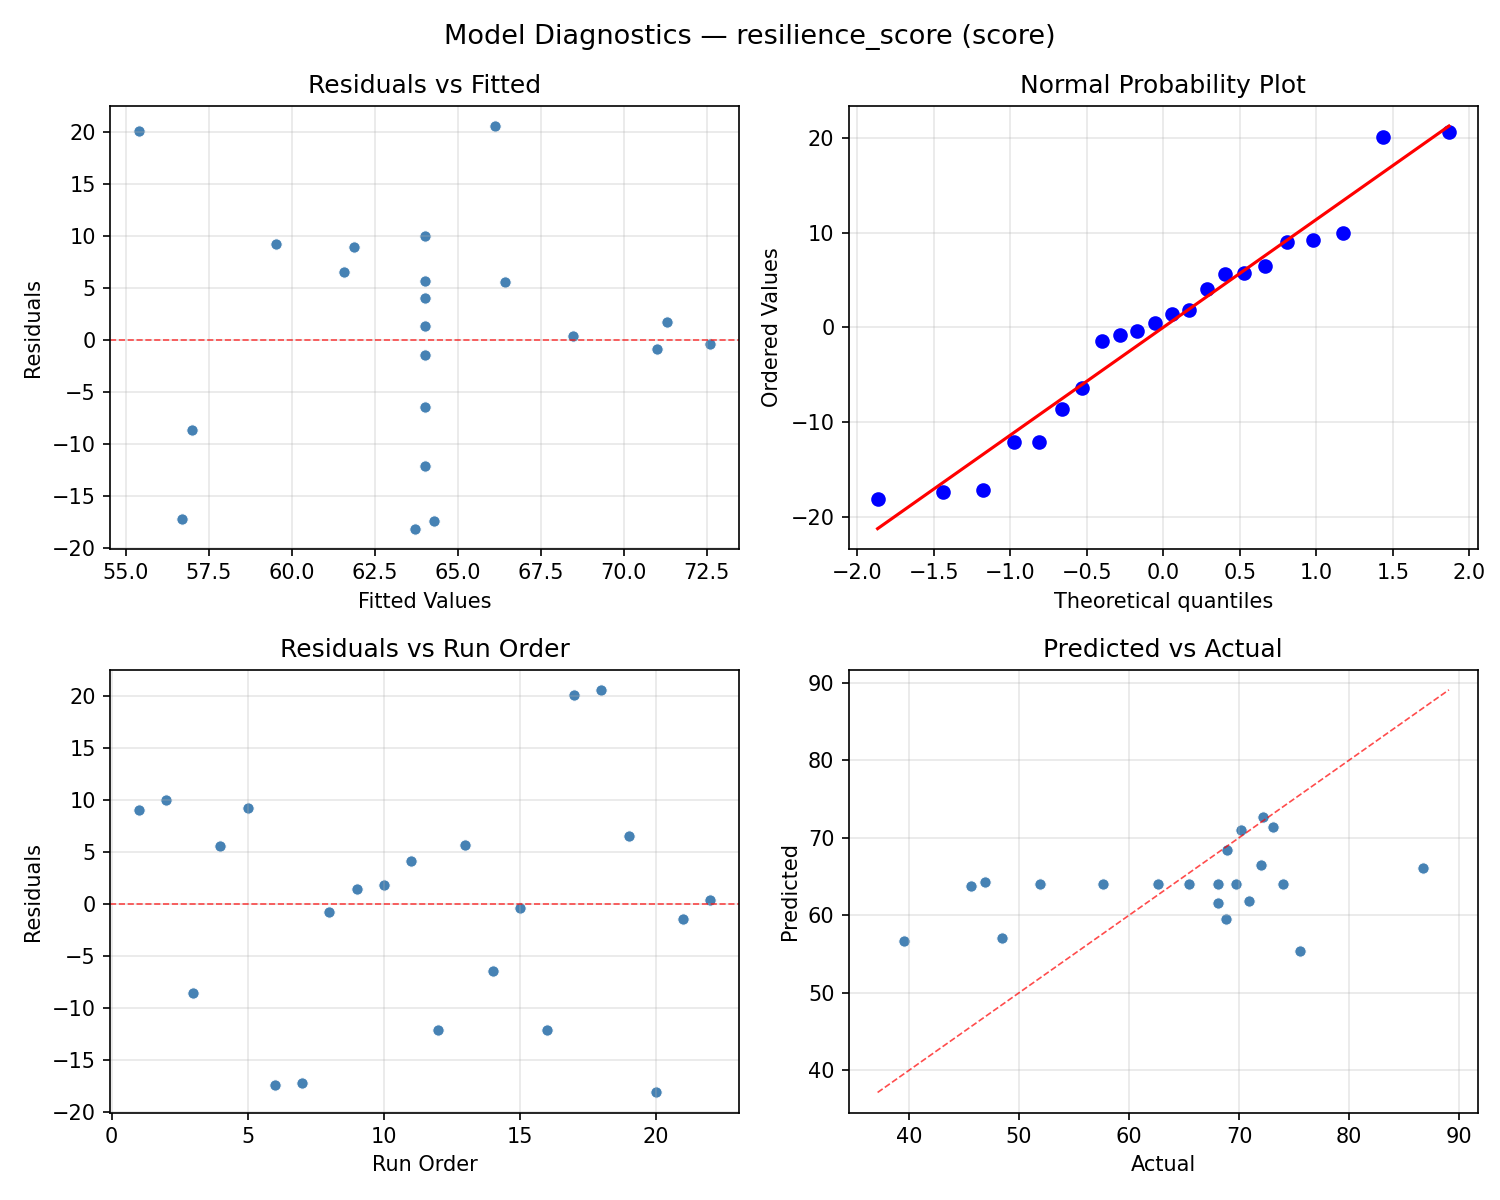
Response: resilience_score
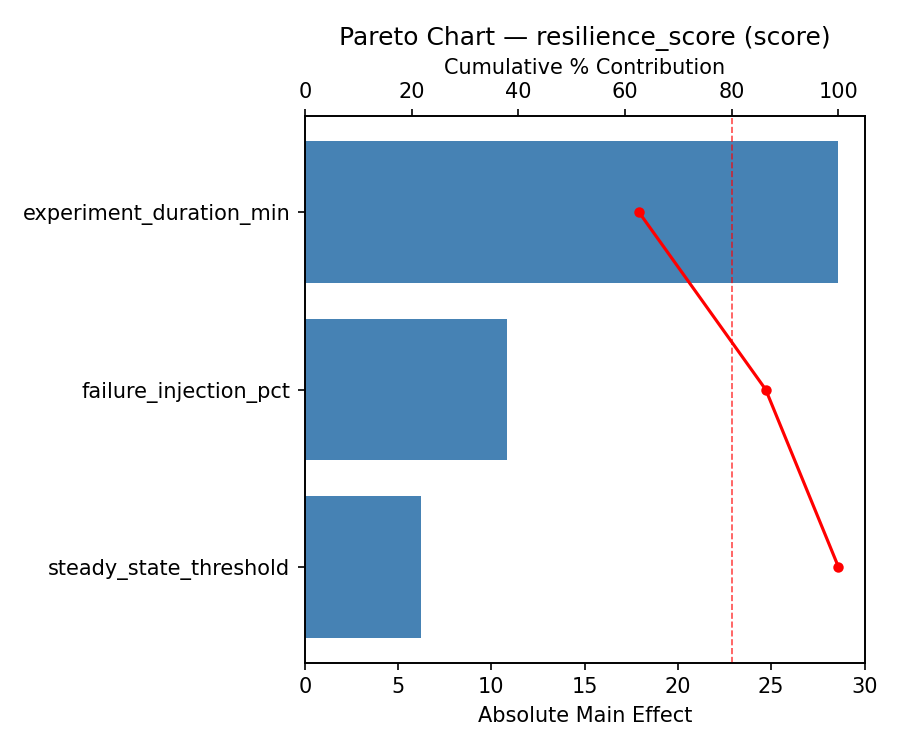
Top factors: steady_state_threshold (43.3%), experiment_duration_min (36.5%), failure_injection_pct (20.1%).
ANOVA
| Source | DF | SS | MS | F | p-value |
|---|
| Source | DF | SS | MS | F | p-value |
| failure_injection_pct | 4 | 191.0283 | 47.7571 | 0.218 | 0.9219 |
| experiment_duration_min | 4 | 405.2758 | 101.3190 | 0.462 | 0.7623 |
| steady_state_threshold | 4 | 429.2083 | 107.3021 | 0.489 | 0.7440 |
| Lack | of | Fit | 2 | 412.8787 | 206.4394 |
| Pure | Error | 7 | 1534.6888 | | |
| Error | 9 | 1947.5675 | 219.2413 | | |
| Total | 21 | 2973.0800 | 141.5752 | | |
Pareto Chart
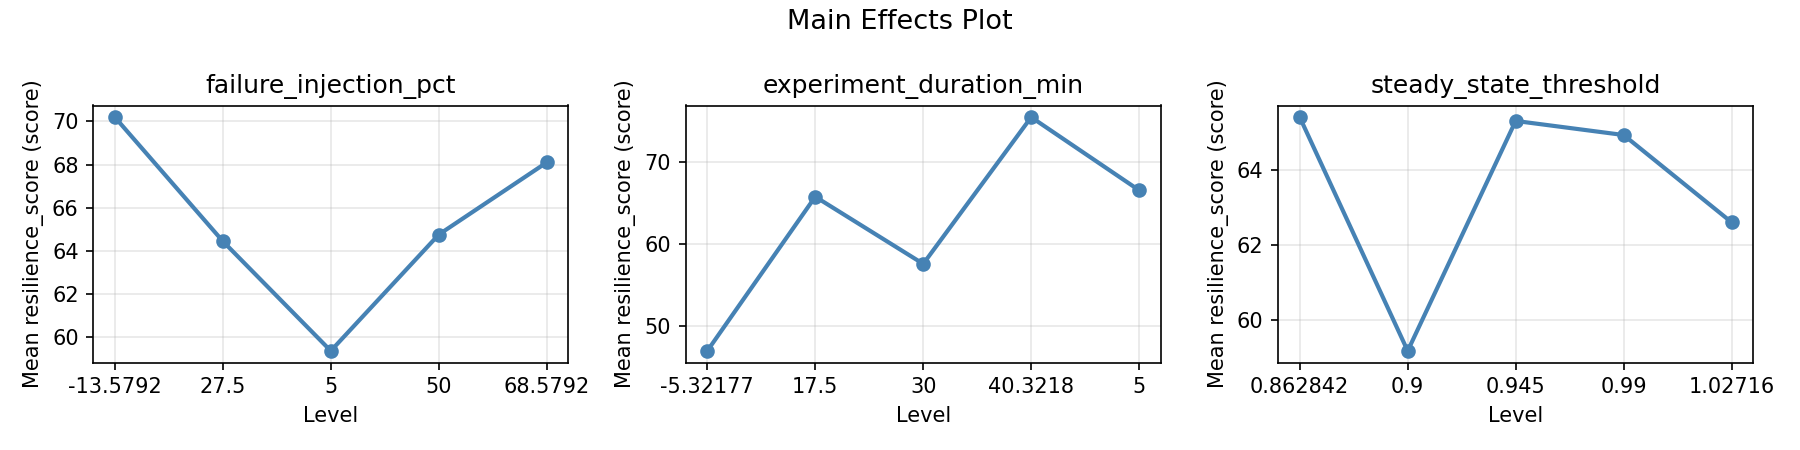
Main Effects Plot
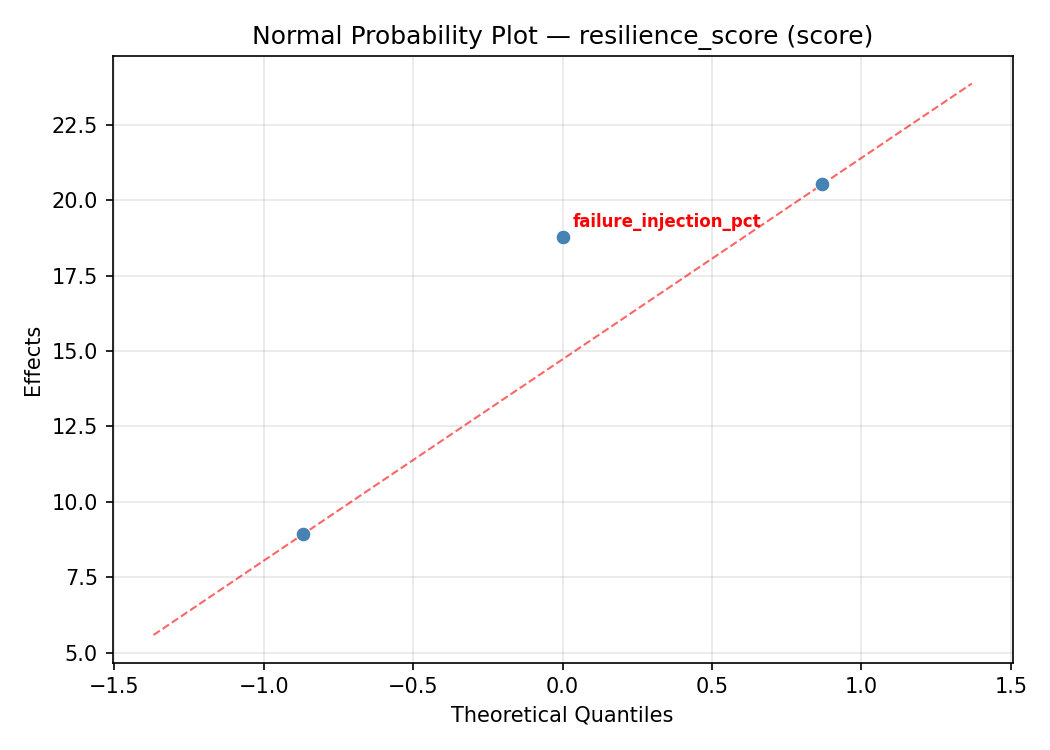
Normal Probability Plot of Effects
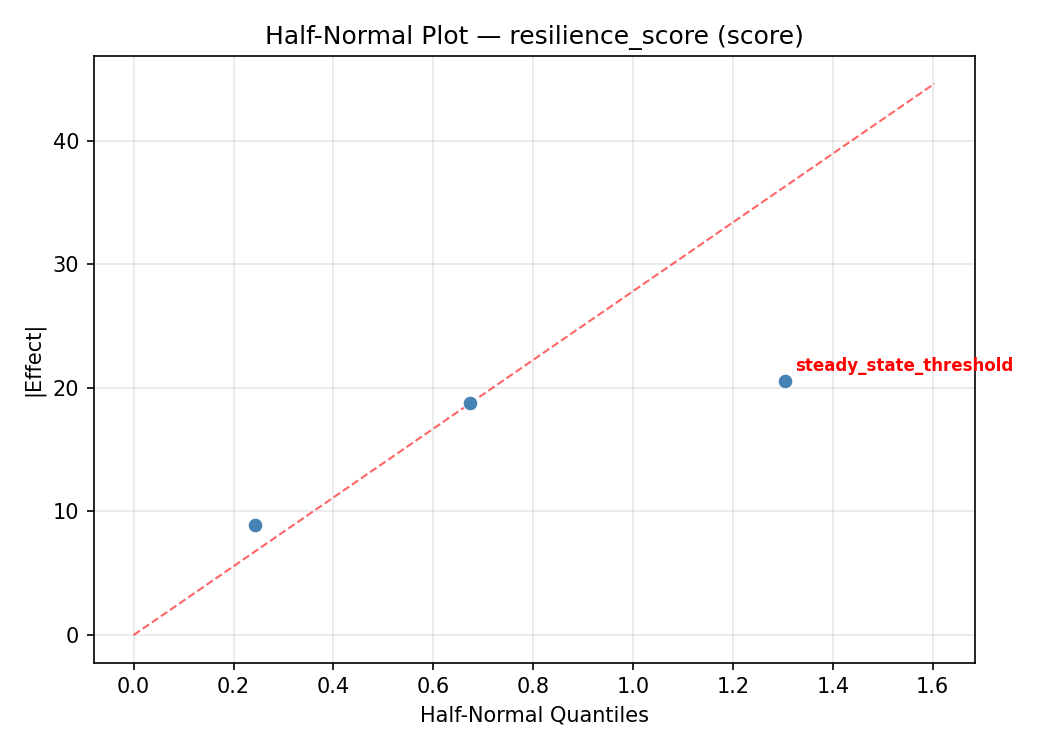
Half-Normal Plot of Effects
Model Diagnostics
Response: blast_radius_services
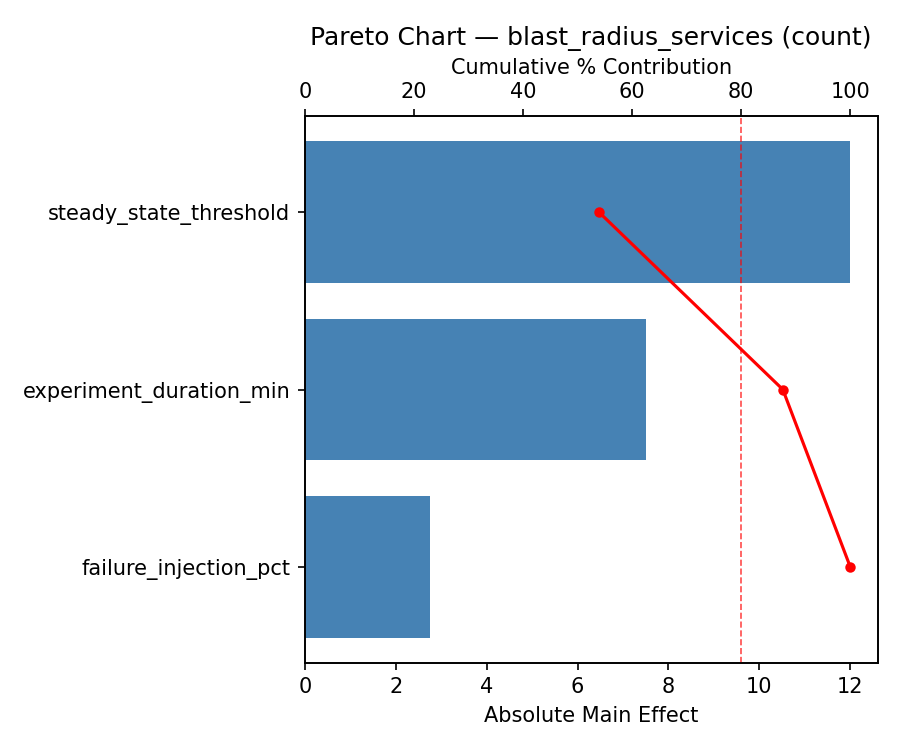
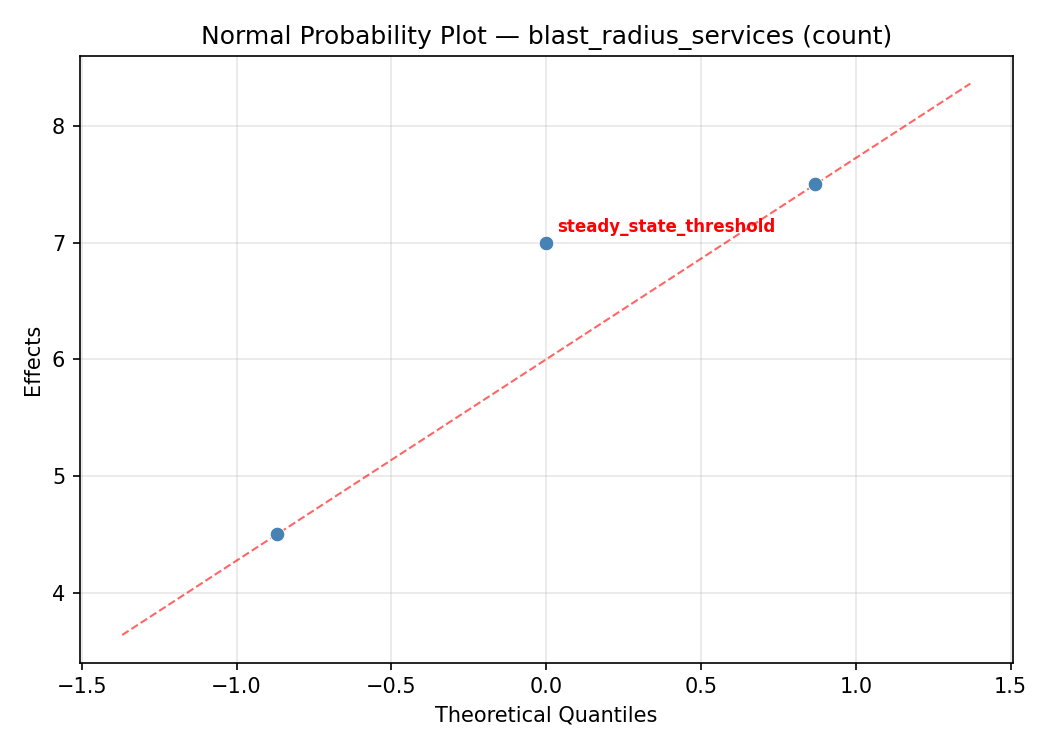
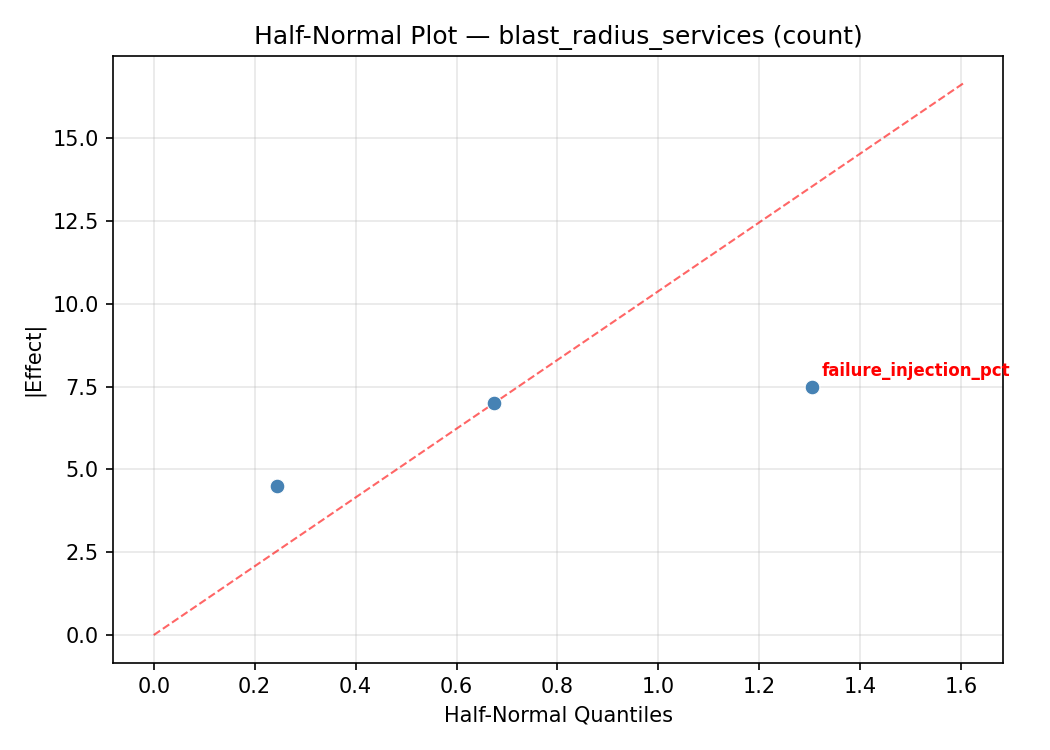
Top factors: steady_state_threshold (66.7%), experiment_duration_min (19.0%), failure_injection_pct (14.3%).
ANOVA
| Source | DF | SS | MS | F | p-value |
|---|
| Source | DF | SS | MS | F | p-value |
| failure_injection_pct | 4 | 30.9470 | 7.7367 | 0.387 | 0.8130 |
| experiment_duration_min | 4 | 22.3636 | 5.5909 | 0.280 | 0.8840 |
| steady_state_threshold | 4 | 119.6136 | 29.9034 | 1.495 | 0.2824 |
| Lack | of | Fit | 2 | 14.9394 | 7.4697 |
| Pure | Error | 7 | 140.0000 | | |
| Error | 9 | 154.9394 | 20.0000 | | |
| Total | 21 | 327.8636 | 15.6126 | | |
Pareto Chart
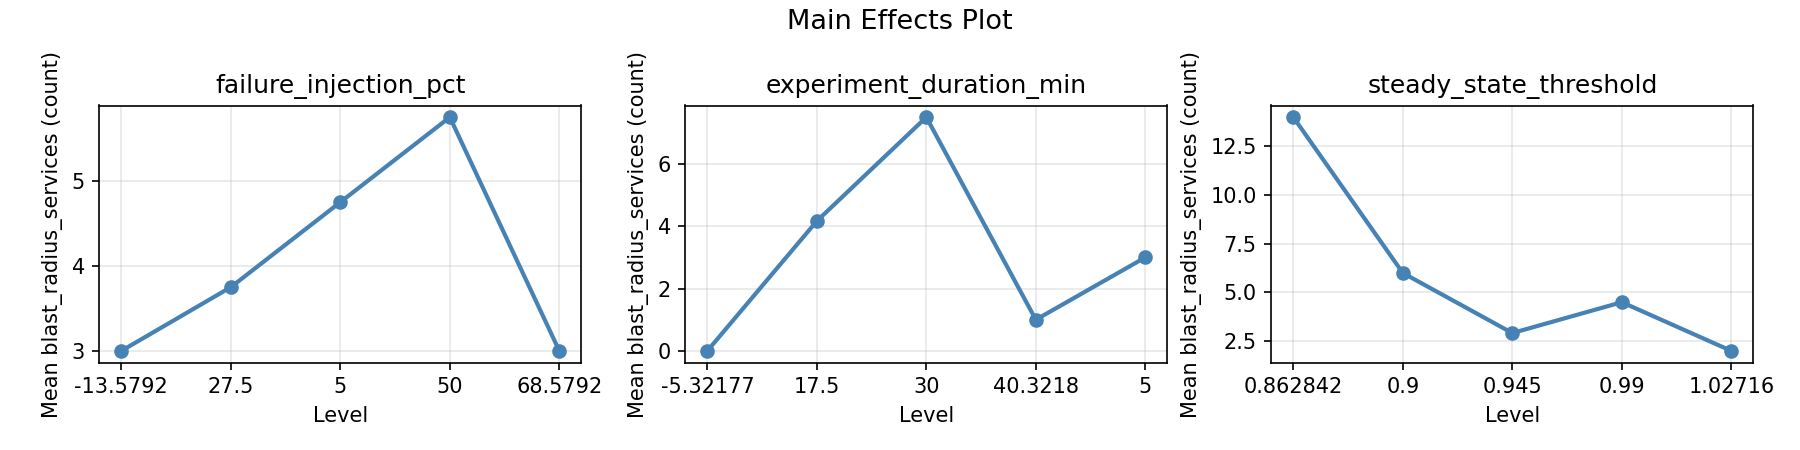
Main Effects Plot
Normal Probability Plot of Effects
Half-Normal Plot of Effects
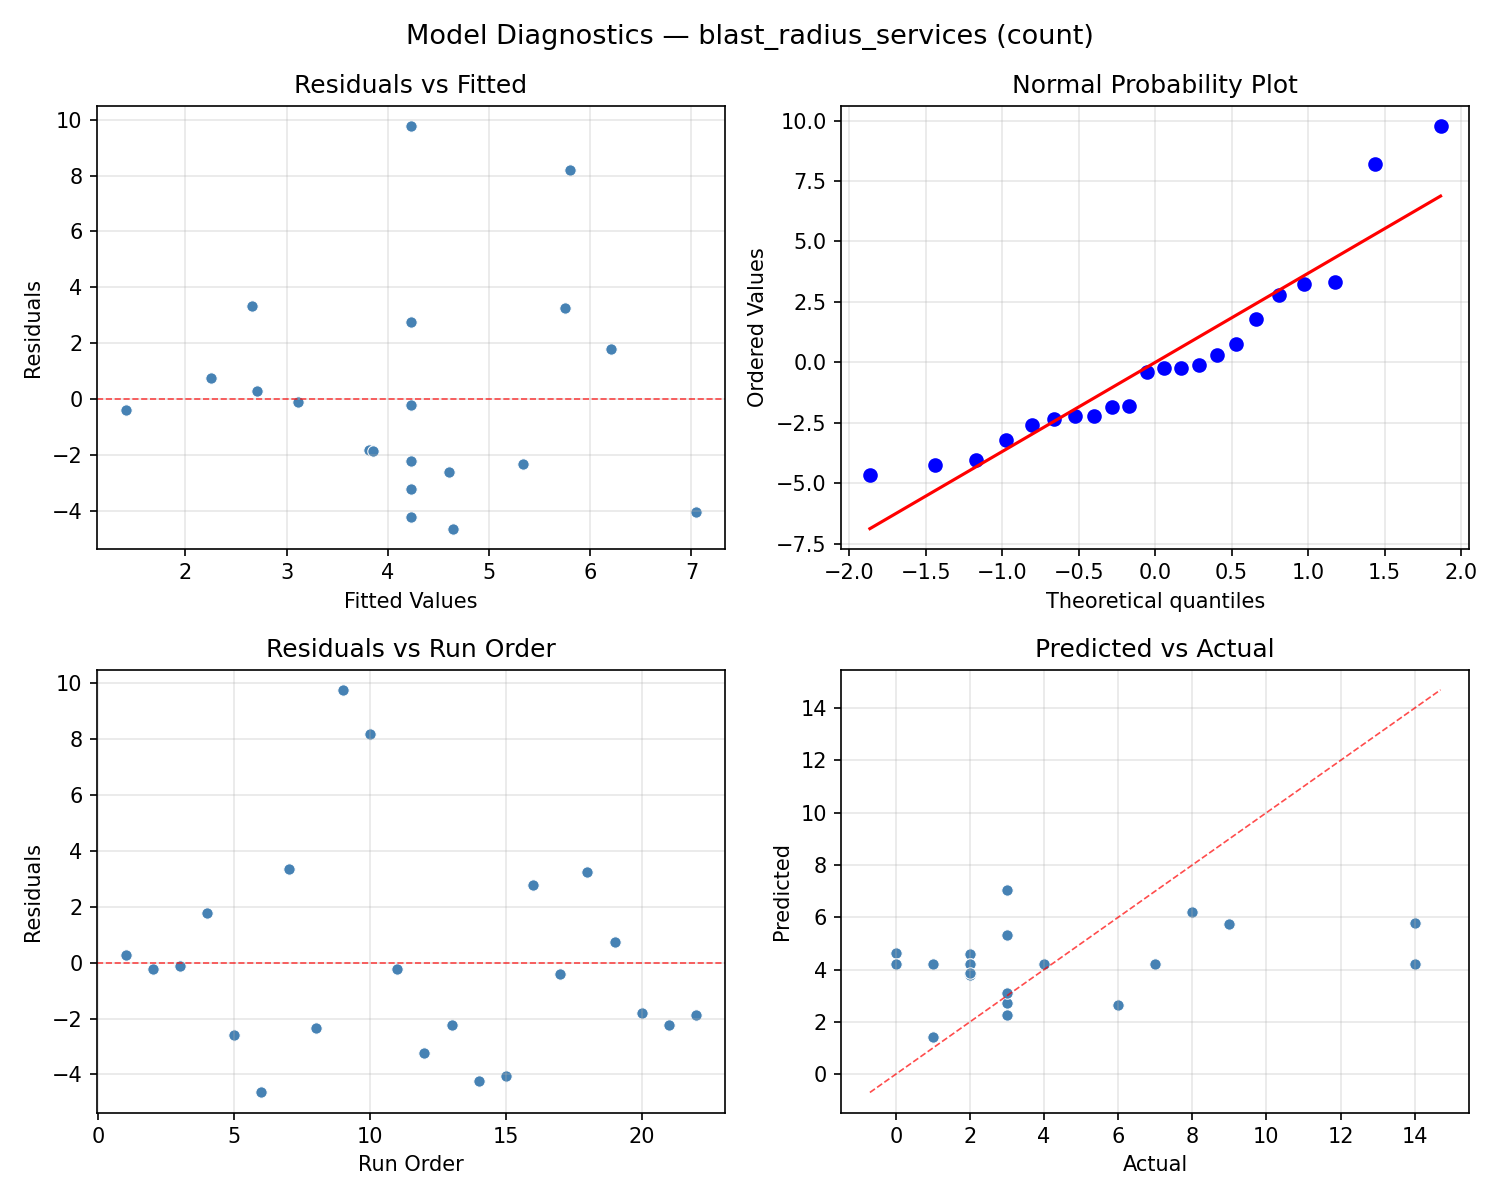
Model Diagnostics
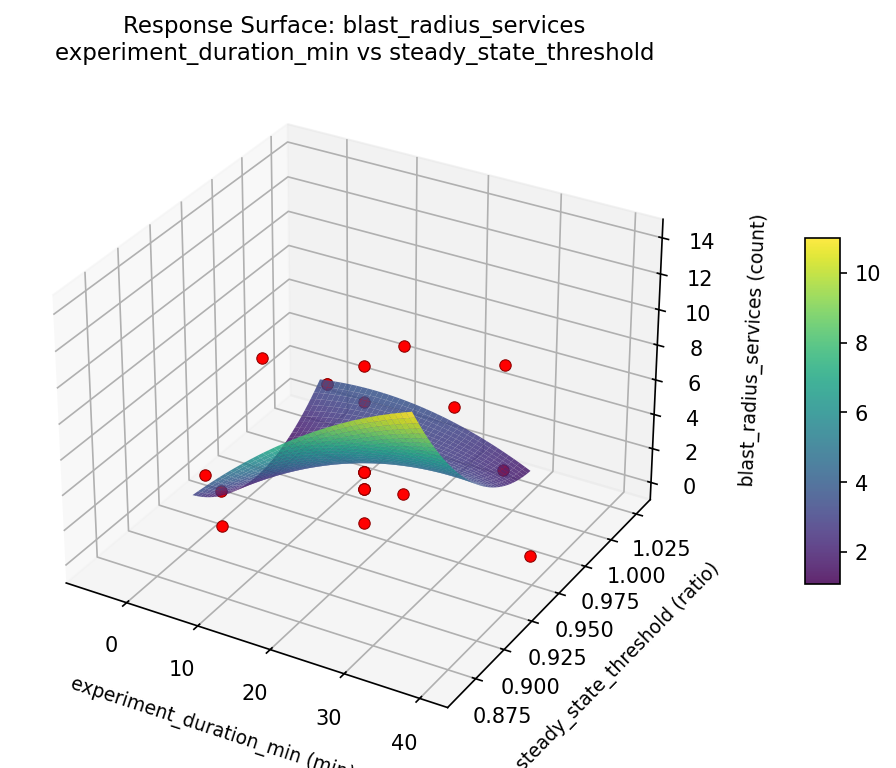
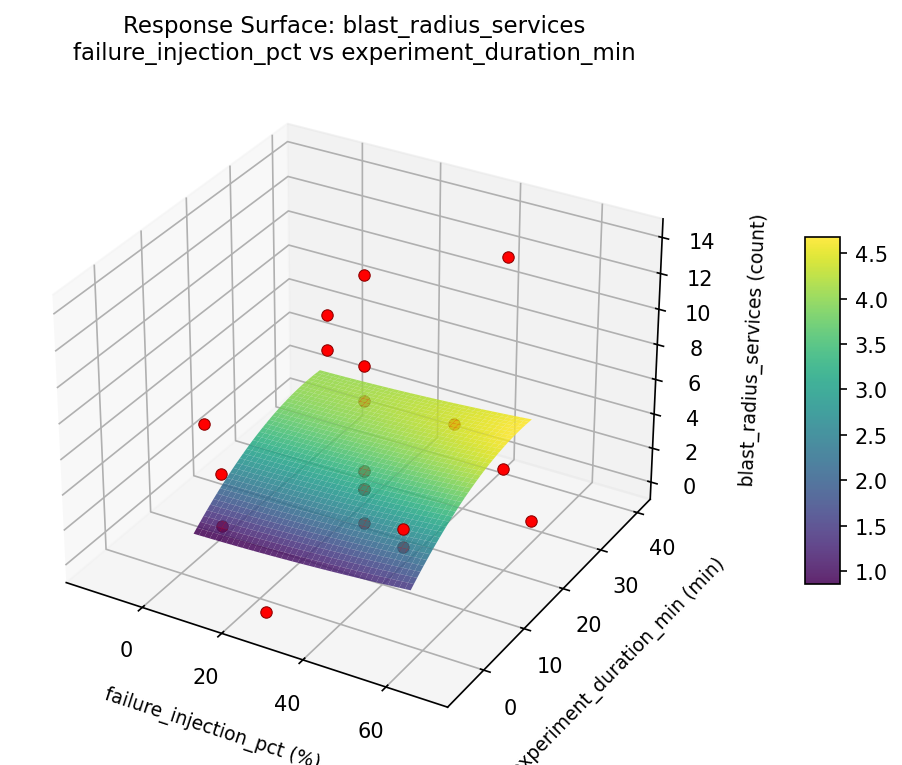
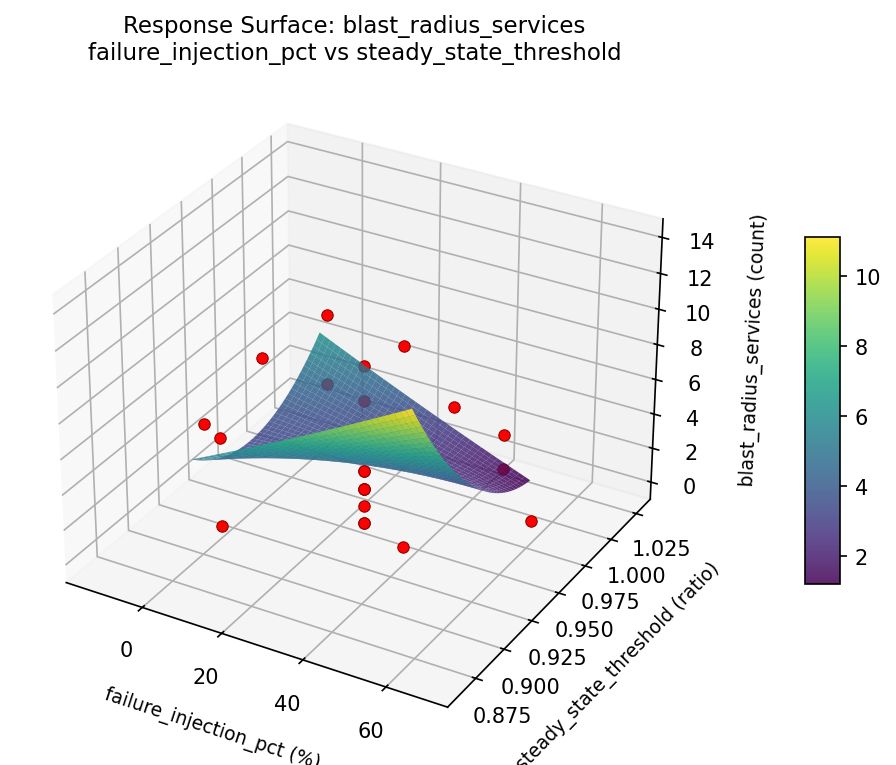
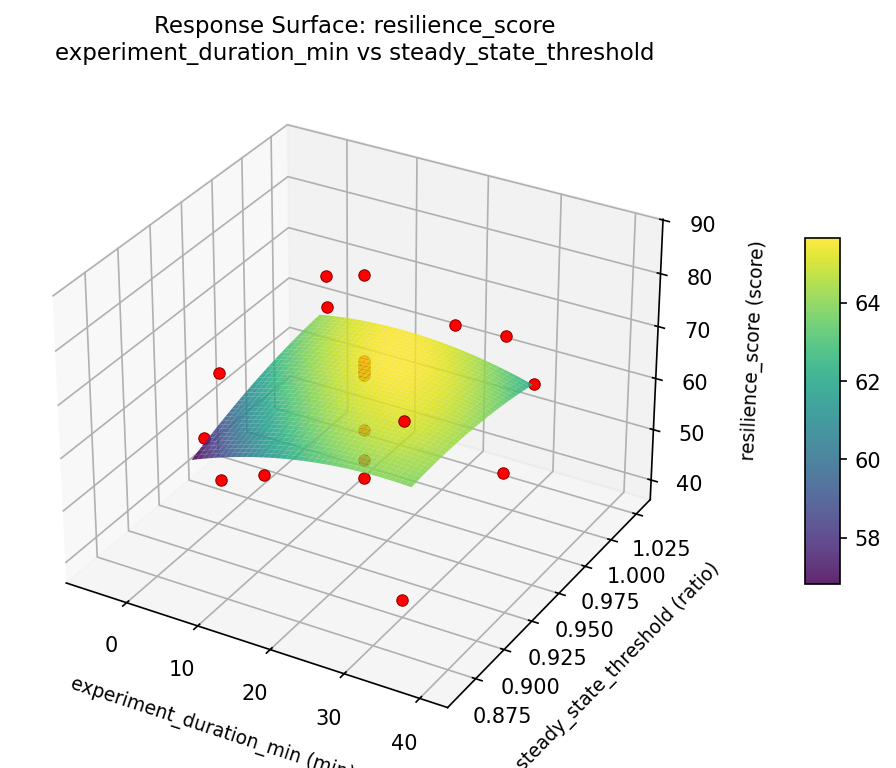
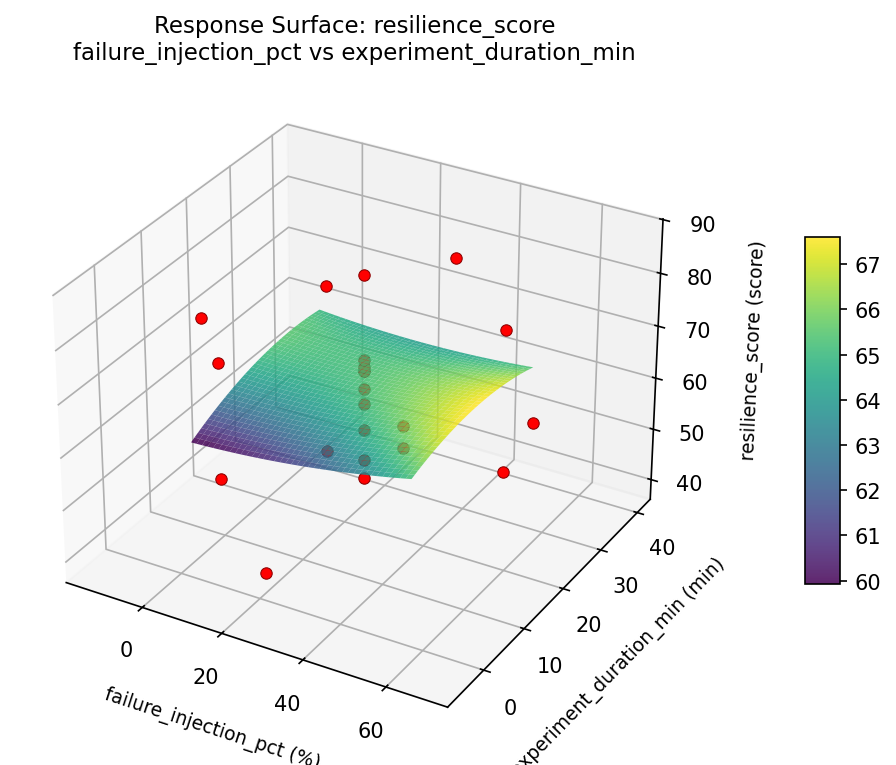
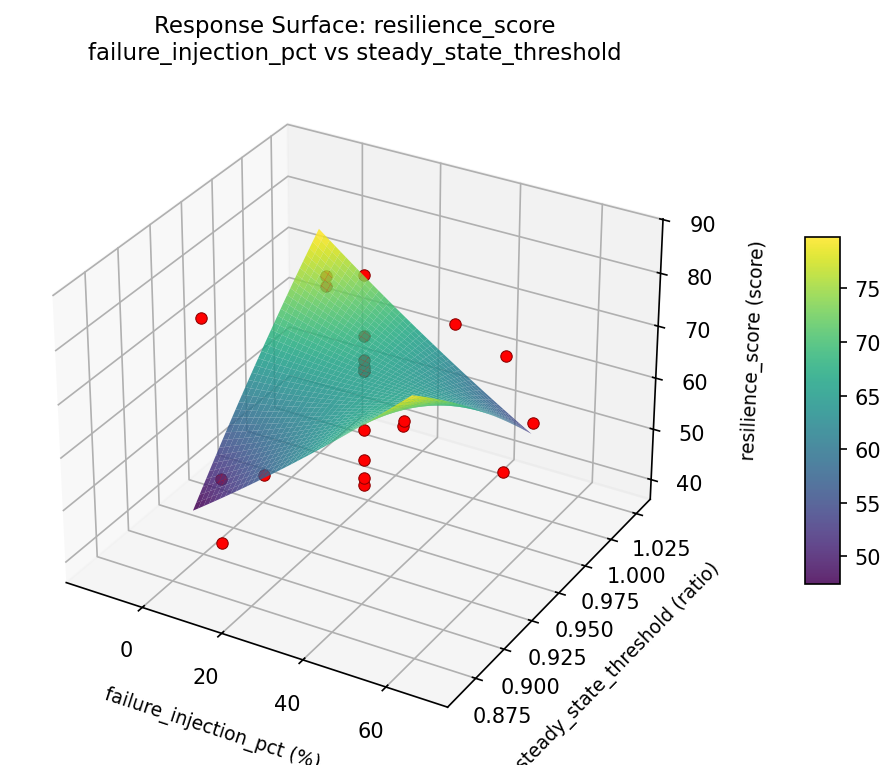
Response Surface Plots
3D surfaces fitted with quadratic RSM. Red dots are observed data points.
blast radius services experiment duration min vs steady state threshold
blast radius services failure injection pct vs experiment duration min
blast radius services failure injection pct vs steady state threshold
resilience score experiment duration min vs steady state threshold
resilience score failure injection pct vs experiment duration min
resilience score failure injection pct vs steady state threshold
Multi-Objective Optimization
When responses compete, Derringer–Suich desirability finds the best compromise.
Each response is scaled to a 0–1 desirability, then combined via a weighted geometric mean.
Overall Desirability
D = 0.7958
Per-Response Desirability
| Response | Weight | Desirability | Predicted | Dir |
|---|
resilience_score |
1.5 |
|
75.50 0.7388 75.50 score |
↑ |
blast_radius_services |
1.0 |
|
1.00 0.8896 1.00 count |
↓ |
Recommended Settings
| Factor | Value |
|---|
failure_injection_pct | 27.5 % |
experiment_duration_min | 40.3218 min |
steady_state_threshold | 0.945 ratio |
Source: from observed run #17
Trade-off Summary
Sacrifice = how much worse than single-objective best.
| Response | Predicted | Best Observed | Sacrifice |
|---|
blast_radius_services | 1.00 | 0.00 | +1.00 |
Top 3 Runs by Desirability
| Run | D | Factor Settings |
|---|
| #15 | 0.7079 | failure_injection_pct=5, experiment_duration_min=5, steady_state_threshold=0.99 |
| #2 | 0.7038 | failure_injection_pct=5, experiment_duration_min=30, steady_state_threshold=0.99 |
Model Quality
| Response | R² | Type |
|---|
blast_radius_services | 0.0063 | linear |
Full Multi-Objective Output
============================================================
MULTI-OBJECTIVE OPTIMIZATION
Method: Derringer-Suich Desirability Function
============================================================
Overall desirability: D = 0.7958
Response Weight Desirability Predicted Direction
---------------------------------------------------------------------
resilience_score 1.5 0.7388 75.50 score ↑
blast_radius_services 1.0 0.8896 1.00 count ↓
Recommended settings:
failure_injection_pct = 27.5 %
experiment_duration_min = 40.3218 min
steady_state_threshold = 0.945 ratio
(from observed run #17)
Trade-off summary:
resilience_score: 75.50 (best observed: 86.70, sacrifice: +11.20)
blast_radius_services: 1.00 (best observed: 0.00, sacrifice: +1.00)
Model quality:
resilience_score: R² = 0.3924 (quadratic)
blast_radius_services: R² = 0.0063 (linear)
Top 3 observed runs by overall desirability:
1. Run #17 (D=0.7958): failure_injection_pct=27.5, experiment_duration_min=40.3218, steady_state_threshold=0.945
2. Run #15 (D=0.7079): failure_injection_pct=5, experiment_duration_min=5, steady_state_threshold=0.99
3. Run #2 (D=0.7038): failure_injection_pct=5, experiment_duration_min=30, steady_state_threshold=0.99
Full Analysis Output
=== Main Effects: resilience_score ===
Factor Effect Std Error % Contribution
--------------------------------------------------------------
steady_state_threshold 26.2000 2.5368 43.3%
experiment_duration_min 22.1000 2.5368 36.5%
failure_injection_pct 12.1750 2.5368 20.1%
=== ANOVA Table: resilience_score ===
Source DF SS MS F p-value
-----------------------------------------------------------------------------
failure_injection_pct 4 191.0283 47.7571 0.218 0.9219
experiment_duration_min 4 405.2758 101.3190 0.462 0.7623
steady_state_threshold 4 429.2083 107.3021 0.489 0.7440
Lack of Fit 2 412.8787 206.4394 0.942 0.4344
Pure Error 7 1534.6888 219.2413
Error 9 1947.5675 219.2413
Total 21 2973.0800 141.5752
=== Summary Statistics: resilience_score ===
failure_injection_pct:
Level N Mean Std Min Max
------------------------------------------------------------
-13.5792 1 70.2000 0.0000 70.2000 70.2000
27.5 12 63.4167 13.9917 39.5000 86.7000
5 4 66.1250 9.5297 51.9000 72.0000
50 4 60.0250 10.8960 45.6000 68.8000
68.5792 1 72.2000 0.0000 72.2000 72.2000
experiment_duration_min:
Level N Mean Std Min Max
------------------------------------------------------------
-5.32177 1 74.0000 0.0000 74.0000 74.0000
17.5 12 64.7917 13.5152 39.5000 86.7000
30 4 67.3250 6.6178 57.6000 72.0000
40.3218 1 51.9000 0.0000 51.9000 51.9000
5 4 58.8250 11.9324 45.6000 69.7000
steady_state_threshold:
Level N Mean Std Min Max
------------------------------------------------------------
0.862842 1 73.1000 0.0000 73.1000 73.1000
0.9 4 64.9250 8.7645 51.9000 70.9000
0.945 12 65.2833 13.0322 39.5000 86.7000
0.99 4 61.2250 12.1821 45.6000 72.0000
1.02716 1 46.9000 0.0000 46.9000 46.9000
=== Main Effects: blast_radius_services ===
Factor Effect Std Error % Contribution
--------------------------------------------------------------
steady_state_threshold 14.0000 0.8424 66.7%
experiment_duration_min 4.0000 0.8424 19.0%
failure_injection_pct 3.0000 0.8424 14.3%
=== ANOVA Table: blast_radius_services ===
Source DF SS MS F p-value
-----------------------------------------------------------------------------
failure_injection_pct 4 30.9470 7.7367 0.387 0.8130
experiment_duration_min 4 22.3636 5.5909 0.280 0.8840
steady_state_threshold 4 119.6136 29.9034 1.495 0.2824
Lack of Fit 2 14.9394 7.4697 0.373 0.7013
Pure Error 7 140.0000 20.0000
Error 9 154.9394 20.0000
Total 21 327.8636 15.6126
=== Summary Statistics: blast_radius_services ===
failure_injection_pct:
Level N Mean Std Min Max
------------------------------------------------------------
-13.5792 1 3.0000 0.0000 3.0000 3.0000
27.5 12 4.9167 4.8889 0.0000 14.0000
5 4 5.0000 2.9439 2.0000 8.0000
50 4 2.0000 1.6330 0.0000 4.0000
68.5792 1 3.0000 0.0000 3.0000 3.0000
experiment_duration_min:
Level N Mean Std Min Max
------------------------------------------------------------
-5.32177 1 4.0000 0.0000 4.0000 4.0000
17.5 12 5.0000 4.8053 0.0000 14.0000
30 4 3.2500 3.4034 0.0000 8.0000
40.3218 1 1.0000 0.0000 1.0000 1.0000
5 4 3.7500 2.3629 2.0000 7.0000
steady_state_threshold:
Level N Mean Std Min Max
------------------------------------------------------------
0.862842 1 14.0000 0.0000 14.0000 14.0000
0.9 4 4.0000 2.1602 2.0000 7.0000
0.945 12 4.2500 3.7929 1.0000 14.0000
0.99 4 3.0000 3.4641 0.0000 8.0000
1.02716 1 0.0000 0.0000 0.0000 0.0000
Optimization Recommendations
=== Optimization: resilience_score ===
Direction: maximize
Best observed run: #18
failure_injection_pct = 50
experiment_duration_min = 30
steady_state_threshold = 0.9
Value: 86.7
RSM Model (linear, R² = 0.0395, Adj R² = -0.1206):
Coefficients:
intercept +64.0000
failure_injection_pct +2.3644
experiment_duration_min -0.8270
steady_state_threshold -1.3185
RSM Model (quadratic, R² = 0.5394, Adj R² = 0.1940):
Coefficients:
intercept +57.6605
failure_injection_pct +2.3644
experiment_duration_min -0.8270
steady_state_threshold -1.3187
failure_injection_pct*experiment_duration_min +4.4750
failure_injection_pct*steady_state_threshold -0.6250
experiment_duration_min*steady_state_threshold -3.8250
failure_injection_pct^2 +4.4447
experiment_duration_min^2 -1.2703
steady_state_threshold^2 +6.3347
Curvature analysis:
steady_state_threshold coef=+6.3347 convex (has a minimum)
failure_injection_pct coef=+4.4447 convex (has a minimum)
experiment_duration_min coef=-1.2703 concave (has a maximum)
Notable interactions:
failure_injection_pct*experiment_duration_min coef=+4.4750 (synergistic)
experiment_duration_min*steady_state_threshold coef=-3.8250 (antagonistic)
failure_injection_pct*steady_state_threshold coef=-0.6250 (antagonistic)
Predicted optimum (from quadratic model, at observed points):
failure_injection_pct = 27.5
experiment_duration_min = 17.5
steady_state_threshold = 0.862842
Predicted value: 81.1834
Surface optimum (via L-BFGS-B, quadratic model):
failure_injection_pct = 50
experiment_duration_min = 30
steady_state_threshold = 0.9
Predicted value: 78.9508
Model quality: Moderate fit — use predictions directionally, not precisely.
Factor importance:
1. experiment_duration_min (effect: 24.0, contribution: 41.8%)
2. steady_state_threshold (effect: 17.6, contribution: 30.7%)
3. failure_injection_pct (effect: 15.8, contribution: 27.5%)
=== Optimization: blast_radius_services ===
Direction: minimize
Best observed run: #6
failure_injection_pct = 27.5
experiment_duration_min = 40.3218
steady_state_threshold = 0.945
Value: 0.0
RSM Model (linear, R² = 0.0284, Adj R² = -0.1335):
Coefficients:
intercept +4.2273
failure_injection_pct +0.3647
experiment_duration_min -0.6668
steady_state_threshold -0.2402
RSM Model (quadratic, R² = 0.6265, Adj R² = 0.3463):
Coefficients:
intercept +3.3983
failure_injection_pct +0.3647
experiment_duration_min -0.6668
steady_state_threshold -0.2402
failure_injection_pct*experiment_duration_min -1.6250
failure_injection_pct*steady_state_threshold +2.3750
experiment_duration_min*steady_state_threshold -3.8750
failure_injection_pct^2 +0.4145
experiment_duration_min^2 +0.5645
steady_state_threshold^2 +0.2645
Curvature analysis:
experiment_duration_min coef=+0.5645 convex (has a minimum)
failure_injection_pct coef=+0.4145 convex (has a minimum)
steady_state_threshold coef=+0.2645 convex (has a minimum)
Notable interactions:
experiment_duration_min*steady_state_threshold coef=-3.8750 (antagonistic)
failure_injection_pct*steady_state_threshold coef=+2.3750 (synergistic)
failure_injection_pct*experiment_duration_min coef=-1.6250 (antagonistic)
Predicted optimum (from quadratic model, at observed points):
failure_injection_pct = 50
experiment_duration_min = 5
steady_state_threshold = 0.99
Predicted value: 13.3081
Surface optimum (via L-BFGS-B, quadratic model):
failure_injection_pct = 5
experiment_duration_min = 30
steady_state_threshold = 0.99
Predicted value: -1.2550
Model quality: Moderate fit — use predictions directionally, not precisely.
Factor importance:
1. experiment_duration_min (effect: 7.0, contribution: 37.8%)
2. steady_state_threshold (effect: 6.2, contribution: 33.8%)
3. failure_injection_pct (effect: 5.2, contribution: 28.4%)