Summary
This experiment investigates coffee brewing extraction. Central composite design to maximize flavor score and minimize bitterness by tuning grind size, water temperature, brew time, and coffee-to-water ratio.
The design varies 4 factors: grind size (um), ranging from 200 to 800, water temp (C), ranging from 85 to 96, brew time (sec), ranging from 180 to 300, and ratio (g/g), ranging from 14 to 18. The goal is to optimize 2 responses: flavor score (pts) (maximize) and bitterness (pts) (minimize). Fixed conditions held constant across all runs include roast level = medium, water tds = 120.
A Central Composite Design (CCD) was selected to fit a full quadratic response surface model, including curvature and interaction effects. With 4 factors this produces 32 runs including center points and axial (star) points that extend beyond the factorial range.
Quadratic response surface models were fitted to capture potential curvature and factor interactions. The RSM contour plots below visualize how pairs of factors jointly affect each response.
Key Findings
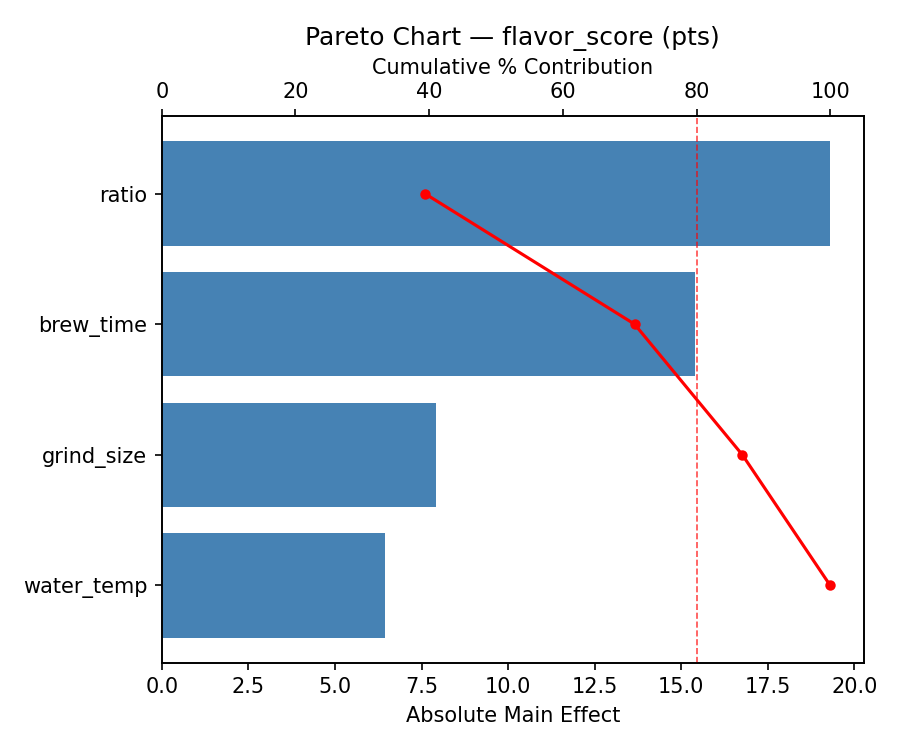
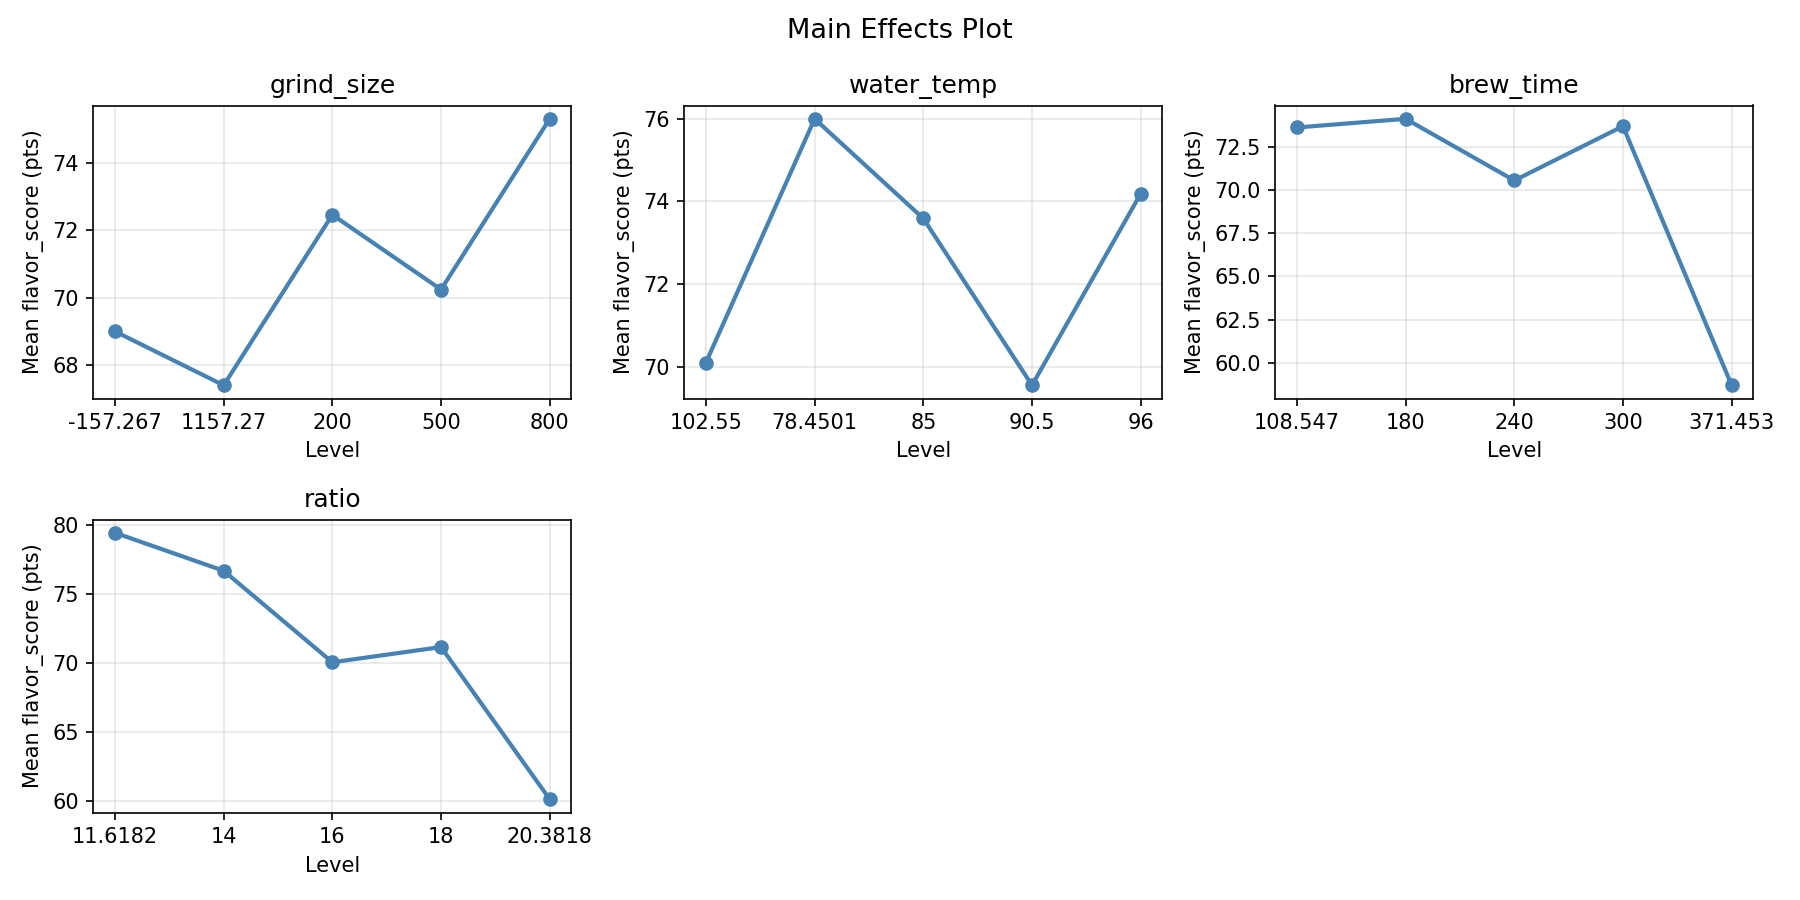
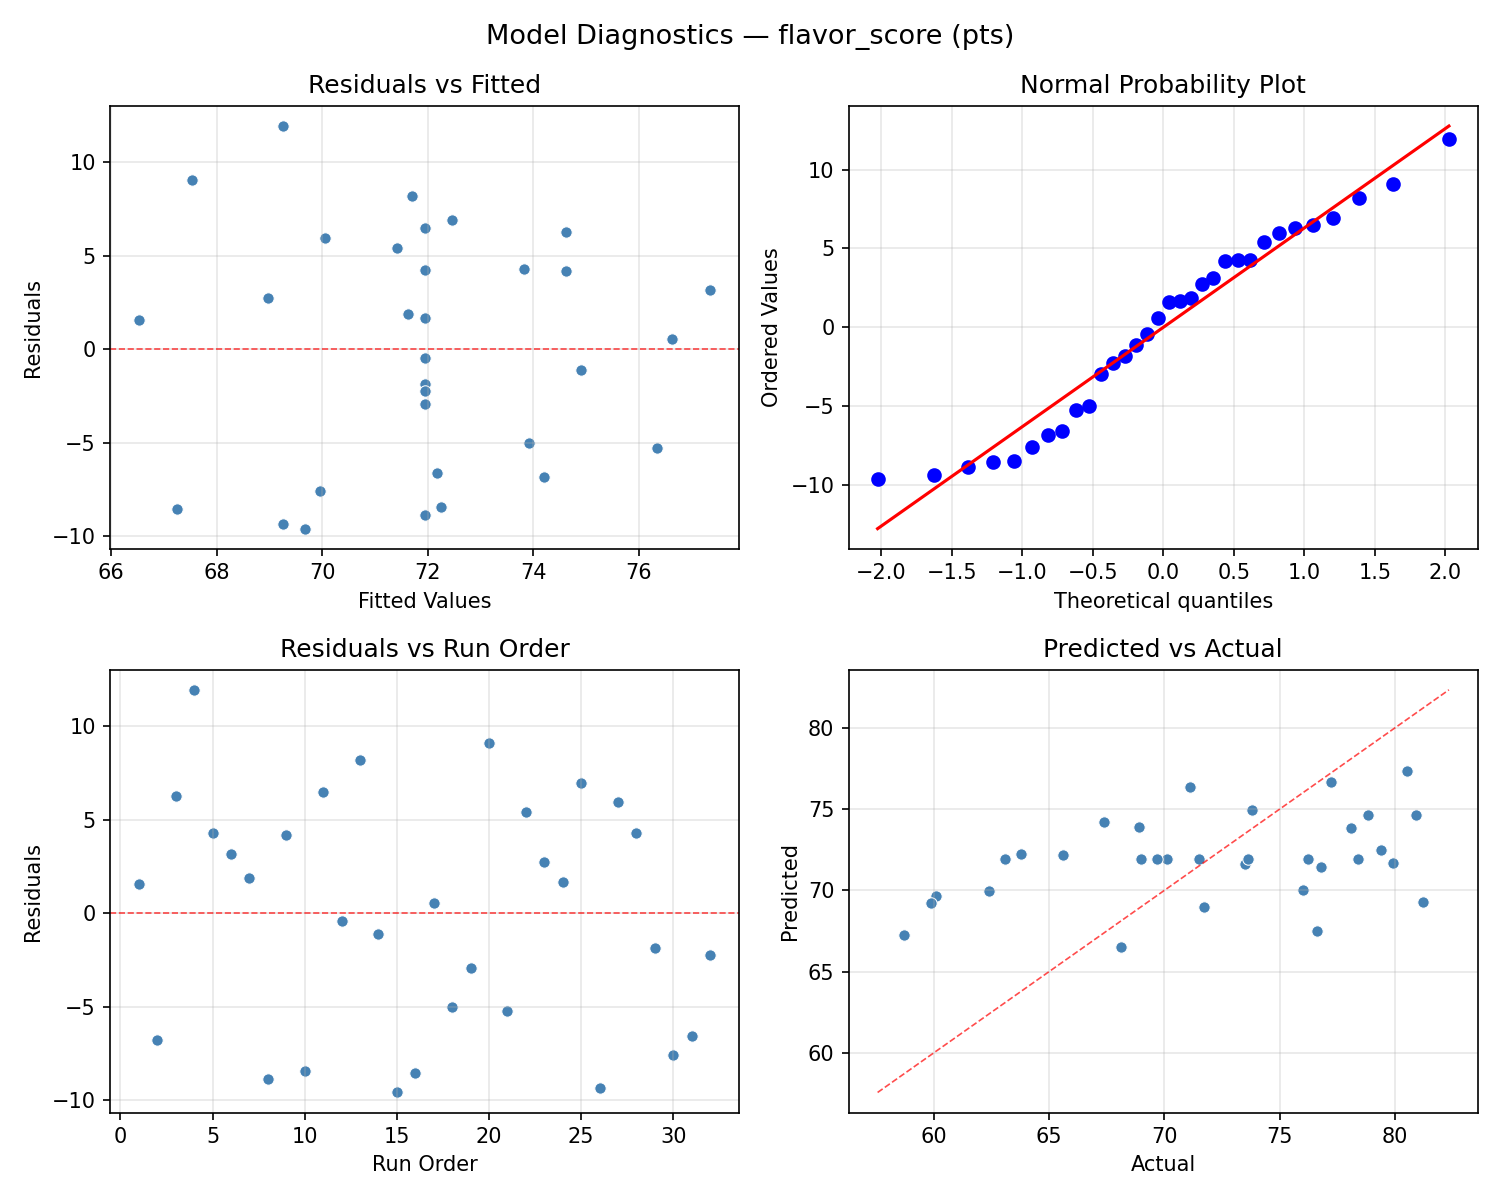
For flavor score, the most influential factors were water temp (39.7%), grind size (29.9%), brew time (21.6%). The best observed value was 81.2 (at grind size = 500, water temp = 90.5, brew time = 240).
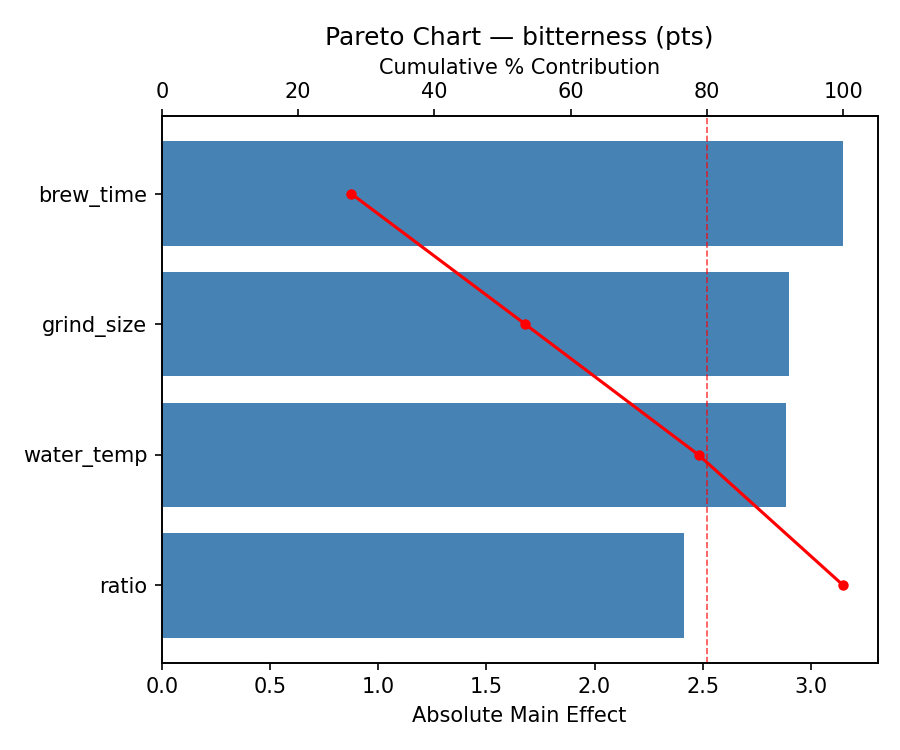
For bitterness, the most influential factors were brew time (34.5%), grind size (27.7%), water temp (21.4%). The best observed value was 1.7 (at grind size = 500, water temp = 90.5, brew time = 240).
Recommended Next Steps
- Run confirmation experiments at the predicted optimal settings to validate the model.
- Consider whether any fixed factors should be varied in a future study.
Experimental Setup
Factors
| Factor | Low | High | Unit |
|---|
grind_size | 200 | 800 | um |
water_temp | 85 | 96 | C |
brew_time | 180 | 300 | sec |
ratio | 14 | 18 | g/g |
Fixed: roast_level = medium, water_tds = 120
Responses
| Response | Direction | Unit |
|---|
flavor_score | ↑ maximize | pts |
bitterness | ↓ minimize | pts |
Configuration
{
"metadata": {
"name": "Coffee Brewing Extraction",
"description": "Central composite design to maximize flavor score and minimize bitterness by tuning grind size, water temperature, brew time, and coffee-to-water ratio"
},
"factors": [
{
"name": "grind_size",
"levels": [
"200",
"800"
],
"type": "continuous",
"unit": "um"
},
{
"name": "water_temp",
"levels": [
"85",
"96"
],
"type": "continuous",
"unit": "C"
},
{
"name": "brew_time",
"levels": [
"180",
"300"
],
"type": "continuous",
"unit": "sec"
},
{
"name": "ratio",
"levels": [
"14",
"18"
],
"type": "continuous",
"unit": "g/g"
}
],
"fixed_factors": {
"roast_level": "medium",
"water_tds": "120"
},
"responses": [
{
"name": "flavor_score",
"optimize": "maximize",
"unit": "pts"
},
{
"name": "bitterness",
"optimize": "minimize",
"unit": "pts"
}
],
"settings": {
"operation": "central_composite",
"test_script": "use_cases/88_coffee_brewing/sim.sh"
}
}
Experimental Matrix
The Central Composite Design produces 32 runs. Each row is one experiment with specific factor settings.
| Run | grind_size | water_temp | brew_time | ratio |
|---|
| 1 | 500 | 90.5 | 240 | 11.6182 |
| 2 | 200 | 96 | 180 | 18 |
| 3 | 800 | 85 | 300 | 14 |
| 4 | 800 | 96 | 300 | 18 |
| 5 | 500 | 90.5 | 371.453 | 16 |
| 6 | 800 | 85 | 300 | 18 |
| 7 | 500 | 78.4501 | 240 | 16 |
| 8 | 200 | 96 | 300 | 14 |
| 9 | 500 | 90.5 | 240 | 16 |
| 10 | 800 | 96 | 180 | 14 |
| 11 | 500 | 90.5 | 240 | 16 |
| 12 | 800 | 85 | 180 | 18 |
| 13 | 500 | 90.5 | 240 | 16 |
| 14 | 800 | 96 | 300 | 14 |
| 15 | 500 | 90.5 | 108.547 | 16 |
| 16 | -157.267 | 90.5 | 240 | 16 |
| 17 | 500 | 90.5 | 240 | 16 |
| 18 | 200 | 85 | 180 | 18 |
| 19 | 800 | 96 | 180 | 18 |
| 20 | 500 | 90.5 | 240 | 16 |
| 21 | 200 | 85 | 300 | 14 |
| 22 | 500 | 90.5 | 240 | 16 |
| 23 | 1157.27 | 90.5 | 240 | 16 |
| 24 | 200 | 85 | 300 | 18 |
| 25 | 500 | 90.5 | 240 | 16 |
| 26 | 200 | 96 | 180 | 14 |
| 27 | 500 | 90.5 | 240 | 20.3818 |
| 28 | 500 | 90.5 | 240 | 16 |
| 29 | 800 | 85 | 180 | 14 |
| 30 | 500 | 102.55 | 240 | 16 |
| 31 | 200 | 85 | 180 | 14 |
| 32 | 200 | 96 | 300 | 18 |
Step-by-Step Workflow
1
Preview the design
$ doe info --config use_cases/88_coffee_brewing/config.json
2
Generate the runner script
$ doe generate --config use_cases/88_coffee_brewing/config.json \
--output use_cases/88_coffee_brewing/results/run.sh --seed 42
3
Execute the experiments
$ bash use_cases/88_coffee_brewing/results/run.sh
4
Analyze results
$ doe analyze --config use_cases/88_coffee_brewing/config.json
5
Get optimization recommendations
$ doe optimize --config use_cases/88_coffee_brewing/config.json
6
Multi-objective optimization
With 2 competing responses, use --multi to find the best compromise via Derringer–Suich desirability.
$ doe optimize --config use_cases/88_coffee_brewing/config.json --multi
7
Generate the HTML report
$ doe report --config use_cases/88_coffee_brewing/config.json \
--output use_cases/88_coffee_brewing/results/report.html
Features Exercised
| Feature | Value |
|---|
| Design type | central_composite |
| Factor types | continuous (all 4) |
| Arg style | double-dash |
| Responses | 2 (flavor_score ↑, bitterness ↓) |
| Total runs | 32 |
Analysis Results
Generated from actual experiment runs using the DOE Helper Tool.
Response: flavor_score
Top factors: water_temp (39.7%), grind_size (29.9%), brew_time (21.6%).
ANOVA
| Source | DF | SS | MS | F | p-value |
|---|
| Source | DF | SS | MS | F | p-value |
| grind_size | 4 | 134.6227 | 33.6557 | 0.613 | 0.6598 |
| water_temp | 4 | 135.7613 | 33.9403 | 0.618 | 0.6564 |
| brew_time | 4 | 154.3391 | 38.5848 | 0.703 | 0.6021 |
| ratio | 4 | 41.0263 | 10.2566 | 0.187 | 0.9416 |
| Lack | of | Fit | 8 | 549.9257 | 68.7407 |
| Pure | Error | 7 | 384.3200 | | |
| Error | 15 | 934.2457 | 54.9029 | | |
| Total | 31 | 1399.9950 | 45.1611 | | |
Pareto Chart
Main Effects Plot
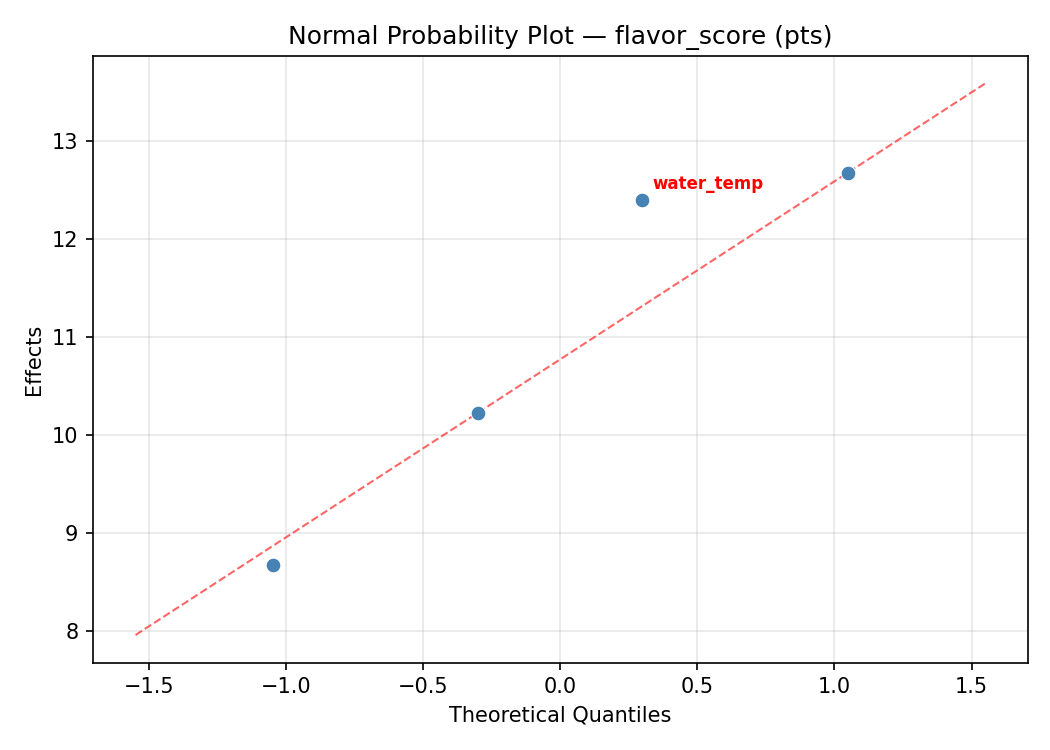
Normal Probability Plot of Effects
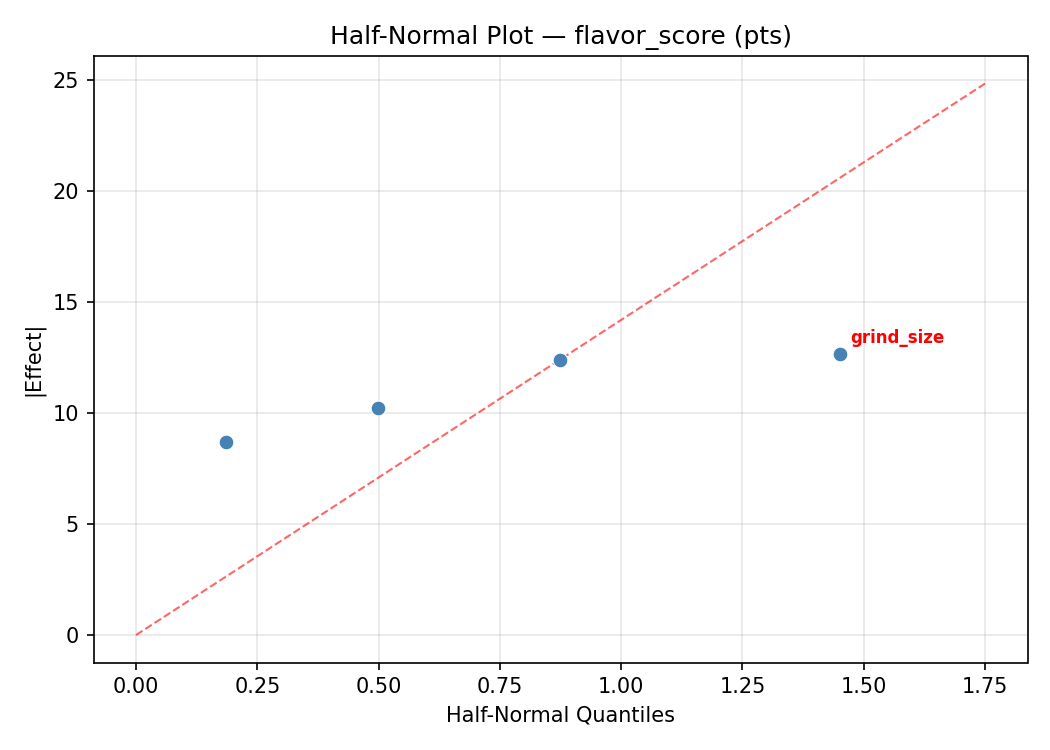
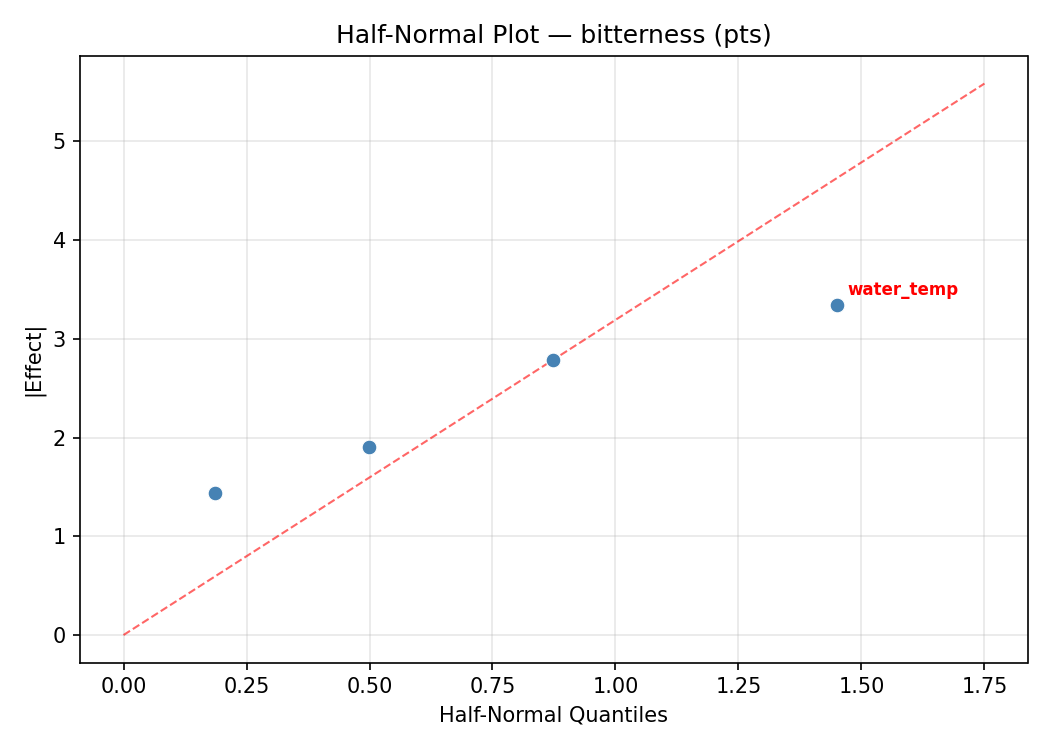
Half-Normal Plot of Effects
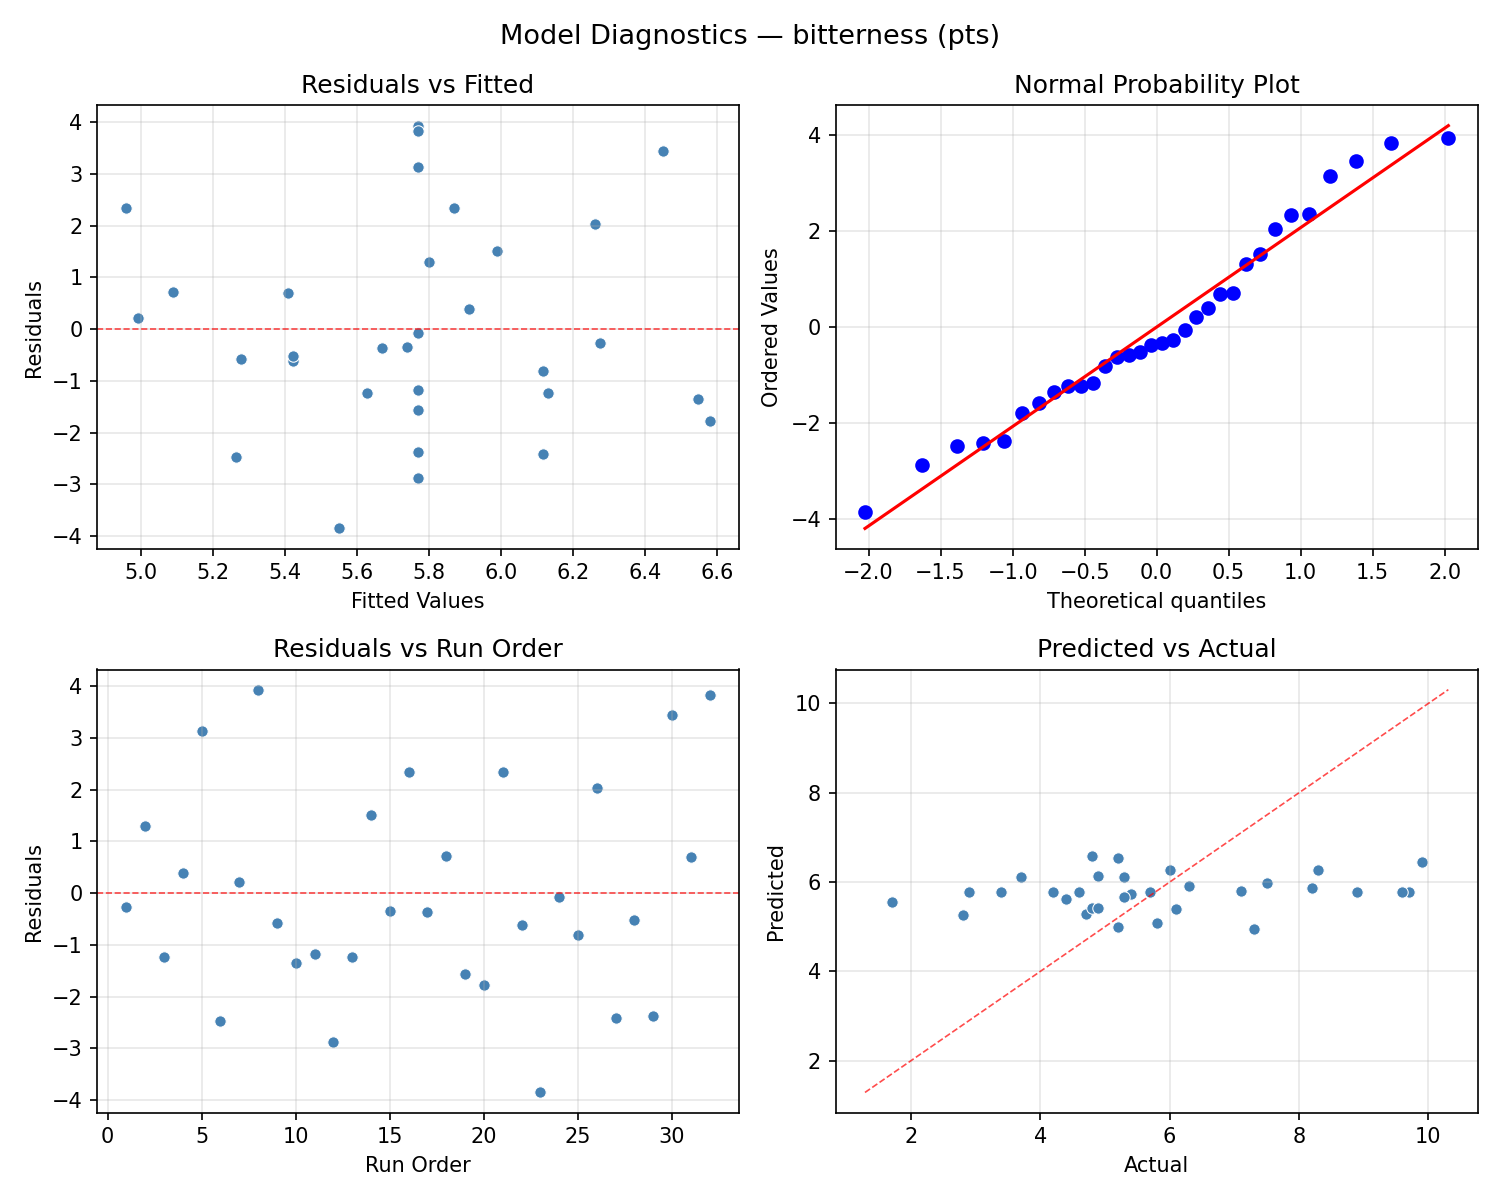
Model Diagnostics
Response: bitterness
Top factors: brew_time (34.5%), grind_size (27.7%), water_temp (21.4%).
ANOVA
| Source | DF | SS | MS | F | p-value |
|---|
| Source | DF | SS | MS | F | p-value |
| grind_size | 4 | 24.1712 | 6.0428 | 1.087 | 0.3979 |
| water_temp | 4 | 28.1452 | 7.0363 | 1.266 | 0.3264 |
| brew_time | 4 | 29.8341 | 7.4585 | 1.342 | 0.3001 |
| ratio | 4 | 17.9716 | 4.4929 | 0.809 | 0.5388 |
| Lack | of | Fit | 8 | 0.0000 | 0.0000 |
| Pure | Error | 7 | 38.8987 | | |
| Error | 15 | 31.7066 | 5.5570 | | |
| Total | 31 | 131.8287 | 4.2525 | | |
Pareto Chart
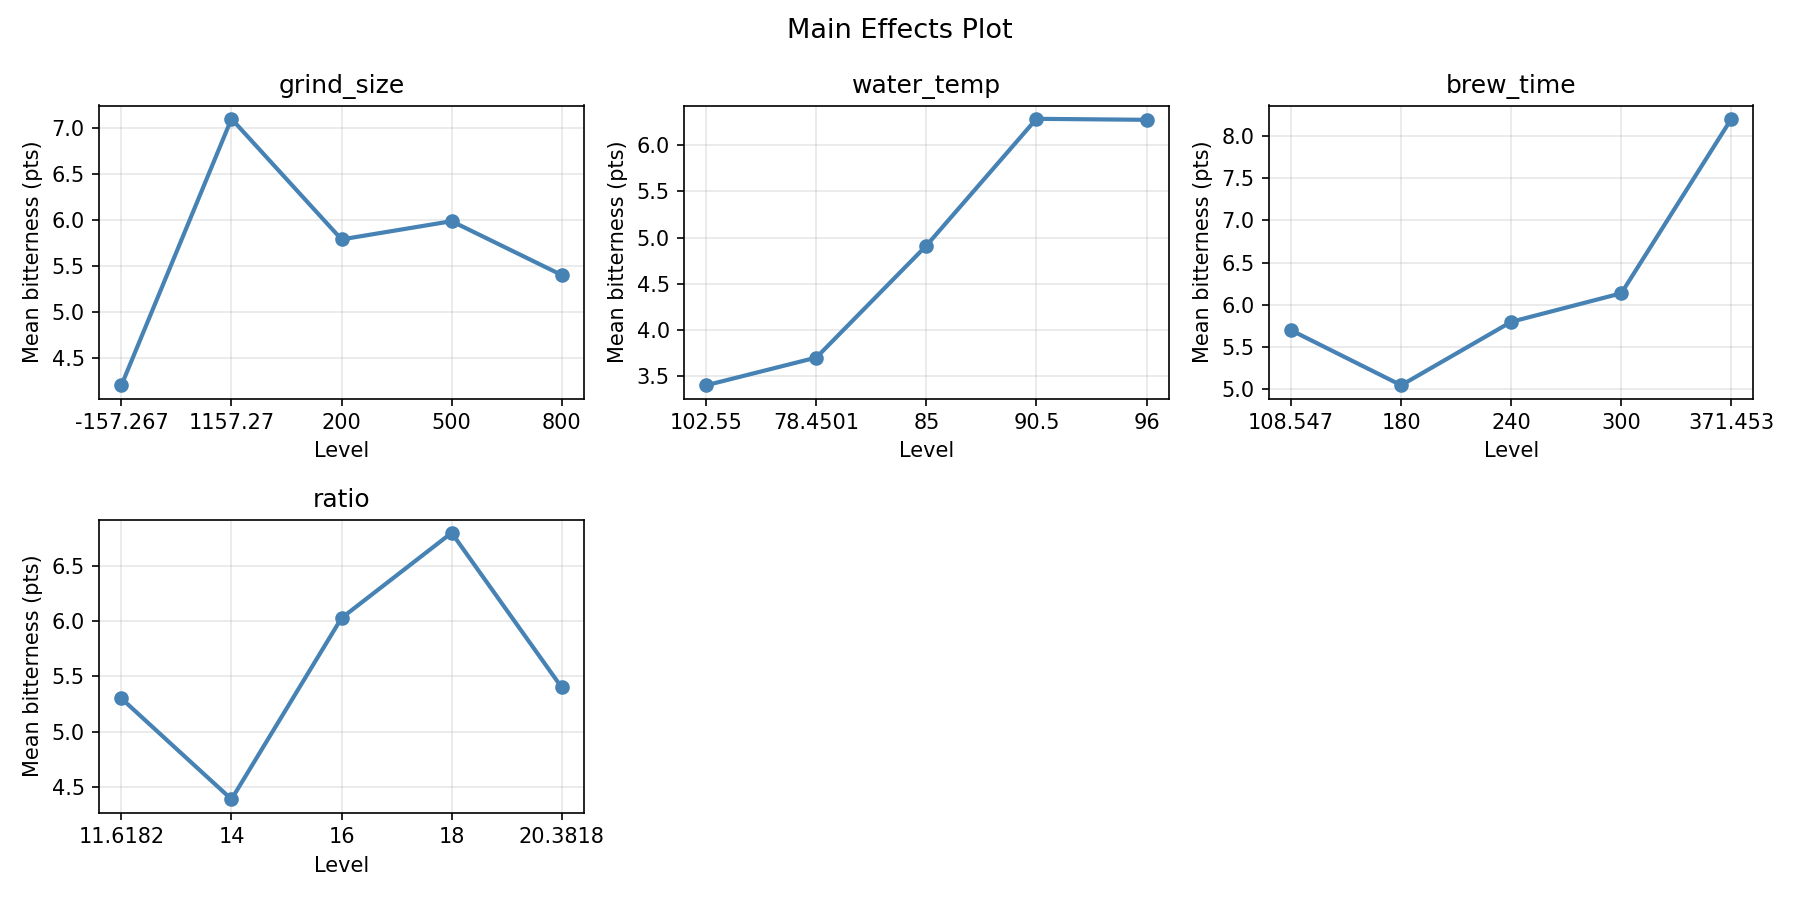
Main Effects Plot
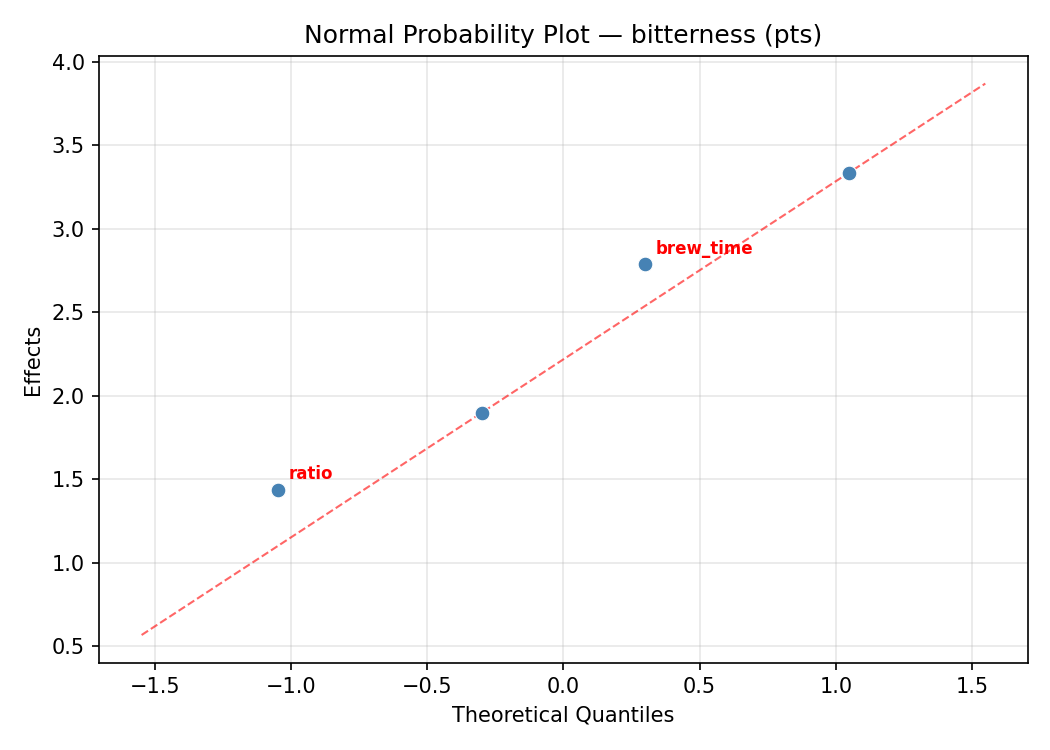
Normal Probability Plot of Effects
Half-Normal Plot of Effects
Model Diagnostics
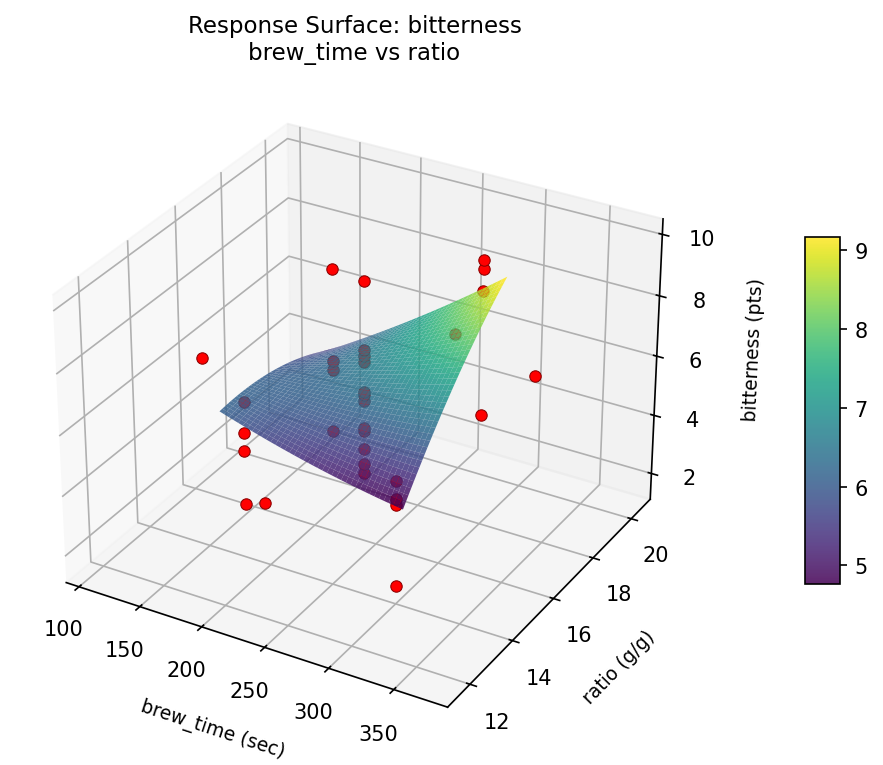
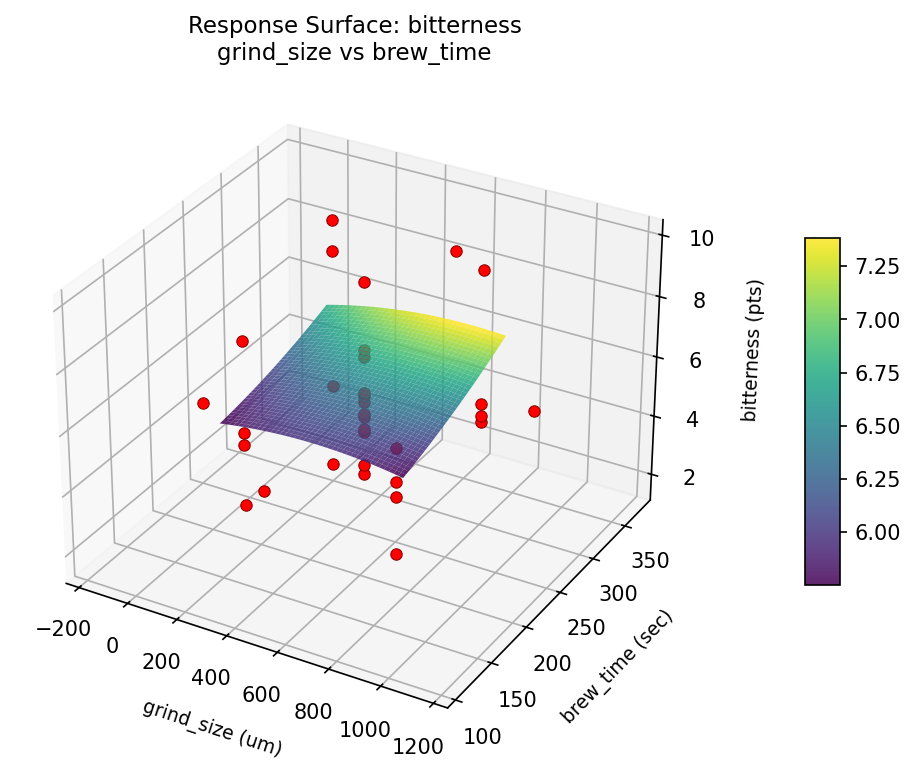
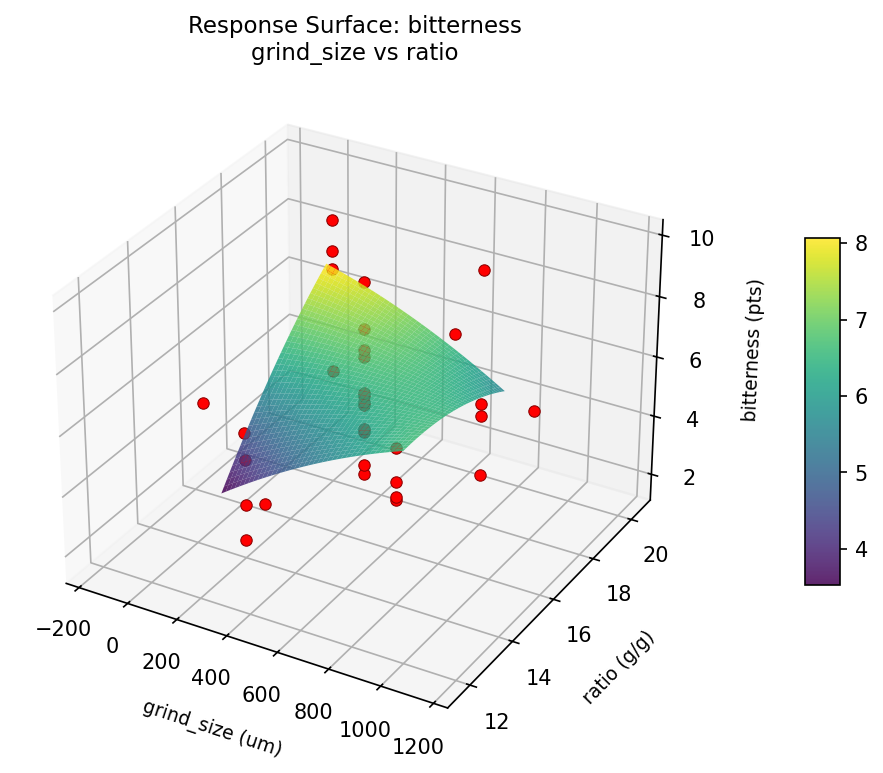
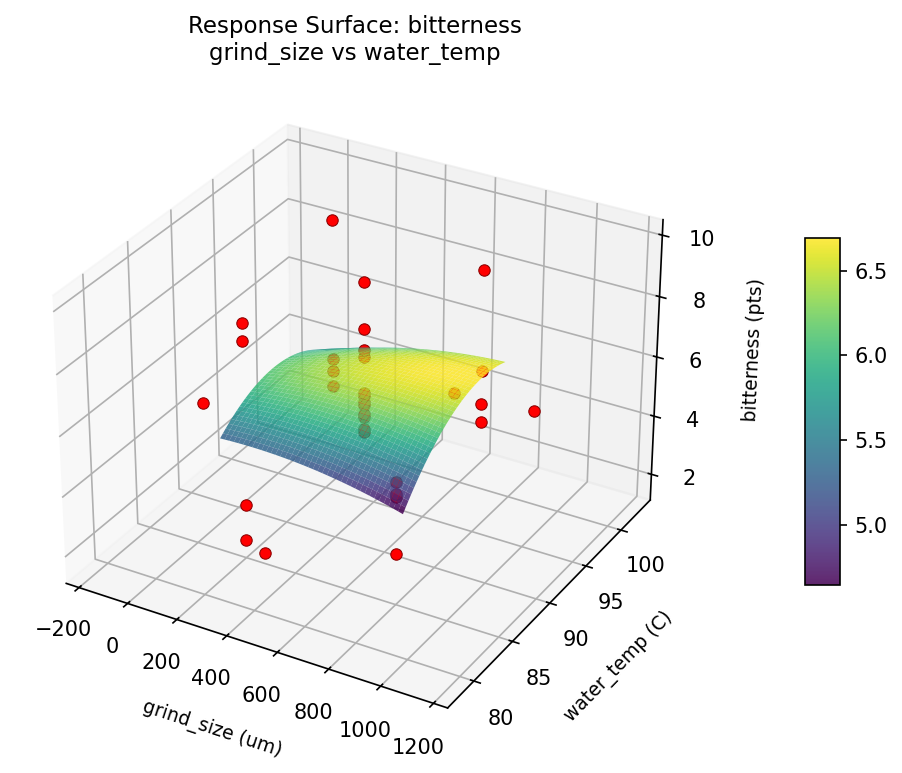
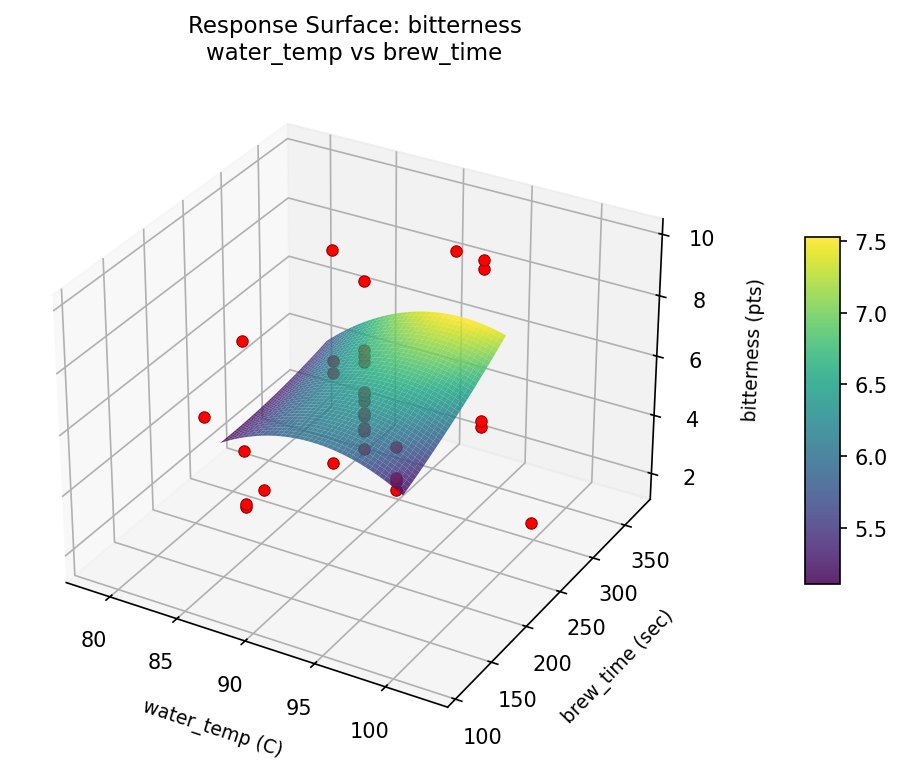
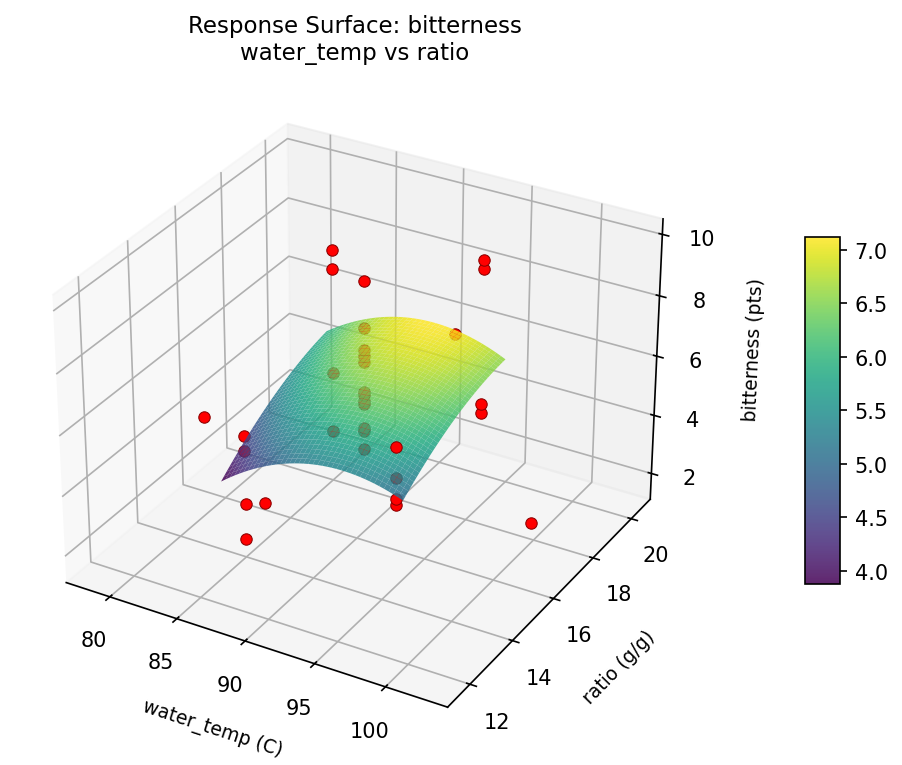
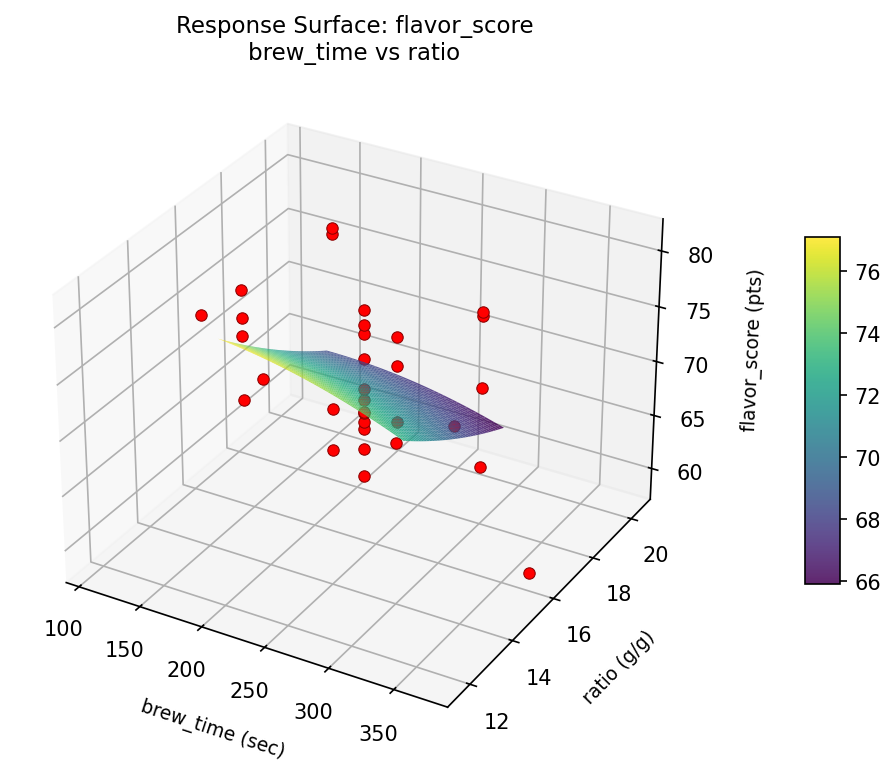
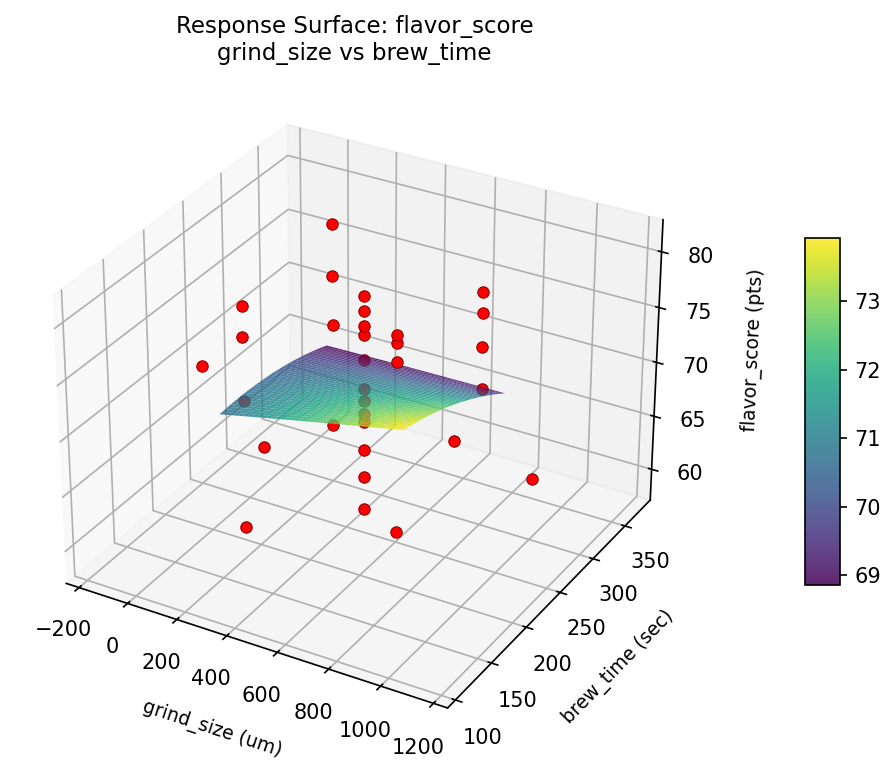
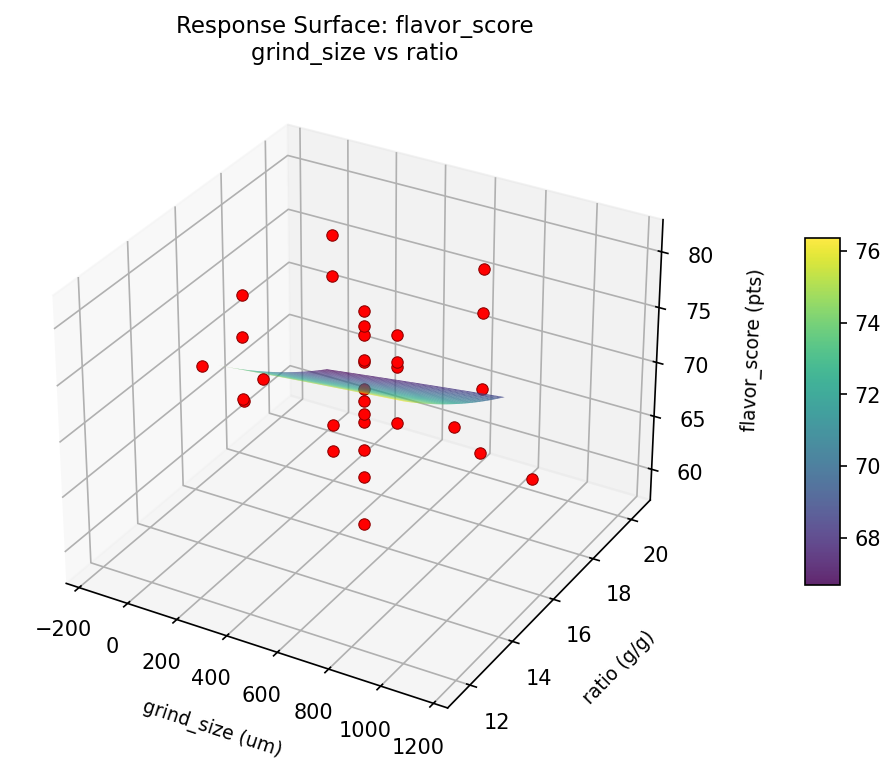
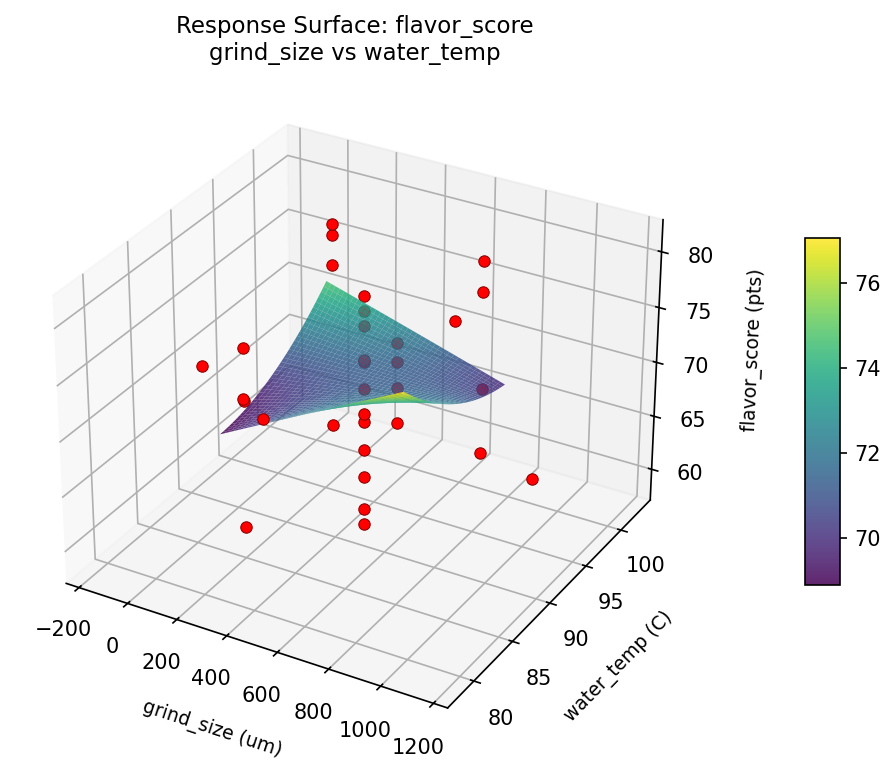
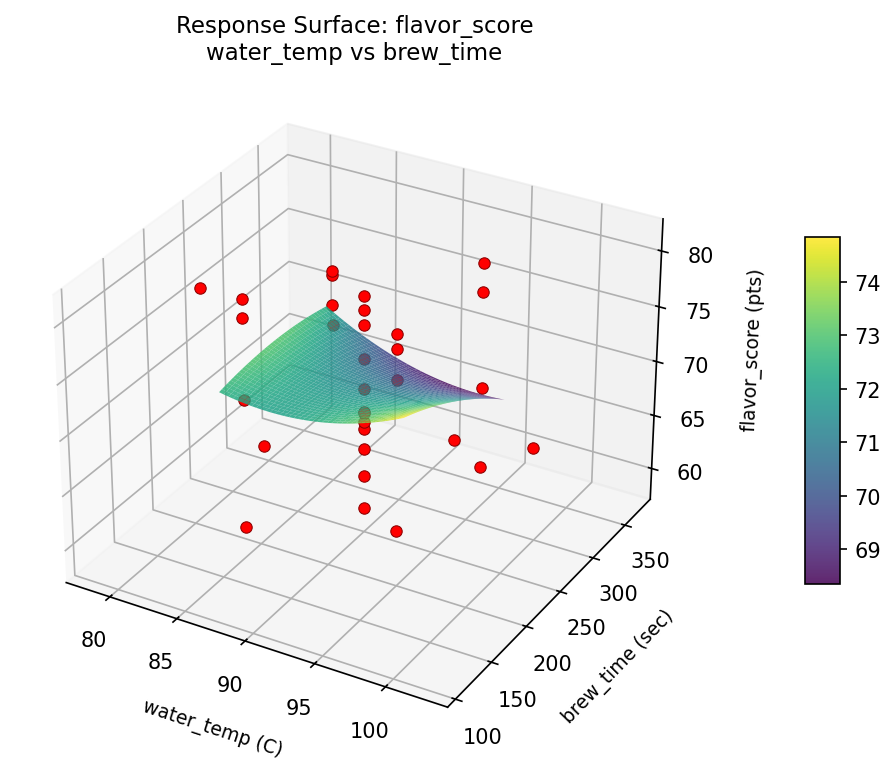
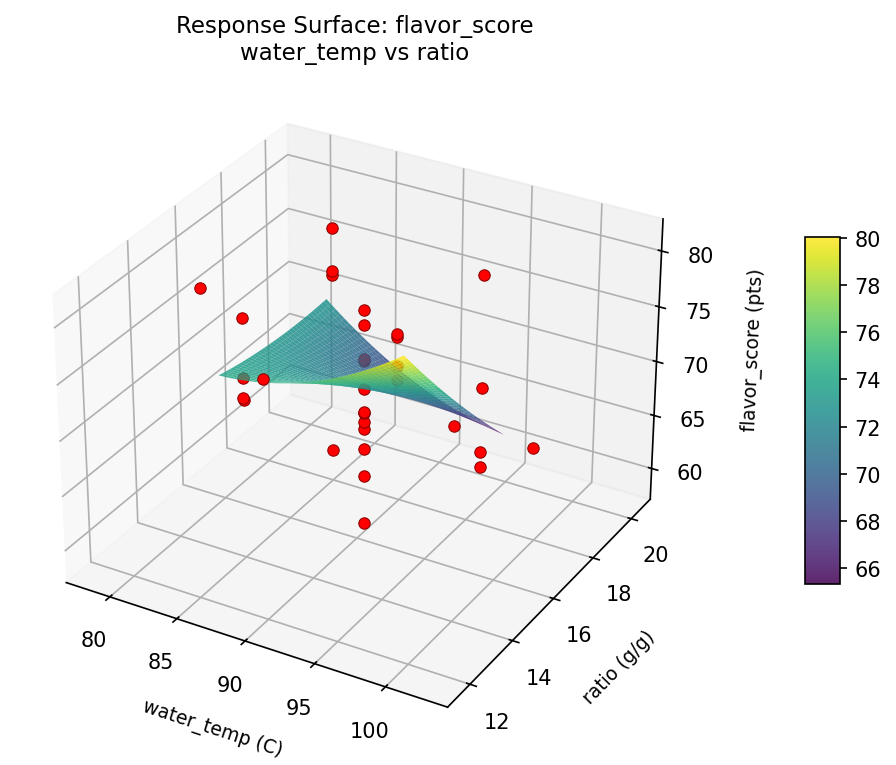
Response Surface Plots
3D surfaces fitted with quadratic RSM. Red dots are observed data points.
bitterness brew time vs ratio
bitterness grind size vs brew time
bitterness grind size vs ratio
bitterness grind size vs water temp
bitterness water temp vs brew time
bitterness water temp vs ratio
flavor score brew time vs ratio
flavor score grind size vs brew time
flavor score grind size vs ratio
flavor score grind size vs water temp
flavor score water temp vs brew time
flavor score water temp vs ratio
Multi-Objective Optimization
When responses compete, Derringer–Suich desirability finds the best compromise.
Each response is scaled to a 0–1 desirability, then combined via a weighted geometric mean.
Overall Desirability
D = 0.8876
Per-Response Desirability
| Response | Weight | Desirability | Predicted | Dir |
|---|
flavor_score |
1.5 |
|
80.50 0.9263 80.50 pts |
↑ |
bitterness |
1.0 |
|
2.80 0.8326 2.80 pts |
↓ |
Recommended Settings
| Factor | Value |
|---|
grind_size | 500 um |
water_temp | 90.5 C |
brew_time | 240 sec |
ratio | 16 g/g |
Source: from observed run #6
Trade-off Summary
Sacrifice = how much worse than single-objective best.
| Response | Predicted | Best Observed | Sacrifice |
|---|
bitterness | 2.80 | 1.70 | +1.10 |
Top 3 Runs by Desirability
| Run | D | Factor Settings |
|---|
| #3 | 0.8149 | grind_size=200, water_temp=96, brew_time=300, ratio=18 |
| #13 | 0.7662 | grind_size=800, water_temp=85, brew_time=180, ratio=14 |
Model Quality
| Response | R² | Type |
|---|
bitterness | 0.1331 | linear |
Full Multi-Objective Output
============================================================
MULTI-OBJECTIVE OPTIMIZATION
Method: Derringer-Suich Desirability Function
============================================================
Overall desirability: D = 0.8876
Response Weight Desirability Predicted Direction
---------------------------------------------------------------------
flavor_score 1.5 0.9263 80.50 pts ↑
bitterness 1.0 0.8326 2.80 pts ↓
Recommended settings:
grind_size = 500 um
water_temp = 90.5 C
brew_time = 240 sec
ratio = 16 g/g
(from observed run #6)
Trade-off summary:
flavor_score: 80.50 (best observed: 81.20, sacrifice: +0.70)
bitterness: 2.80 (best observed: 1.70, sacrifice: +1.10)
Model quality:
flavor_score: R² = 0.1923 (linear)
bitterness: R² = 0.1331 (linear)
Top 3 observed runs by overall desirability:
1. Run #6 (D=0.8876): grind_size=500, water_temp=90.5, brew_time=240, ratio=16
2. Run #3 (D=0.8149): grind_size=200, water_temp=96, brew_time=300, ratio=18
3. Run #13 (D=0.7662): grind_size=800, water_temp=85, brew_time=180, ratio=14
Full Analysis Output
=== Main Effects: flavor_score ===
Factor Effect Std Error % Contribution
--------------------------------------------------------------
water_temp 12.2000 1.1880 39.7%
grind_size 9.1786 1.1880 29.9%
brew_time 6.6250 1.1880 21.6%
ratio 2.7000 1.1880 8.8%
=== ANOVA Table: flavor_score ===
Source DF SS MS F p-value
-----------------------------------------------------------------------------
grind_size 4 134.6227 33.6557 0.613 0.6598
water_temp 4 135.7613 33.9403 0.618 0.6564
brew_time 4 154.3391 38.5848 0.703 0.6021
ratio 4 41.0263 10.2566 0.187 0.9416
Lack of Fit 8 549.9257 68.7407 1.252 0.3899
Pure Error 7 384.3200 54.9029
Error 15 934.2457 54.9029
Total 31 1399.9950 45.1611
=== Summary Statistics: flavor_score ===
grind_size:
Level N Mean Std Min Max
------------------------------------------------------------
-157.267 1 79.4000 0.0000 79.4000 79.4000
1157.27 1 76.2000 0.0000 76.2000 76.2000
200 8 71.9125 8.5359 58.7000 81.2000
500 14 70.2214 6.0354 59.9000 78.1000
800 8 73.5000 6.3449 65.6000 80.9000
water_temp:
Level N Mean Std Min Max
------------------------------------------------------------
102.55 1 63.8000 0.0000 63.8000 63.8000
78.4501 1 76.0000 0.0000 76.0000 76.0000
85 8 74.2625 7.5104 60.1000 80.9000
90.5 14 71.3500 6.2084 59.9000 79.4000
96 8 71.1500 7.2538 58.7000 81.2000
brew_time:
Level N Mean Std Min Max
------------------------------------------------------------
108.547 1 68.9000 0.0000 68.9000 68.9000
180 8 69.8875 7.6665 58.7000 80.9000
240 14 71.4357 6.6267 59.9000 79.4000
300 8 75.5250 6.1337 65.6000 81.2000
371.453 1 69.7000 0.0000 69.7000 69.7000
ratio:
Level N Mean Std Min Max
------------------------------------------------------------
11.6182 1 73.6000 0.0000 73.6000 73.6000
14 8 71.7125 8.7924 58.7000 80.5000
16 14 71.0000 6.6382 59.9000 79.4000
18 8 73.7000 5.9156 65.6000 81.2000
20.3818 1 71.1000 0.0000 71.1000 71.1000
=== Main Effects: bitterness ===
Factor Effect Std Error % Contribution
--------------------------------------------------------------
brew_time 4.9625 0.3645 34.5%
grind_size 3.9875 0.3645 27.7%
water_temp 3.0786 0.3645 21.4%
ratio 2.3500 0.3645 16.3%
=== ANOVA Table: bitterness ===
Source DF SS MS F p-value
-----------------------------------------------------------------------------
grind_size 4 24.1712 6.0428 1.087 0.3979
water_temp 4 28.1452 7.0363 1.266 0.3264
brew_time 4 29.8341 7.4585 1.342 0.3001
ratio 4 17.9716 4.4929 0.809 0.5388
Lack of Fit 8 0.0000 0.0000 0.000 1.0000
Pure Error 7 38.8987 5.5570
Error 15 31.7066 5.5570
Total 31 131.8287 4.2525
=== Summary Statistics: bitterness ===
grind_size:
Level N Mean Std Min Max
------------------------------------------------------------
-157.267 1 5.3000 0.0000 5.3000 5.3000
1157.27 1 8.9000 0.0000 8.9000 8.9000
200 8 5.1875 2.1886 1.7000 8.2000
500 14 6.4000 2.1426 3.7000 9.9000
800 8 4.9125 1.4367 2.8000 7.1000
water_temp:
Level N Mean Std Min Max
------------------------------------------------------------
102.55 1 5.2000 0.0000 5.2000 5.2000
78.4501 1 3.7000 0.0000 3.7000 3.7000
85 8 5.3000 1.0392 4.4000 7.5000
90.5 14 6.7786 2.0830 4.2000 9.9000
96 8 4.8000 2.3821 1.7000 8.2000
brew_time:
Level N Mean Std Min Max
------------------------------------------------------------
108.547 1 5.8000 0.0000 5.8000 5.8000
180 8 5.4625 1.9537 2.9000 8.2000
240 14 6.3143 2.0836 3.7000 9.9000
300 8 4.6375 1.6405 1.7000 6.3000
371.453 1 9.6000 0.0000 9.6000 9.6000
ratio:
Level N Mean Std Min Max
------------------------------------------------------------
11.6182 1 5.7000 0.0000 5.7000 5.7000
14 8 4.9500 2.0928 1.7000 8.2000
16 14 6.4857 2.2487 3.7000 9.9000
18 8 5.1500 1.5793 2.9000 7.5000
20.3818 1 7.3000 0.0000 7.3000 7.3000
Optimization Recommendations
=== Optimization: flavor_score ===
Direction: maximize
Best observed run: #4
grind_size = 500
water_temp = 90.5
brew_time = 240
ratio = 16
Value: 81.2
RSM Model (linear, R² = 0.2531, Adj R² = 0.1424):
Coefficients:
intercept +71.9375
grind_size -0.5837
water_temp +1.4921
brew_time +2.3257
ratio -2.4214
RSM Model (quadratic, R² = 0.4311, Adj R² = -0.0374):
Coefficients:
intercept +74.3352
grind_size -0.5837
water_temp +1.4922
brew_time +2.3257
ratio -2.4214
grind_size*water_temp +0.5188
grind_size*brew_time +1.4563
grind_size*ratio +1.1437
water_temp*brew_time -0.0187
water_temp*ratio -0.3813
brew_time*ratio -0.1188
grind_size^2 -0.4238
water_temp^2 -1.9758
brew_time^2 -0.8821
ratio^2 +0.2846
Curvature analysis:
water_temp coef=-1.9758 concave (has a maximum)
brew_time coef=-0.8821 concave (has a maximum)
grind_size coef=-0.4238 concave (has a maximum)
ratio coef=+0.2846 convex (has a minimum)
Notable interactions:
grind_size*brew_time coef=+1.4563 (synergistic)
grind_size*ratio coef=+1.1437 (synergistic)
grind_size*water_temp coef=+0.5188 (synergistic)
water_temp*ratio coef=-0.3813 (antagonistic)
Predicted optimum (from linear model, at observed points):
grind_size = 200
water_temp = 96
brew_time = 300
ratio = 14
Predicted value: 78.7604
Surface optimum (via L-BFGS-B, linear model):
grind_size = 200
water_temp = 96
brew_time = 300
ratio = 14
Predicted value: 78.7604
Model quality: Weak fit — consider adding center points or using a different design.
Factor importance:
1. brew_time (effect: 22.2, contribution: 38.7%)
2. water_temp (effect: 13.4, contribution: 23.3%)
3. grind_size (effect: 12.8, contribution: 22.3%)
4. ratio (effect: 9.1, contribution: 15.8%)
=== Optimization: bitterness ===
Direction: minimize
Best observed run: #23
grind_size = 500
water_temp = 90.5
brew_time = 240
ratio = 16
Value: 1.7
RSM Model (linear, R² = 0.0754, Adj R² = -0.0615):
Coefficients:
intercept +5.7687
grind_size +0.2846
water_temp +0.2567
brew_time -0.2471
ratio +0.4249
RSM Model (quadratic, R² = 0.5010, Adj R² = 0.0900):
Coefficients:
intercept +5.4960
grind_size +0.2846
water_temp +0.2567
brew_time -0.2471
ratio +0.4249
grind_size*water_temp -0.5375
grind_size*brew_time +0.1125
grind_size*ratio -1.1625
water_temp*brew_time -0.8625
water_temp*ratio +0.7125
brew_time*ratio -0.6375
grind_size^2 +0.0566
water_temp^2 -0.0580
brew_time^2 +0.2545
ratio^2 +0.0878
Curvature analysis:
brew_time coef=+0.2545 convex (has a minimum)
ratio coef=+0.0878 negligible curvature
water_temp coef=-0.0580 negligible curvature
grind_size coef=+0.0566 negligible curvature
Notable interactions:
grind_size*ratio coef=-1.1625 (antagonistic)
water_temp*brew_time coef=-0.8625 (antagonistic)
water_temp*ratio coef=+0.7125 (synergistic)
brew_time*ratio coef=-0.6375 (antagonistic)
grind_size*water_temp coef=-0.5375 (antagonistic)
Predicted optimum (from quadratic model, at observed points):
grind_size = 200
water_temp = 96
brew_time = 180
ratio = 18
Predicted value: 10.5059
Surface optimum (via L-BFGS-B, quadratic model):
grind_size = 200
water_temp = 85
brew_time = 180
ratio = 14
Predicted value: 2.7429
Model quality: Moderate fit — use predictions directionally, not precisely.
Factor importance:
1. brew_time (effect: 3.8, contribution: 40.4%)
2. water_temp (effect: 2.5, contribution: 26.2%)
3. grind_size (effect: 1.7, contribution: 18.5%)
4. ratio (effect: 1.4, contribution: 15.0%)