Summary
This experiment investigates yogurt fermentation optimization. Central composite design to maximize probiotic count and minimize sourness by tuning temperature, starter culture, and fermentation time.
The design varies 3 factors: ferm temp (C), ranging from 37 to 46, starter pct (%), ranging from 1 to 5, and ferm time (hrs), ranging from 4 to 12. The goal is to optimize 2 responses: probiotic cfu (log_CFU/mL) (maximize) and sourness (pts) (minimize). Fixed conditions held constant across all runs include milk fat pct = 3.5, pasteurization = 72C_15s.
A Central Composite Design (CCD) was selected to fit a full quadratic response surface model, including curvature and interaction effects. With 3 factors this produces 22 runs including center points and axial (star) points that extend beyond the factorial range.
Quadratic response surface models were fitted to capture potential curvature and factor interactions. The RSM contour plots below visualize how pairs of factors jointly affect each response.
Key Findings
For probiotic cfu, the most influential factors were ferm time (51.6%), starter pct (38.5%), ferm temp (9.9%). The best observed value was 10.5 (at ferm temp = 41.5, starter pct = -0.651484, ferm time = 8).
For sourness, the most influential factors were starter pct (51.3%), ferm time (39.7%), ferm temp (9.0%). The best observed value was 2.4 (at ferm temp = 41.5, starter pct = 3, ferm time = 0.697033).
Recommended Next Steps
- Run confirmation experiments at the predicted optimal settings to validate the model.
- Consider whether any fixed factors should be varied in a future study.
Experimental Setup
Factors
| Factor | Low | High | Unit |
|---|
ferm_temp | 37 | 46 | C |
starter_pct | 1 | 5 | % |
ferm_time | 4 | 12 | hrs |
Fixed: milk_fat_pct = 3.5, pasteurization = 72C_15s
Responses
| Response | Direction | Unit |
|---|
probiotic_cfu | ↑ maximize | log_CFU/mL |
sourness | ↓ minimize | pts |
Configuration
{
"metadata": {
"name": "Yogurt Fermentation Optimization",
"description": "Central composite design to maximize probiotic count and minimize sourness by tuning temperature, starter culture, and fermentation time"
},
"factors": [
{
"name": "ferm_temp",
"levels": [
"37",
"46"
],
"type": "continuous",
"unit": "C"
},
{
"name": "starter_pct",
"levels": [
"1",
"5"
],
"type": "continuous",
"unit": "%"
},
{
"name": "ferm_time",
"levels": [
"4",
"12"
],
"type": "continuous",
"unit": "hrs"
}
],
"fixed_factors": {
"milk_fat_pct": "3.5",
"pasteurization": "72C_15s"
},
"responses": [
{
"name": "probiotic_cfu",
"optimize": "maximize",
"unit": "log_CFU/mL"
},
{
"name": "sourness",
"optimize": "minimize",
"unit": "pts"
}
],
"settings": {
"operation": "central_composite",
"test_script": "use_cases/91_yogurt_fermentation/sim.sh"
}
}
Experimental Matrix
The Central Composite Design produces 22 runs. Each row is one experiment with specific factor settings.
| Run | ferm_temp | starter_pct | ferm_time |
|---|
| 1 | 41.5 | 3 | 8 |
| 2 | 46 | 1 | 12 |
| 3 | 37 | 5 | 4 |
| 4 | 41.5 | 6.65148 | 8 |
| 5 | 41.5 | 3 | 8 |
| 6 | 33.2842 | 3 | 8 |
| 7 | 41.5 | 3 | 0.697033 |
| 8 | 41.5 | 3 | 8 |
| 9 | 46 | 5 | 4 |
| 10 | 49.7158 | 3 | 8 |
| 11 | 41.5 | 3 | 8 |
| 12 | 41.5 | -0.651484 | 8 |
| 13 | 41.5 | 3 | 8 |
| 14 | 37 | 1 | 12 |
| 15 | 41.5 | 3 | 8 |
| 16 | 46 | 1 | 4 |
| 17 | 41.5 | 3 | 15.303 |
| 18 | 46 | 5 | 12 |
| 19 | 41.5 | 3 | 8 |
| 20 | 37 | 1 | 4 |
| 21 | 37 | 5 | 12 |
| 22 | 41.5 | 3 | 8 |
Step-by-Step Workflow
1
Preview the design
$ doe info --config use_cases/91_yogurt_fermentation/config.json
2
Generate the runner script
$ doe generate --config use_cases/91_yogurt_fermentation/config.json \
--output use_cases/91_yogurt_fermentation/results/run.sh --seed 42
3
Execute the experiments
$ bash use_cases/91_yogurt_fermentation/results/run.sh
4
Analyze results
$ doe analyze --config use_cases/91_yogurt_fermentation/config.json
5
Get optimization recommendations
$ doe optimize --config use_cases/91_yogurt_fermentation/config.json
6
Multi-objective optimization
With 2 competing responses, use --multi to find the best compromise via Derringer–Suich desirability.
$ doe optimize --config use_cases/91_yogurt_fermentation/config.json --multi
7
Generate the HTML report
$ doe report --config use_cases/91_yogurt_fermentation/config.json \
--output use_cases/91_yogurt_fermentation/results/report.html
Features Exercised
| Feature | Value |
|---|
| Design type | central_composite |
| Factor types | continuous (all 3) |
| Arg style | double-dash |
| Responses | 2 (probiotic_cfu ↑, sourness ↓) |
| Total runs | 22 |
Analysis Results
Generated from actual experiment runs using the DOE Helper Tool.
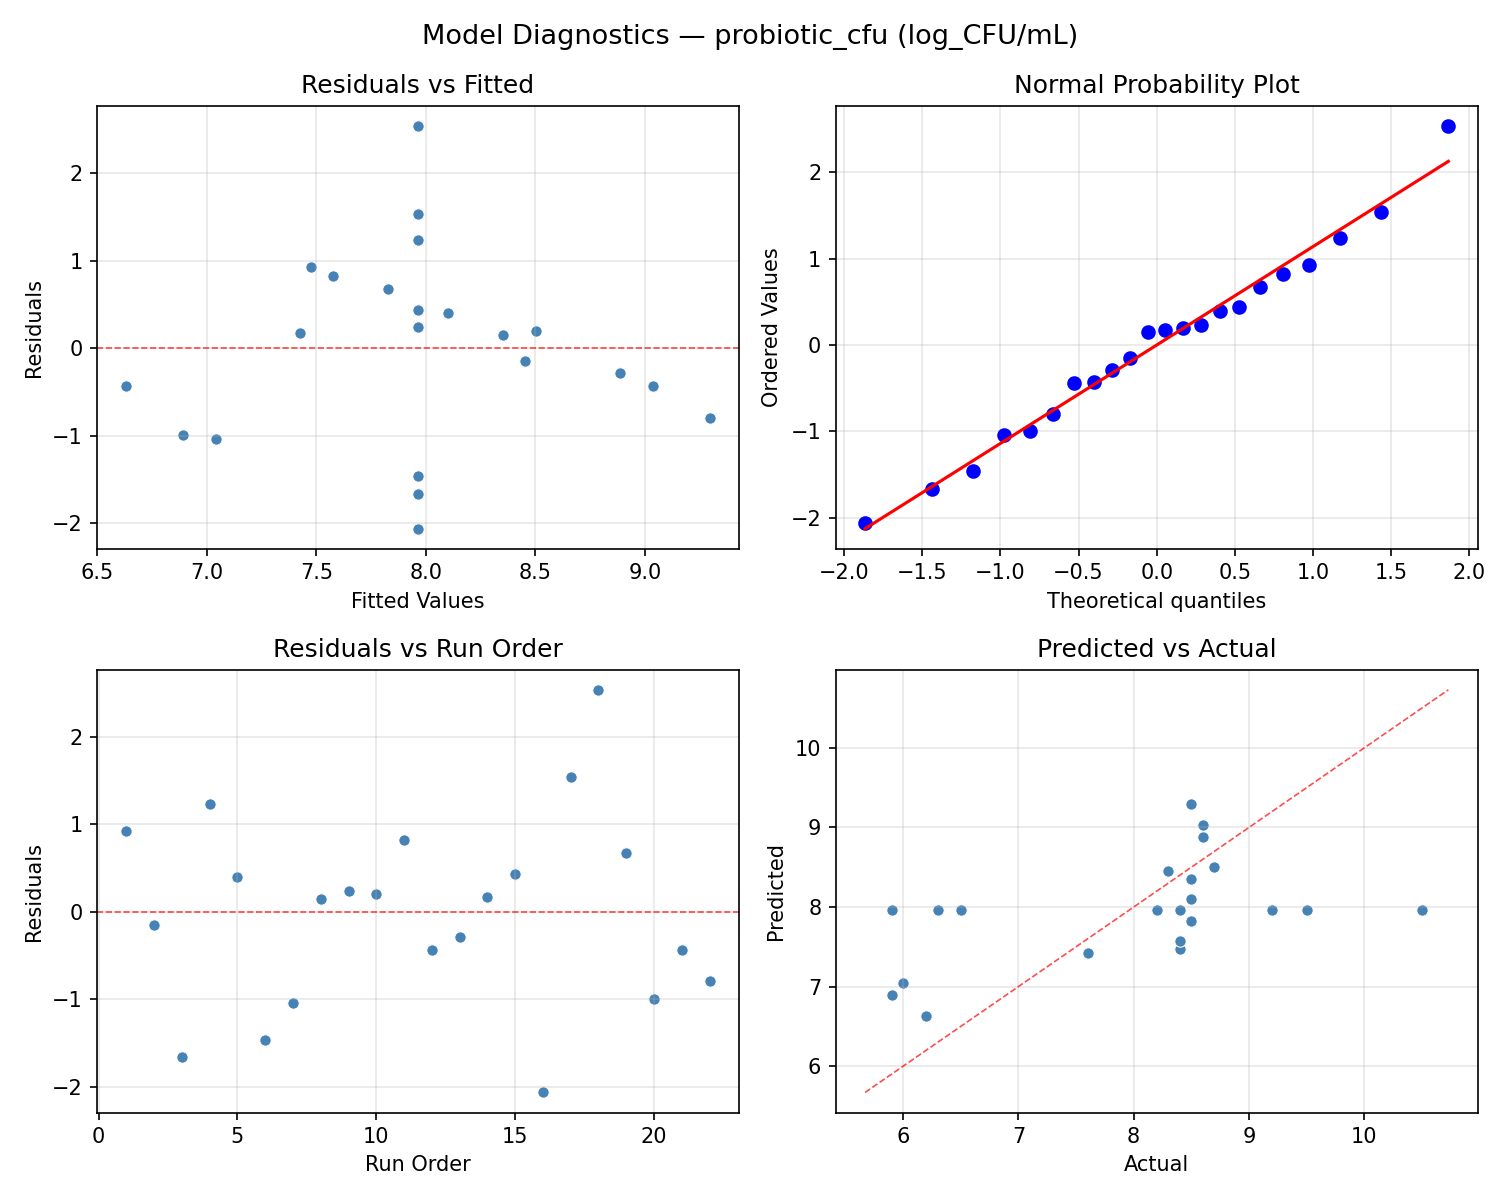
Response: probiotic_cfu
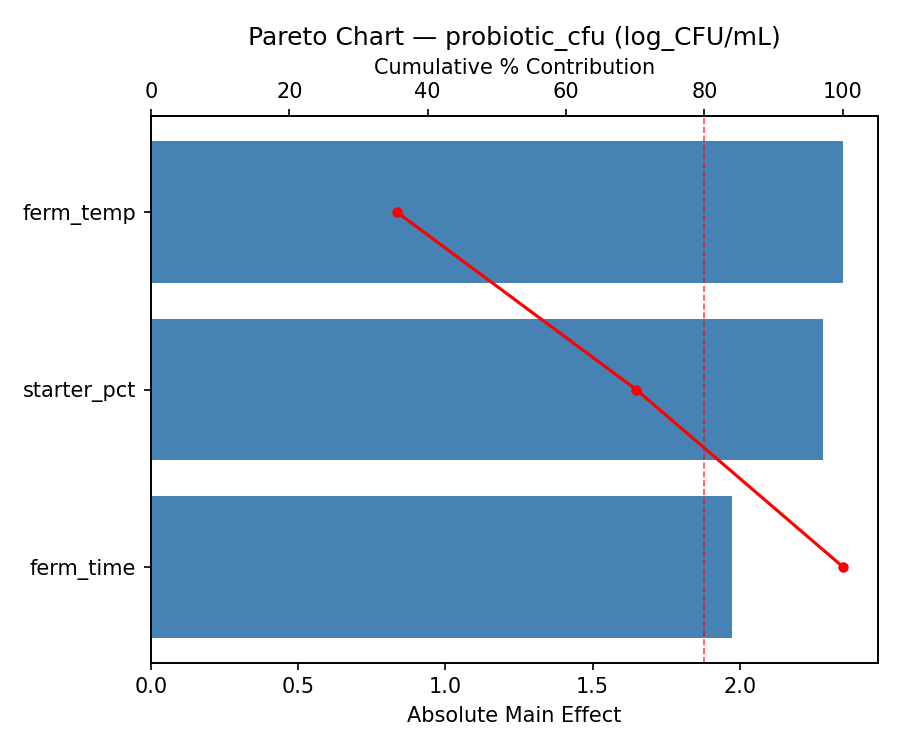
Top factors: ferm_time (51.6%), starter_pct (38.5%), ferm_temp (9.9%).
ANOVA
| Source | DF | SS | MS | F | p-value |
|---|
| Source | DF | SS | MS | F | p-value |
| ferm_temp | 4 | 0.5734 | 0.1434 | 0.152 | 0.9572 |
| starter_pct | 4 | 5.7867 | 1.4467 | 1.537 | 0.2715 |
| ferm_time | 4 | 15.8584 | 3.9646 | 4.212 | 0.0341 |
| Lack | of | Fit | 2 | 5.2836 | 2.6418 |
| Pure | Error | 7 | 6.5887 | | |
| Error | 9 | 11.8723 | 0.9412 | | |
| Total | 21 | 34.0909 | 1.6234 | | |
Pareto Chart
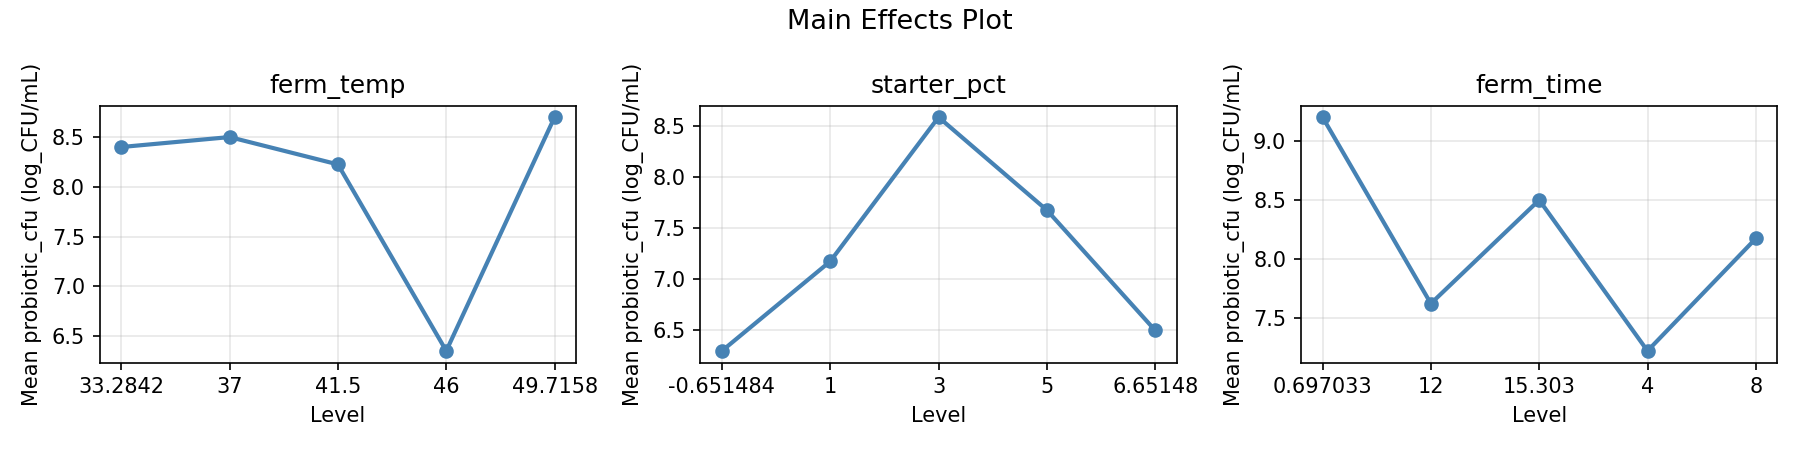
Main Effects Plot
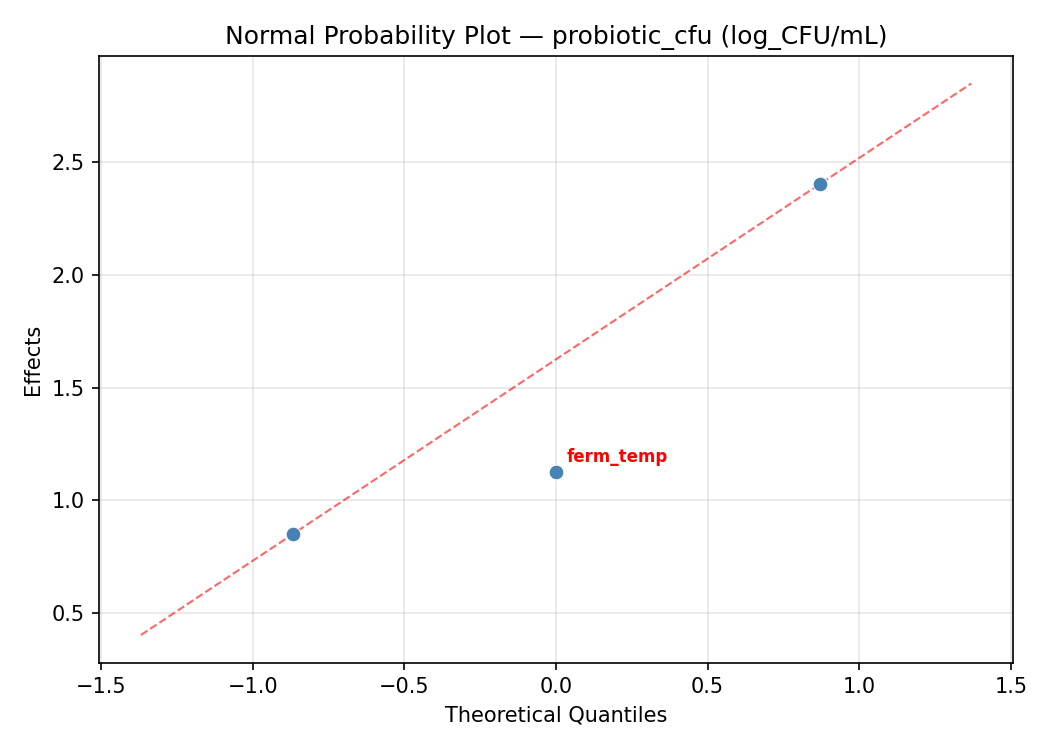
Normal Probability Plot of Effects
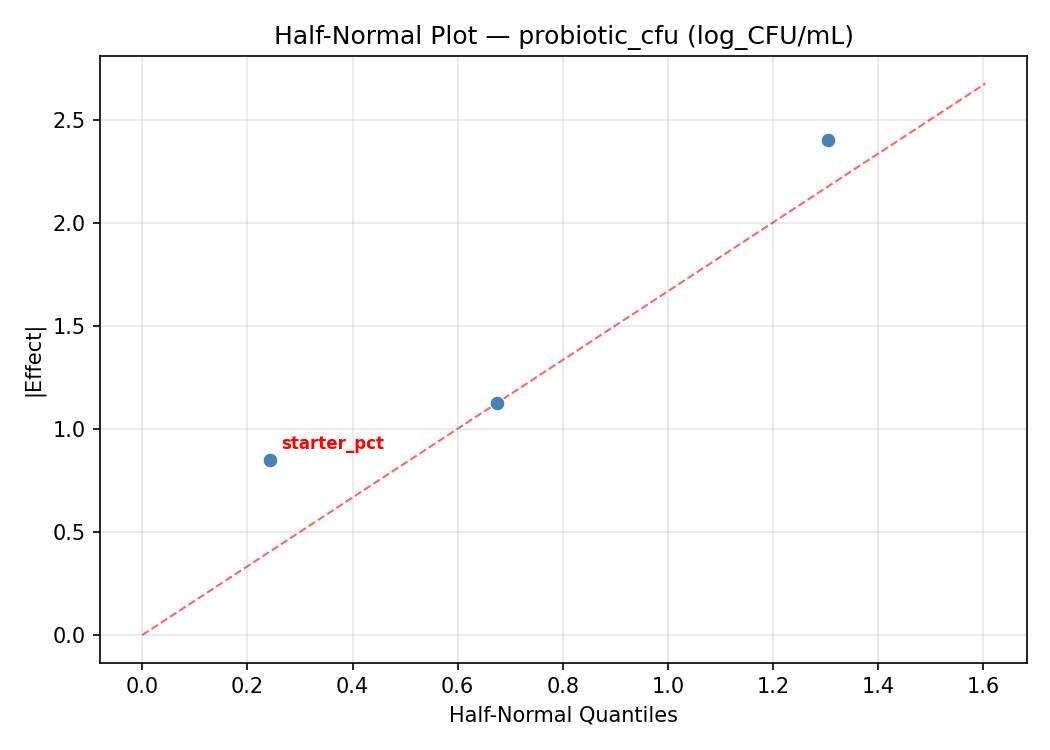
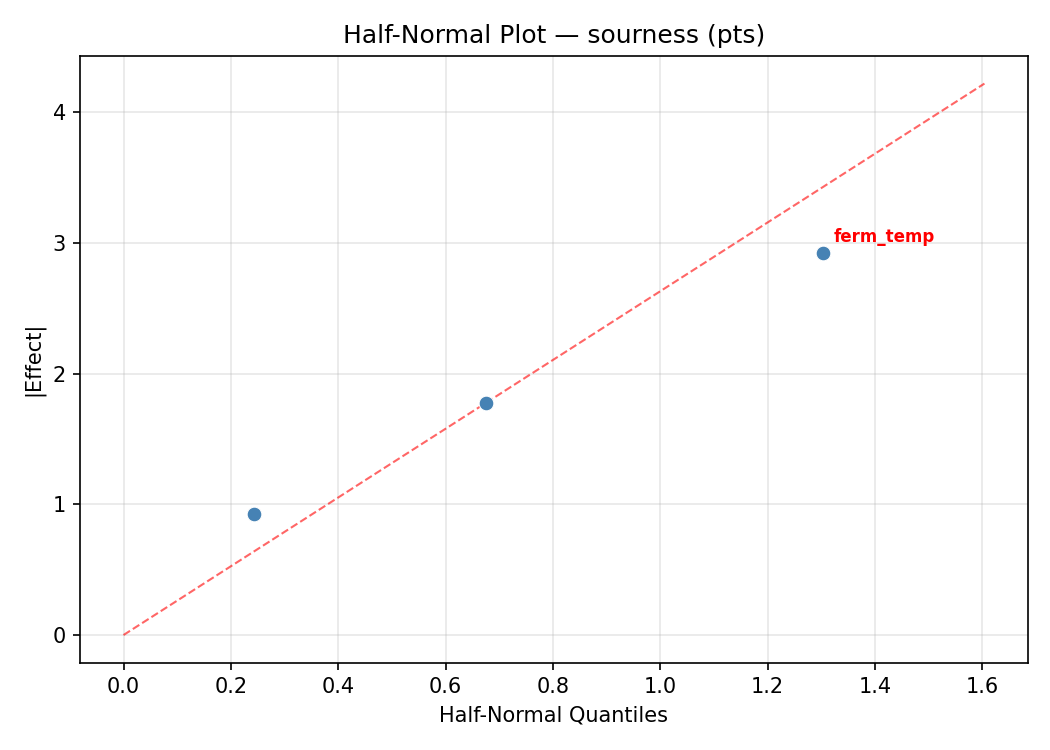
Half-Normal Plot of Effects
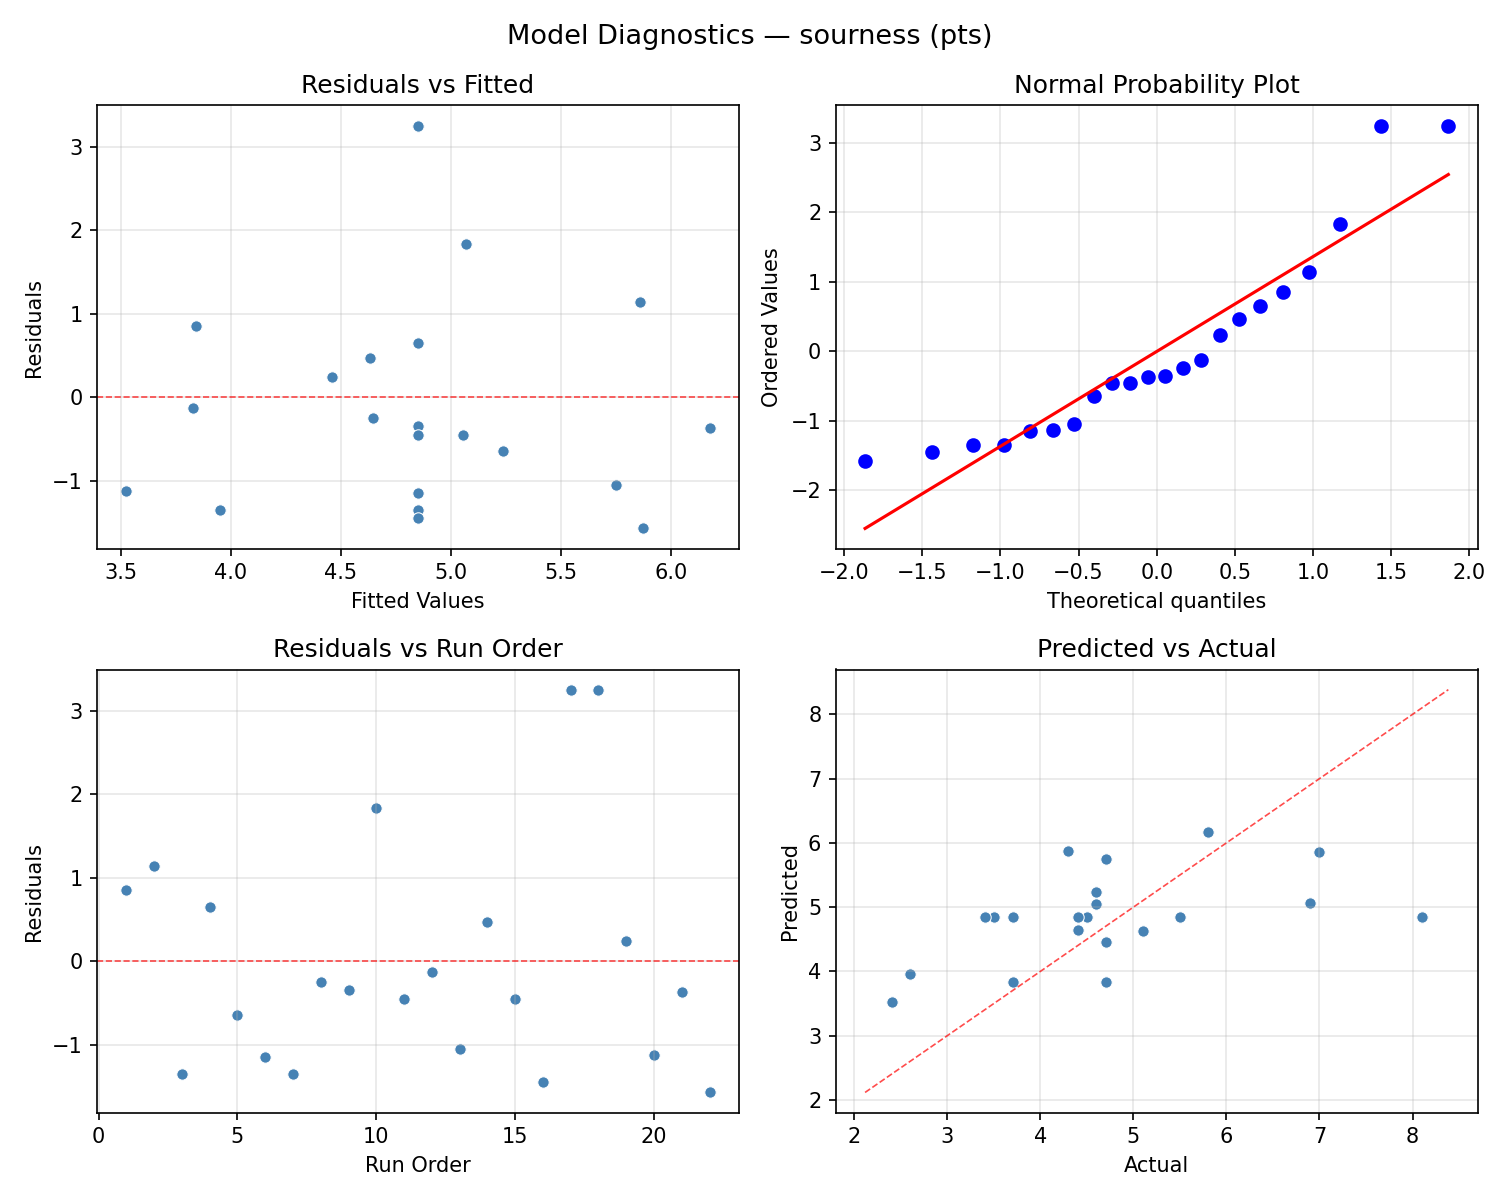
Model Diagnostics
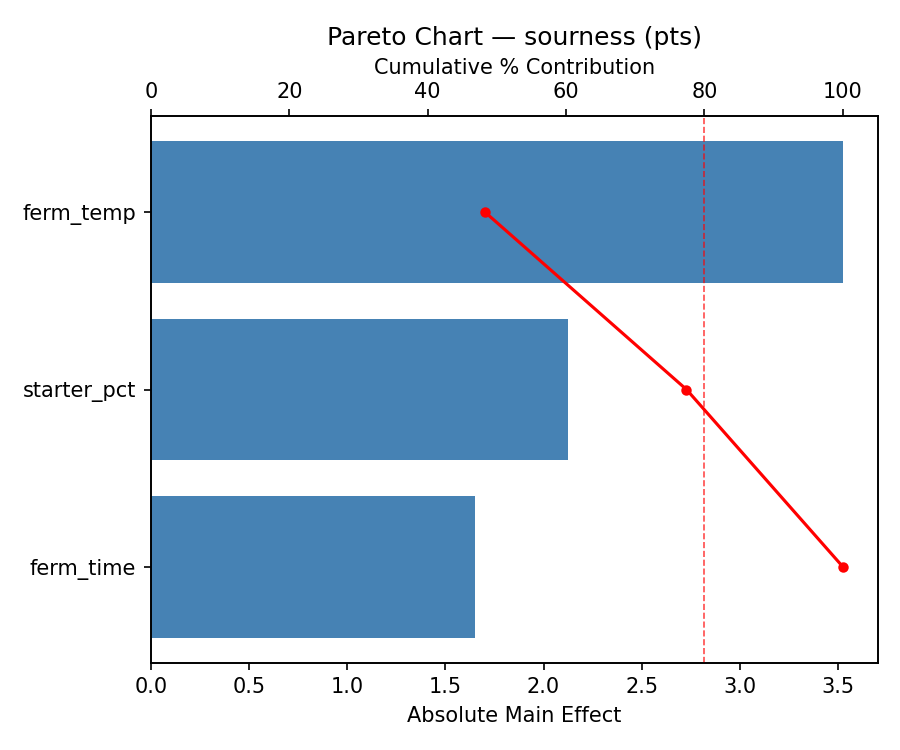
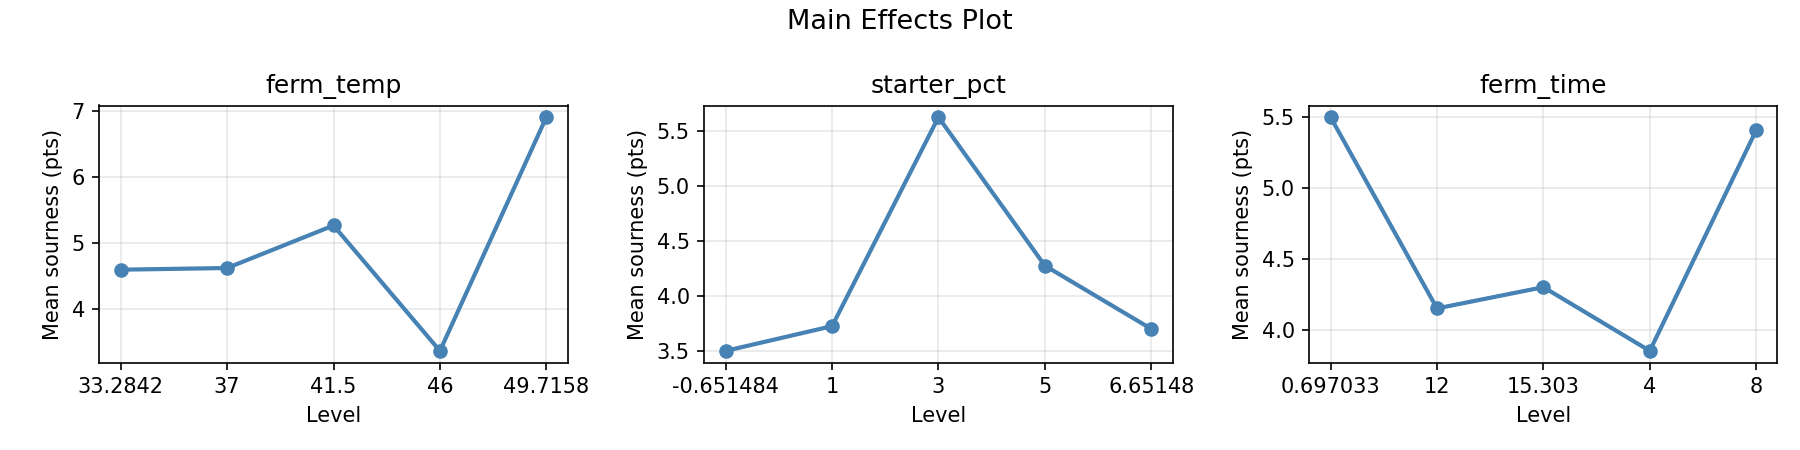
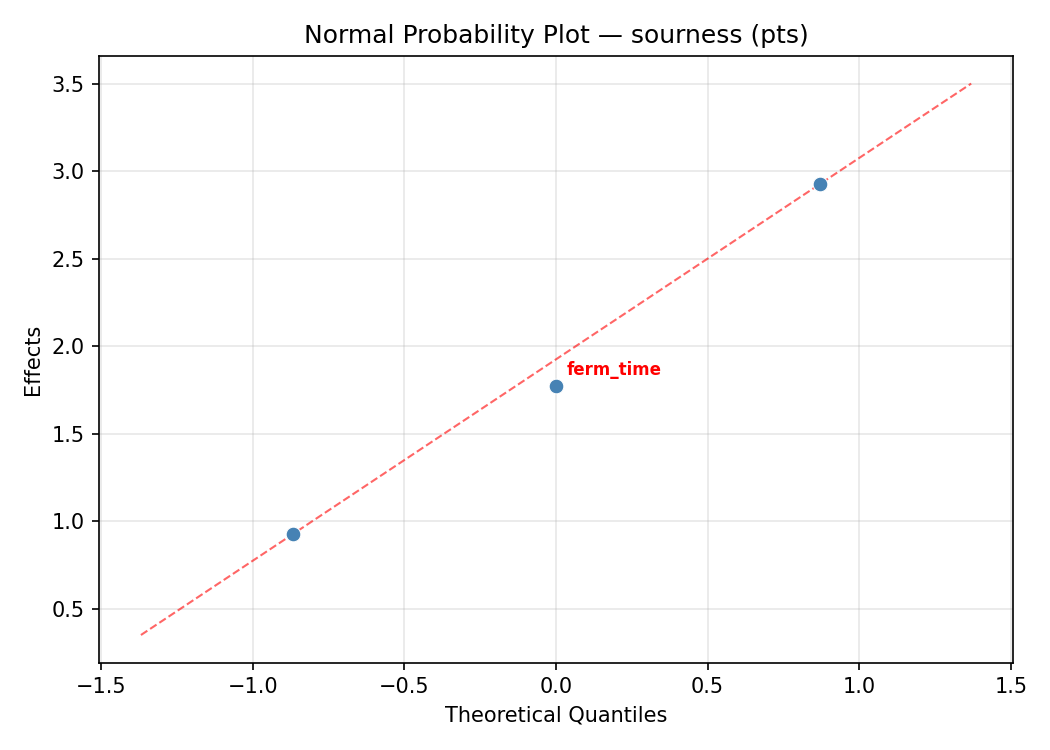
Response: sourness
Top factors: starter_pct (51.3%), ferm_time (39.7%), ferm_temp (9.0%).
ANOVA
| Source | DF | SS | MS | F | p-value |
|---|
| Source | DF | SS | MS | F | p-value |
| ferm_temp | 4 | 1.7808 | 0.4452 | 0.203 | 0.9303 |
| starter_pct | 4 | 11.2308 | 2.8077 | 1.281 | 0.3464 |
| ferm_time | 4 | 14.5175 | 3.6294 | 1.656 | 0.2430 |
| Lack | of | Fit | 2 | 7.1258 | 3.5629 |
| Pure | Error | 7 | 15.3400 | | |
| Error | 9 | 22.4658 | 2.1914 | | |
| Total | 21 | 49.9950 | 2.3807 | | |
Pareto Chart
Main Effects Plot
Normal Probability Plot of Effects
Half-Normal Plot of Effects
Model Diagnostics
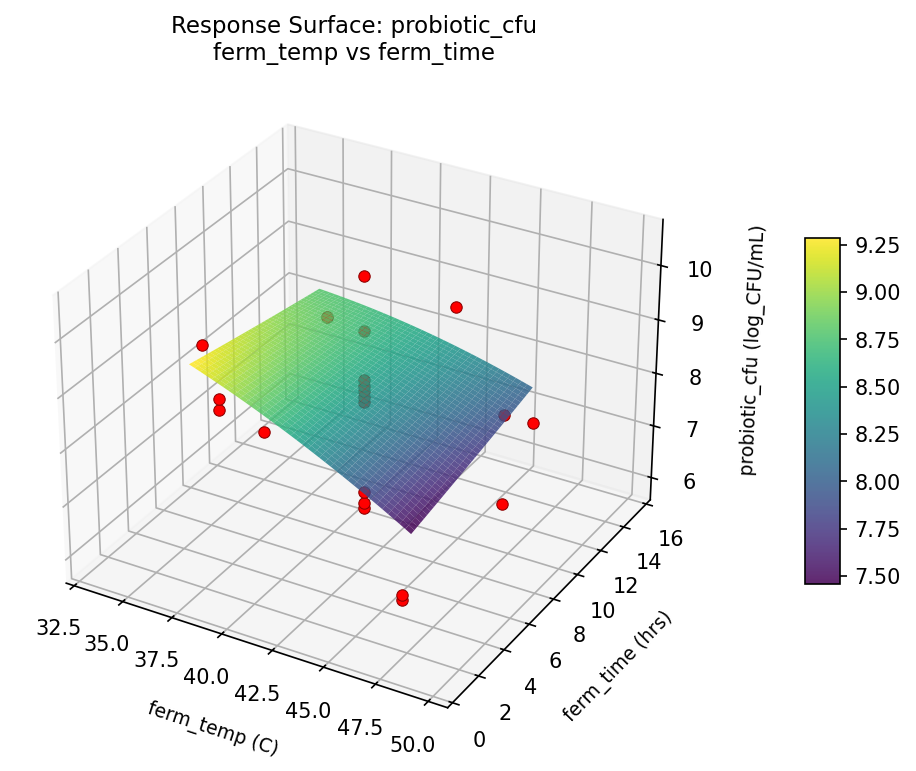
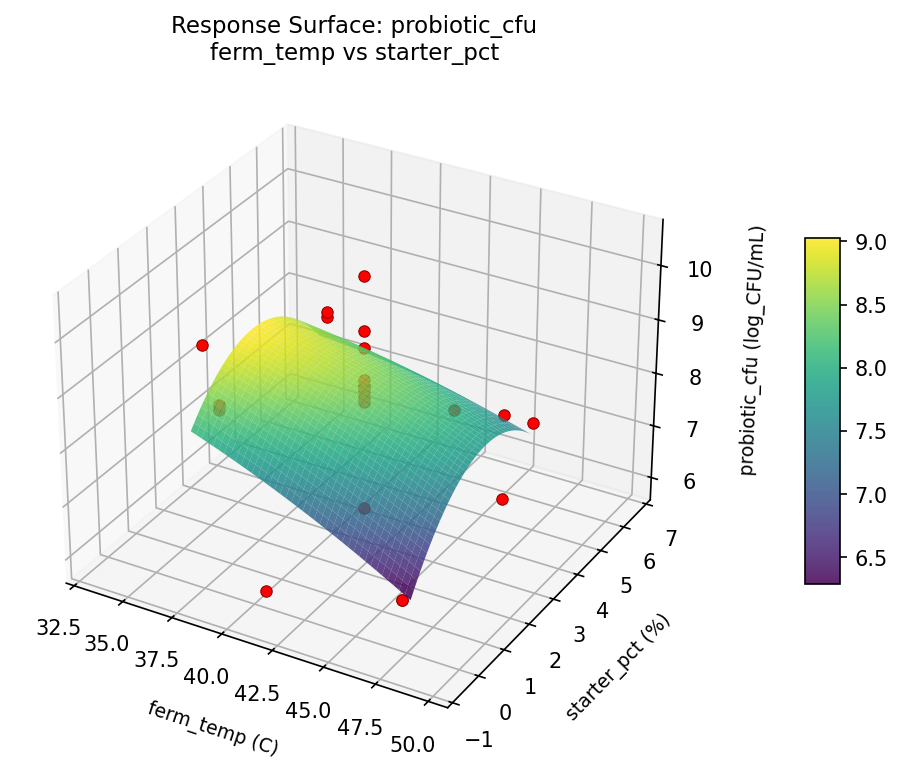
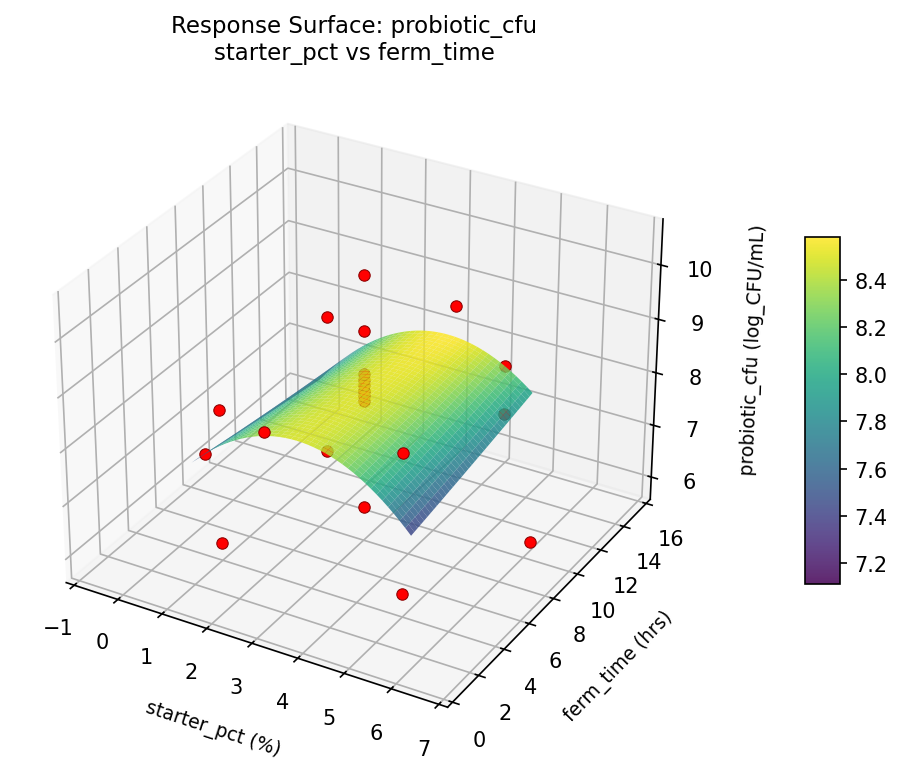
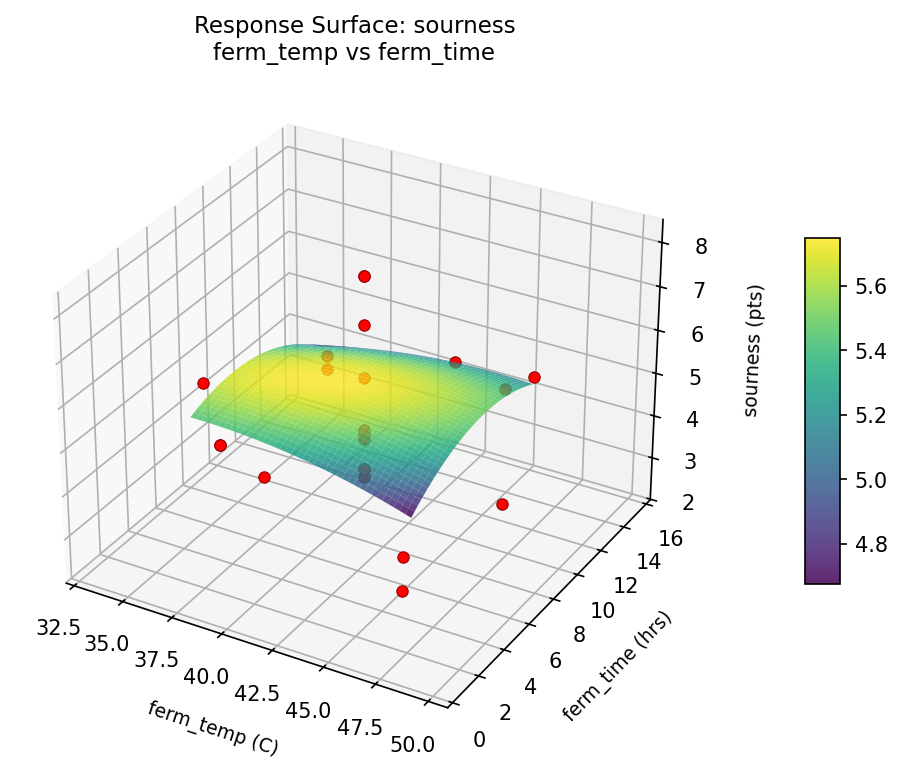
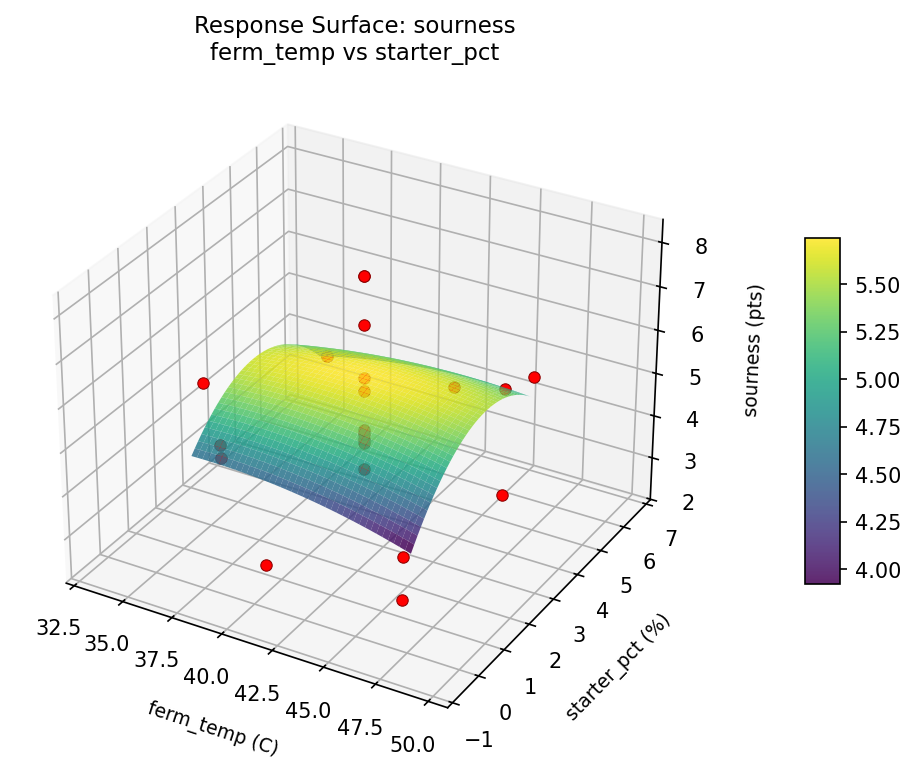
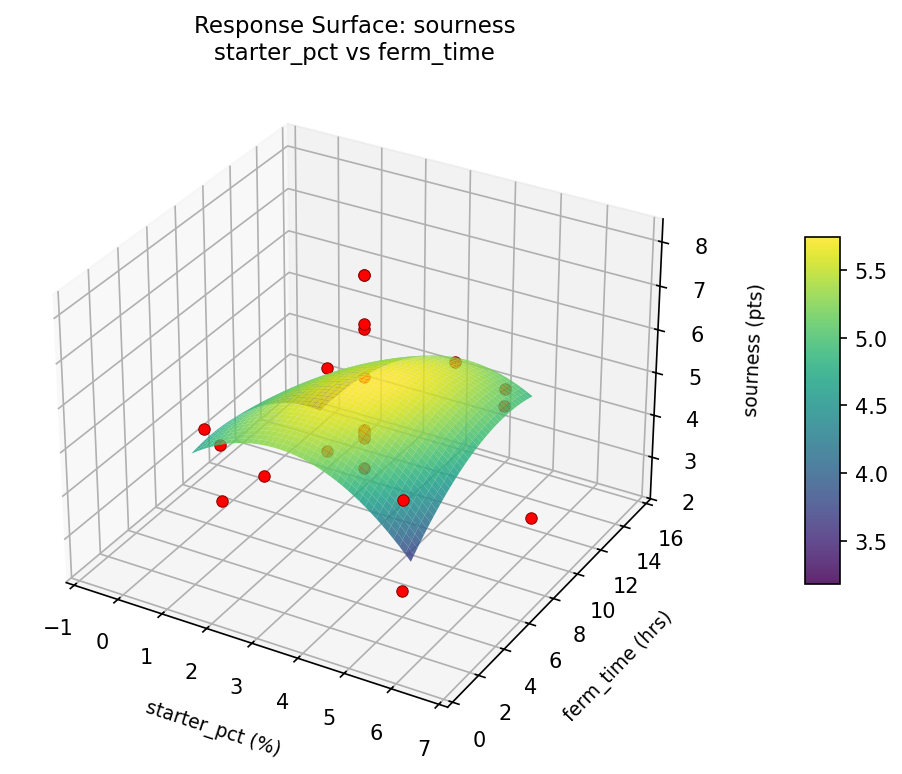
Response Surface Plots
3D surfaces fitted with quadratic RSM. Red dots are observed data points.
probiotic cfu ferm temp vs ferm time
probiotic cfu ferm temp vs starter pct
probiotic cfu starter pct vs ferm time
sourness ferm temp vs ferm time
sourness ferm temp vs starter pct
sourness starter pct vs ferm time
Multi-Objective Optimization
When responses compete, Derringer–Suich desirability finds the best compromise.
Each response is scaled to a 0–1 desirability, then combined via a weighted geometric mean.
Overall Desirability
D = 0.6143
Per-Response Desirability
| Response | Weight | Desirability | Predicted | Dir |
|---|
probiotic_cfu |
1.0 |
|
8.70 0.5983 8.70 log_CFU/mL |
↑ |
sourness |
1.5 |
|
4.47 0.6252 4.47 pts |
↓ |
Recommended Settings
| Factor | Value |
|---|
ferm_temp | 37.9 C |
starter_pct | 5 % |
ferm_time | 12 hrs |
Source: from RSM model prediction
Trade-off Summary
Sacrifice = how much worse than single-objective best.
| Response | Predicted | Best Observed | Sacrifice |
|---|
sourness | 4.47 | 2.40 | +2.07 |
Top 3 Runs by Desirability
| Run | D | Factor Settings |
|---|
| #8 | 0.6039 | ferm_temp=33.2842, starter_pct=3, ferm_time=8 |
| #15 | 0.5953 | ferm_temp=46, starter_pct=5, ferm_time=12 |
Model Quality
| Response | R² | Type |
|---|
sourness | 0.7833 | quadratic |
Full Multi-Objective Output
============================================================
MULTI-OBJECTIVE OPTIMIZATION
Method: Derringer-Suich Desirability Function
============================================================
Overall desirability: D = 0.6143
Response Weight Desirability Predicted Direction
---------------------------------------------------------------------
probiotic_cfu 1.0 0.5983 8.70 log_CFU/mL ↑
sourness 1.5 0.6252 4.47 pts ↓
Recommended settings:
ferm_temp = 37.9 C
starter_pct = 5 %
ferm_time = 12 hrs
(from RSM model prediction)
Trade-off summary:
probiotic_cfu: 8.70 (best observed: 10.50, sacrifice: +1.80)
sourness: 4.47 (best observed: 2.40, sacrifice: +2.07)
Model quality:
probiotic_cfu: R² = 0.6604 (quadratic)
sourness: R² = 0.7833 (quadratic)
Top 3 observed runs by overall desirability:
1. Run #22 (D=0.6129): ferm_temp=37, starter_pct=1, ferm_time=12
2. Run #8 (D=0.6039): ferm_temp=33.2842, starter_pct=3, ferm_time=8
3. Run #15 (D=0.5953): ferm_temp=46, starter_pct=5, ferm_time=12
Full Analysis Output
=== Main Effects: probiotic_cfu ===
Factor Effect Std Error % Contribution
--------------------------------------------------------------
ferm_time 3.2500 0.2716 51.6%
starter_pct 2.4250 0.2716 38.5%
ferm_temp 0.6250 0.2716 9.9%
=== ANOVA Table: probiotic_cfu ===
Source DF SS MS F p-value
-----------------------------------------------------------------------------
ferm_temp 4 0.5734 0.1434 0.152 0.9572
starter_pct 4 5.7867 1.4467 1.537 0.2715
ferm_time 4 15.8584 3.9646 4.212 0.0341
Lack of Fit 2 5.2836 2.6418 2.807 0.1273
Pure Error 7 6.5887 0.9412
Error 9 11.8723 0.9412
Total 21 34.0909 1.6234
=== Summary Statistics: probiotic_cfu ===
ferm_temp:
Level N Mean Std Min Max
------------------------------------------------------------
33.2842 1 8.4000 0.0000 8.4000 8.4000
37 4 7.9750 2.2351 5.9000 10.5000
41.5 12 7.8750 1.1917 5.9000 9.5000
46 4 7.9750 0.9845 6.5000 8.5000
49.7158 1 8.5000 0.0000 8.5000 8.5000
starter_pct:
Level N Mean Std Min Max
------------------------------------------------------------
-0.651484 1 8.3000 0.0000 8.3000 8.3000
1 4 8.4250 1.7154 6.3000 10.5000
3 12 8.0917 1.0457 5.9000 9.5000
5 4 7.5250 1.5756 5.9000 9.2000
6.65148 1 6.0000 0.0000 6.0000 6.0000
ferm_time:
Level N Mean Std Min Max
------------------------------------------------------------
0.697033 1 8.6000 0.0000 8.6000 8.6000
12 4 6.8000 1.1605 5.9000 8.5000
15.303 1 5.9000 0.0000 5.9000 5.9000
4 4 9.1500 0.9678 8.4000 10.5000
8 12 8.0750 1.0172 6.0000 9.5000
=== Main Effects: sourness ===
Factor Effect Std Error % Contribution
--------------------------------------------------------------
starter_pct 4.4000 0.3290 51.3%
ferm_time 3.4000 0.3290 39.7%
ferm_temp 0.7750 0.3290 9.0%
=== ANOVA Table: sourness ===
Source DF SS MS F p-value
-----------------------------------------------------------------------------
ferm_temp 4 1.7808 0.4452 0.203 0.9303
starter_pct 4 11.2308 2.8077 1.281 0.3464
ferm_time 4 14.5175 3.6294 1.656 0.2430
Lack of Fit 2 7.1258 3.5629 1.626 0.2631
Pure Error 7 15.3400 2.1914
Error 9 22.4658 2.1914
Total 21 49.9950 2.3807
=== Summary Statistics: sourness ===
ferm_temp:
Level N Mean Std Min Max
------------------------------------------------------------
33.2842 1 4.6000 0.0000 4.6000 4.6000
37 4 5.1250 2.2066 3.4000 8.1000
41.5 12 4.9833 1.7320 2.4000 8.1000
46 4 4.3500 0.4509 3.7000 4.7000
49.7158 1 4.4000 0.0000 4.4000 4.4000
starter_pct:
Level N Mean Std Min Max
------------------------------------------------------------
-0.651484 1 7.0000 0.0000 7.0000 7.0000
1 4 5.1500 2.0240 3.5000 8.1000
3 12 4.9333 1.4680 2.4000 8.1000
5 4 4.3250 0.9605 3.4000 5.5000
6.65148 1 2.6000 0.0000 2.6000 2.6000
ferm_time:
Level N Mean Std Min Max
------------------------------------------------------------
0.697033 1 5.8000 0.0000 5.8000 5.8000
12 4 3.8000 0.5477 3.4000 4.6000
15.303 1 2.4000 0.0000 2.4000 2.4000
4 4 5.6750 1.6820 4.4000 8.1000
8 12 5.0500 1.5401 2.6000 8.1000
Optimization Recommendations
=== Optimization: probiotic_cfu ===
Direction: maximize
Best observed run: #18
ferm_temp = 41.5
starter_pct = -0.651484
ferm_time = 8
Value: 10.5
RSM Model (linear, R² = 0.1086, Adj R² = -0.0400):
Coefficients:
intercept +7.9636
ferm_temp -0.0626
starter_pct -0.4057
ferm_time +0.2896
RSM Model (quadratic, R² = 0.3763, Adj R² = -0.0915):
Coefficients:
intercept +7.6018
ferm_temp -0.0626
starter_pct -0.4057
ferm_time +0.2896
ferm_temp*starter_pct +0.6625
ferm_temp*ferm_time +0.3125
starter_pct*ferm_time -0.3625
ferm_temp^2 +0.3359
starter_pct^2 +0.2759
ferm_time^2 -0.0691
Curvature analysis:
ferm_temp coef=+0.3359 convex (has a minimum)
starter_pct coef=+0.2759 convex (has a minimum)
ferm_time coef=-0.0691 negligible curvature
Notable interactions:
ferm_temp*starter_pct coef=+0.6625 (synergistic)
starter_pct*ferm_time coef=-0.3625 (antagonistic)
ferm_temp*ferm_time coef=+0.3125 (synergistic)
Predicted optimum (from linear model, at observed points):
ferm_temp = 37
starter_pct = 1
ferm_time = 12
Predicted value: 8.7215
Surface optimum (via L-BFGS-B, linear model):
ferm_temp = 37
starter_pct = 1
ferm_time = 12
Predicted value: 8.7215
Model quality: Weak fit — consider adding center points or using a different design.
Factor importance:
1. starter_pct (effect: 4.3, contribution: 54.8%)
2. ferm_time (effect: 2.6, contribution: 33.1%)
3. ferm_temp (effect: 1.0, contribution: 12.1%)
=== Optimization: sourness ===
Direction: minimize
Best observed run: #20
ferm_temp = 41.5
starter_pct = 3
ferm_time = 0.697033
Value: 2.4
RSM Model (linear, R² = 0.0356, Adj R² = -0.1252):
Coefficients:
intercept +4.8500
ferm_temp +0.2187
starter_pct -0.2614
ferm_time +0.0717
RSM Model (quadratic, R² = 0.2839, Adj R² = -0.2532):
Coefficients:
intercept +4.6605
ferm_temp +0.2187
starter_pct -0.2614
ferm_time +0.0717
ferm_temp*starter_pct +0.6750
ferm_temp*ferm_time -0.2750
starter_pct*ferm_time -0.3500
ferm_temp^2 +0.2147
starter_pct^2 +0.4097
ferm_time^2 -0.3403
Curvature analysis:
starter_pct coef=+0.4097 convex (has a minimum)
ferm_time coef=-0.3403 concave (has a maximum)
ferm_temp coef=+0.2147 convex (has a minimum)
Notable interactions:
ferm_temp*starter_pct coef=+0.6750 (synergistic)
starter_pct*ferm_time coef=-0.3500 (antagonistic)
Predicted optimum (from linear model, at observed points):
ferm_temp = 46
starter_pct = 1
ferm_time = 12
Predicted value: 5.4018
Surface optimum (via L-BFGS-B, linear model):
ferm_temp = 37
starter_pct = 5
ferm_time = 4
Predicted value: 4.2982
Model quality: Weak fit — consider adding center points or using a different design.
Factor importance:
1. starter_pct (effect: 4.4, contribution: 51.6%)
2. ferm_time (effect: 3.0, contribution: 34.9%)
3. ferm_temp (effect: 1.2, contribution: 13.5%)