Summary
This experiment investigates cpu cross-numa bandwidth. Full factorial design to characterize CPU-to-CPU memory bandwidth and latency across NUMA domains on a 4-socket HPC node.
The design varies 4 factors: numa hop, ranging from local to far, transfer mode, ranging from memcpy to streaming_store, thread count (threads), ranging from 1 to 14, and buffer size (bytes), ranging from 1048576 to 268435456. The goal is to optimize 2 responses: bandwidth GBs (GB/s) (maximize) and latency ns (ns) (minimize). Fixed conditions held constant across all runs include sockets = 4, cores per socket = 28, numa distance near = 21, numa distance far = 31.
A full factorial design was used to explore all 16 possible combinations of the 4 factors at two levels. This guarantees that every main effect and interaction can be estimated independently, at the cost of a larger experiment (24 runs).
Quadratic response surface models were fitted to capture potential curvature and factor interactions. The RSM contour plots below visualize how pairs of factors jointly affect each response.
Key Findings
For bandwidth GBs, the most influential factors were numa hop (54.3%), thread count (33.1%), transfer mode (7.0%). The best observed value was 316.2 (at numa hop = local, transfer mode = memcpy, thread count = 14).
For latency ns, the most influential factors were transfer mode (53.3%), thread count (28.1%), numa hop (17.3%). The best observed value was 61.5 (at numa hop = local, transfer mode = streaming_store, thread count = 1).
Recommended Next Steps
- Consider whether any fixed factors should be varied in a future study.
Experimental Setup
Factors
| Factor | Levels | Type | Unit |
|---|
numa_hop | local, near, far | categorical | |
transfer_mode | memcpy, streaming_store | categorical | |
thread_count | 1, 14 | continuous | threads |
buffer_size | 1048576, 268435456 | continuous | bytes |
Fixed: sockets = 4, cores_per_socket = 28, numa_distance_near = 21, numa_distance_far = 31
Responses
| Response | Direction | Unit |
|---|
bandwidth_GBs | ↑ maximize | GB/s |
latency_ns | ↓ minimize | ns |
Experimental Matrix
The Full Factorial Design produces 24 runs. Each row is one experiment with specific factor settings.
| Run | numa_hop | transfer_mode | thread_count | buffer_size |
|---|
| 1 | near | streaming_store | 14 | 268435456 |
| 2 | local | streaming_store | 1 | 268435456 |
| 3 | far | memcpy | 14 | 1048576 |
| 4 | far | streaming_store | 14 | 268435456 |
| 5 | near | streaming_store | 1 | 268435456 |
| 6 | near | memcpy | 14 | 1048576 |
| 7 | far | memcpy | 1 | 268435456 |
| 8 | near | memcpy | 14 | 268435456 |
| 9 | near | streaming_store | 14 | 1048576 |
| 10 | far | memcpy | 1 | 1048576 |
| 11 | local | memcpy | 1 | 268435456 |
| 12 | near | streaming_store | 1 | 1048576 |
| 13 | far | streaming_store | 1 | 268435456 |
| 14 | local | streaming_store | 14 | 1048576 |
| 15 | near | memcpy | 1 | 268435456 |
| 16 | local | memcpy | 14 | 1048576 |
| 17 | far | streaming_store | 14 | 1048576 |
| 18 | local | streaming_store | 1 | 1048576 |
| 19 | far | memcpy | 14 | 268435456 |
| 20 | local | streaming_store | 14 | 268435456 |
| 21 | near | memcpy | 1 | 1048576 |
| 22 | local | memcpy | 1 | 1048576 |
| 23 | local | memcpy | 14 | 268435456 |
| 24 | far | streaming_store | 1 | 1048576 |
How to Run
$ doe info --config use_cases/17_cpu_cross_numa_bandwidth/config.json
$ doe generate --config use_cases/17_cpu_cross_numa_bandwidth/config.json --output results/run.sh --seed 42
$ bash results/run.sh
$ doe analyze --config use_cases/17_cpu_cross_numa_bandwidth/config.json
$ doe optimize --config use_cases/17_cpu_cross_numa_bandwidth/config.json
$ doe optimize --config use_cases/17_cpu_cross_numa_bandwidth/config.json --multi
$ doe report --config use_cases/17_cpu_cross_numa_bandwidth/config.json --output report.html
Analysis Results
Generated from actual experiment runs.
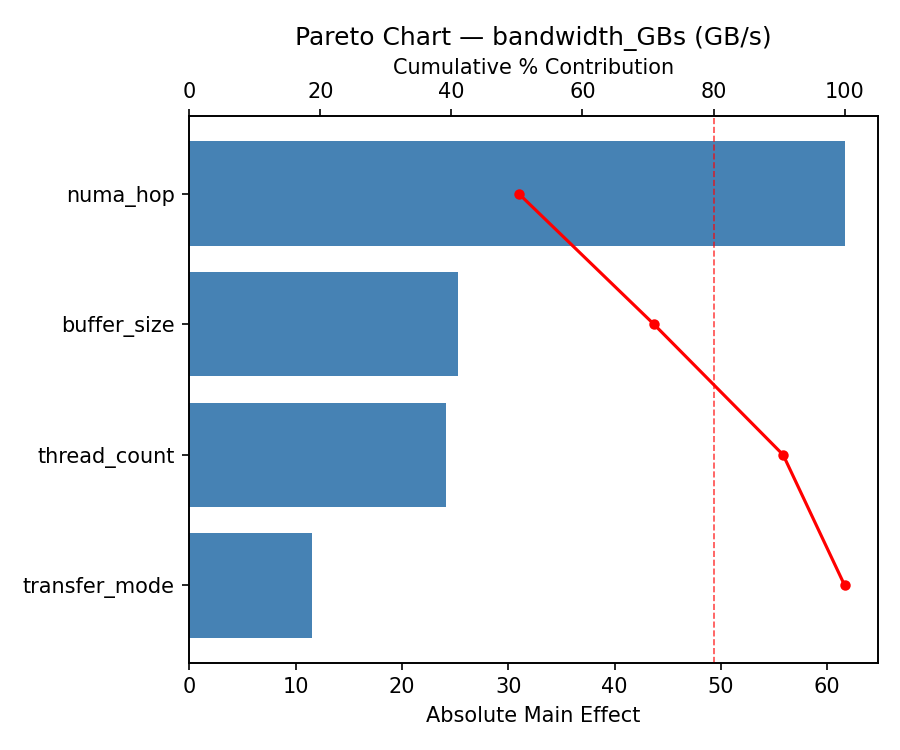
Response: bandwidth_GBs
Pareto Chart
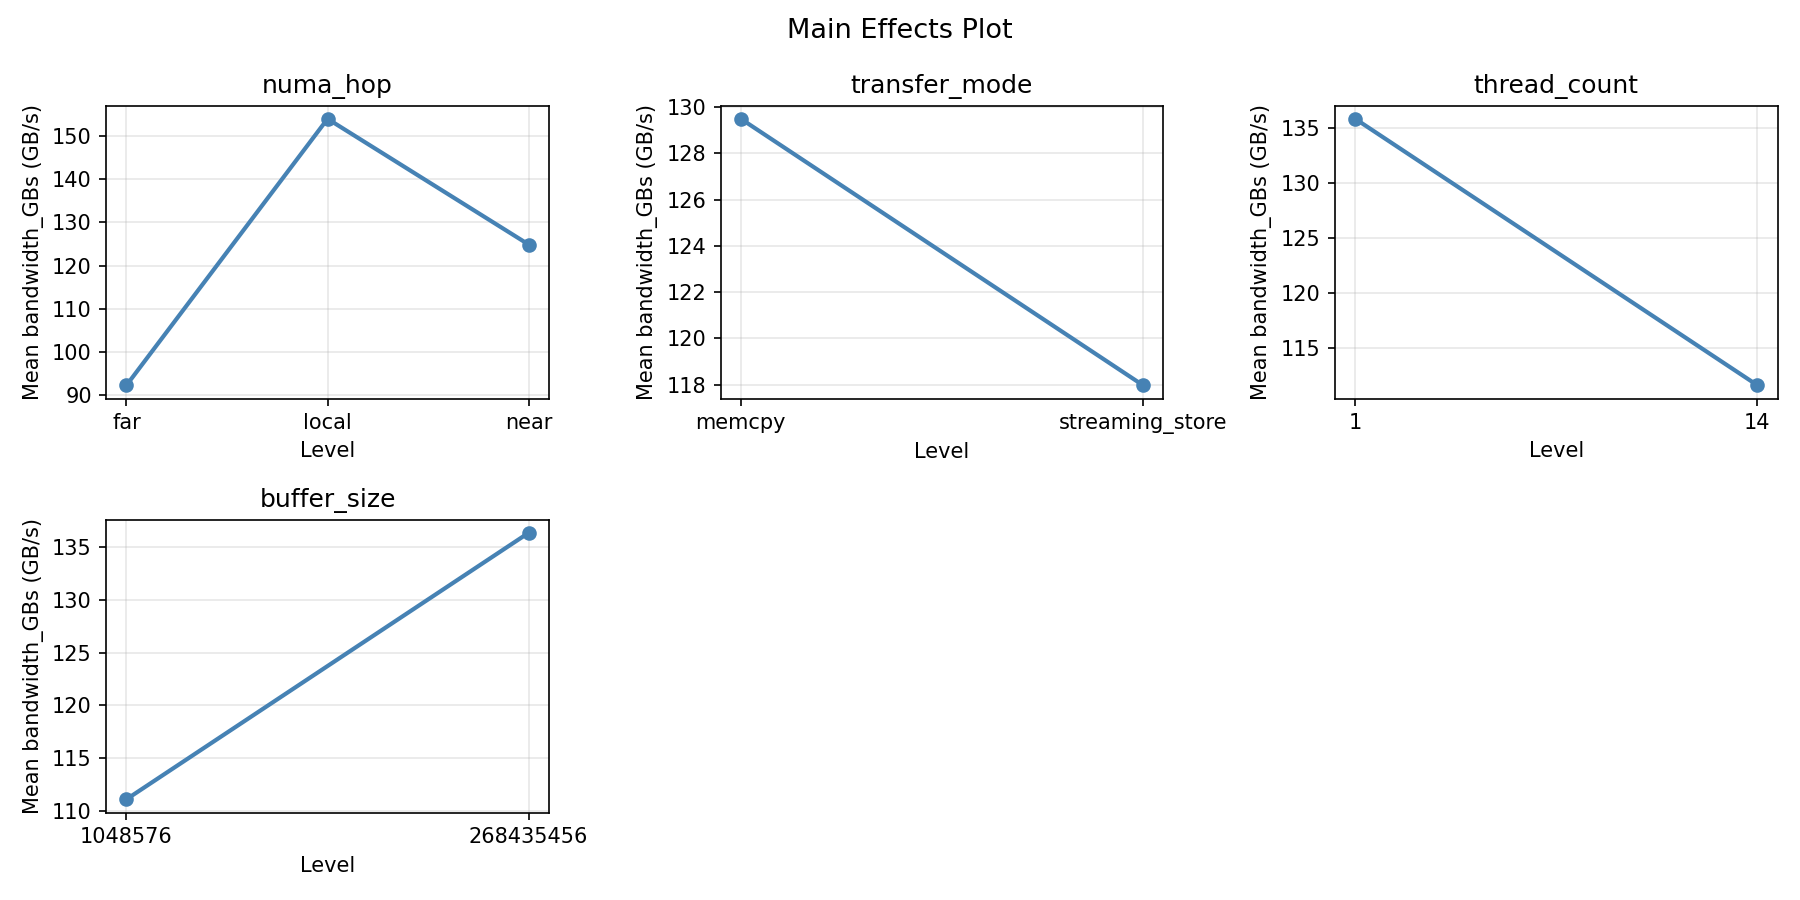
Main Effects Plot
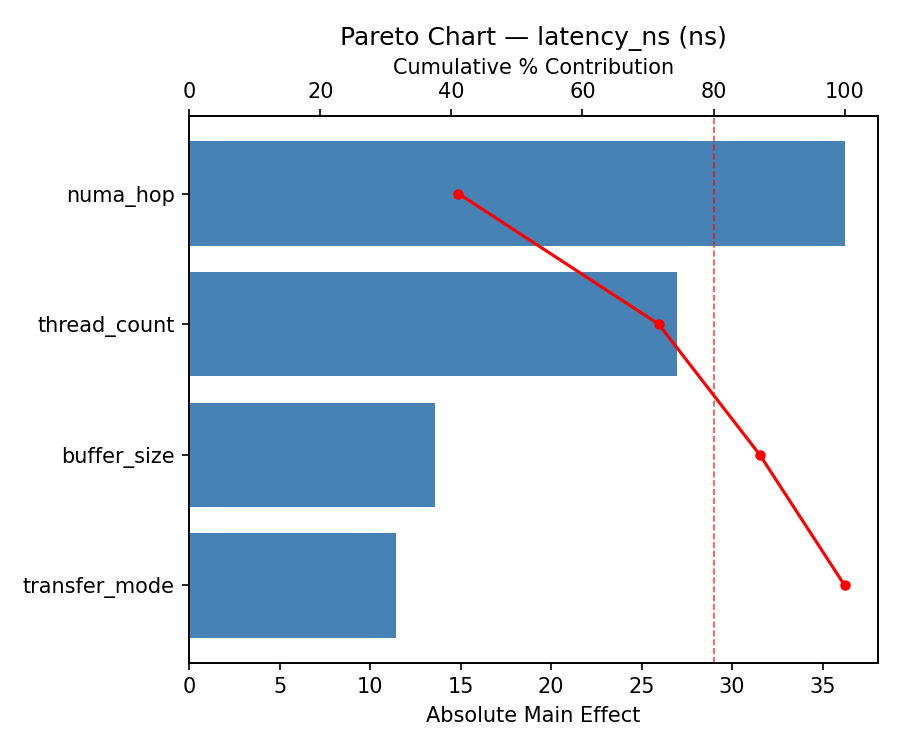
Response: latency_ns
Pareto Chart
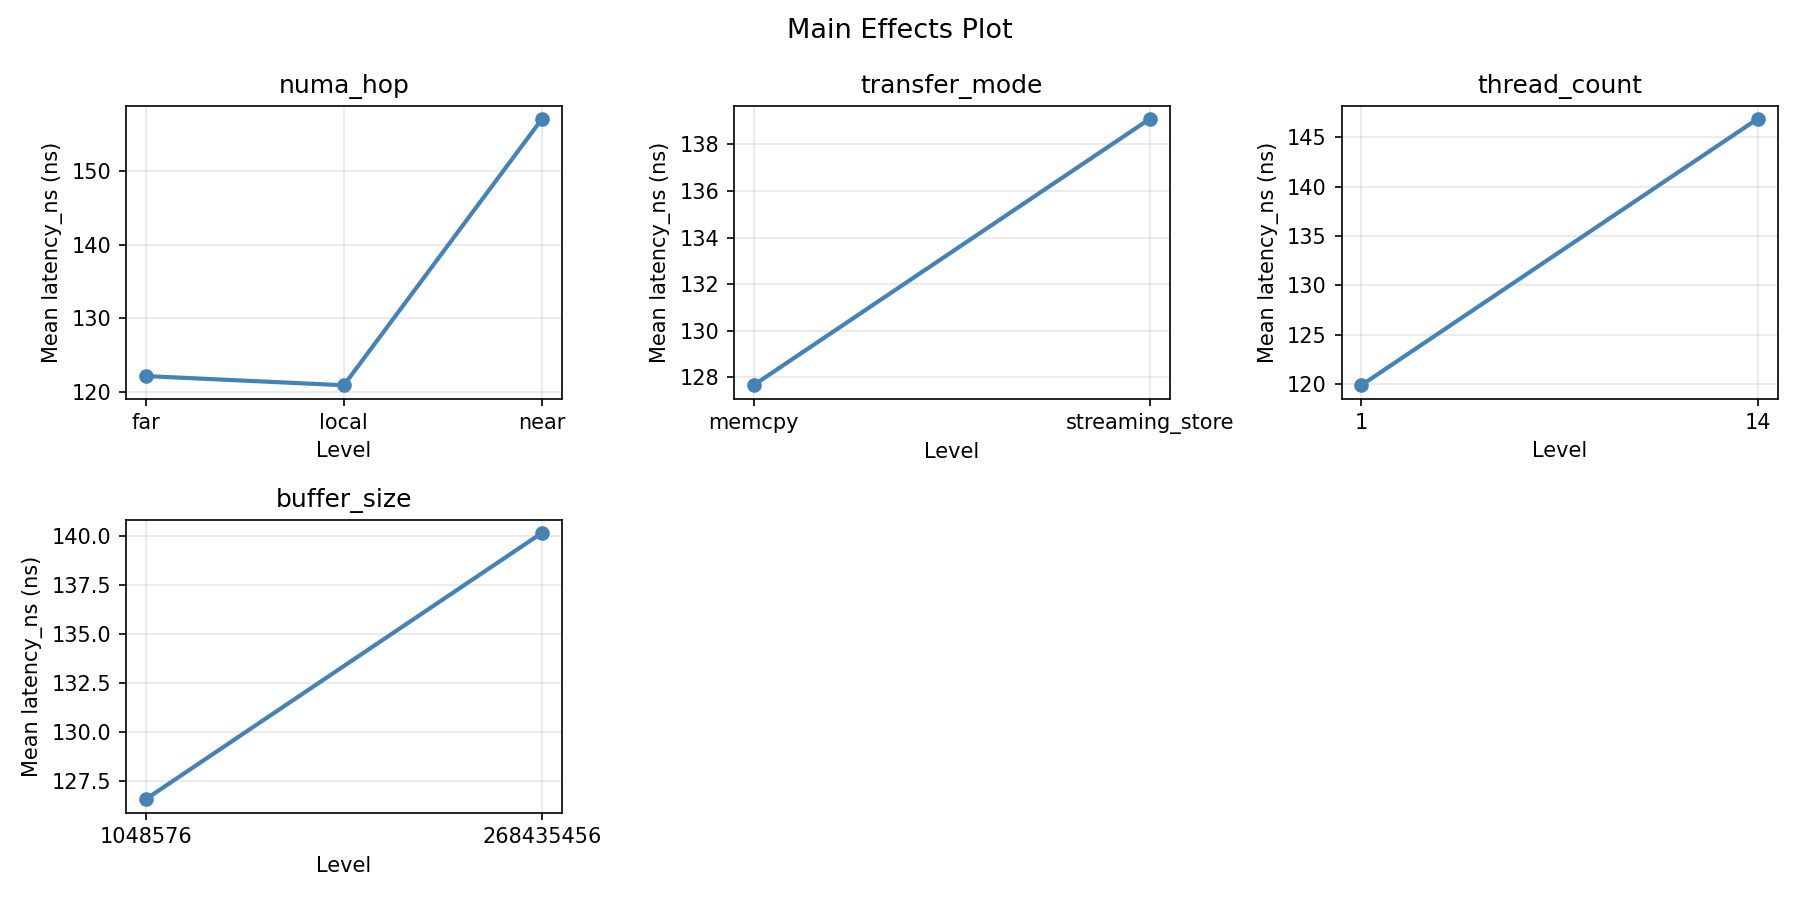
Main Effects Plot
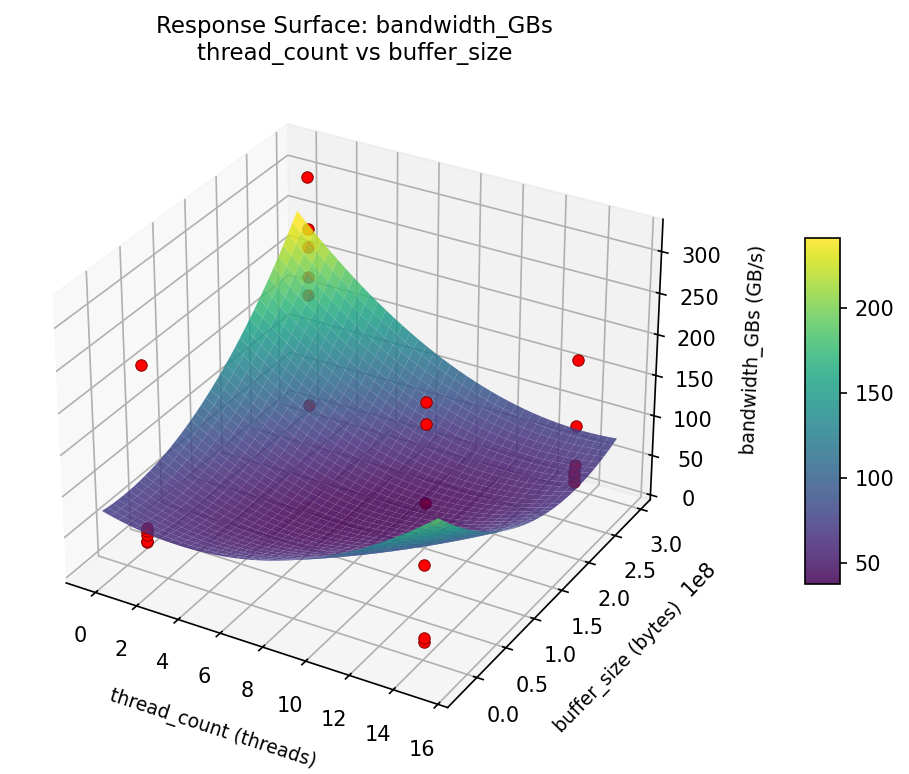
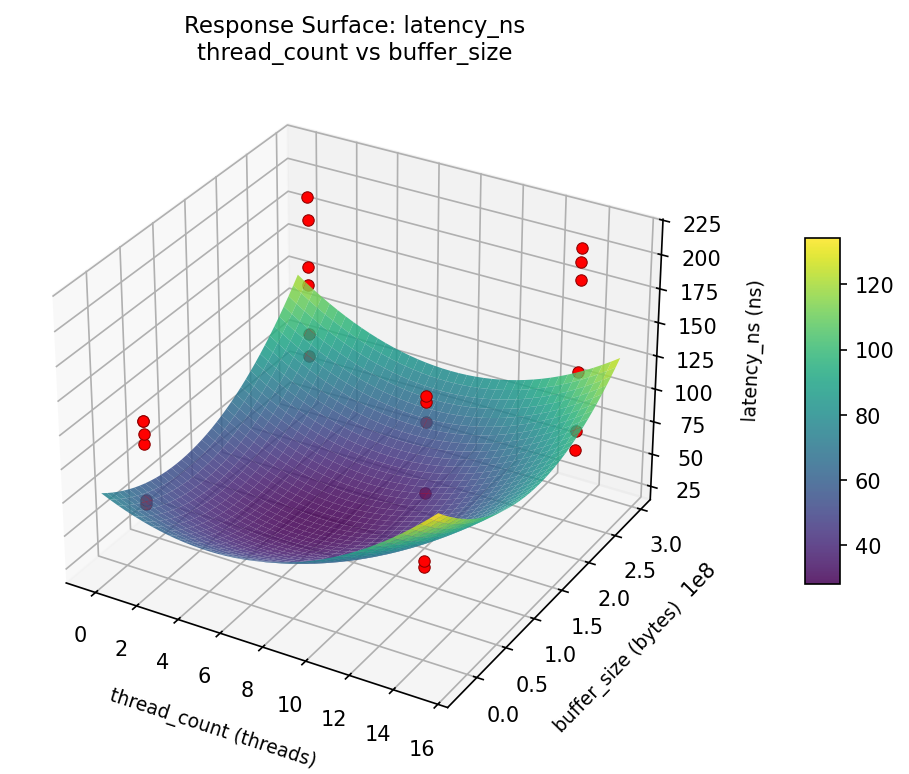
Response Surface Plots
3D surfaces fitted with quadratic RSM. Red dots are observed data points.
bandwidth_GBs: thread_count vs buffer_size
latency_ns: thread_count vs buffer_size
Full Analysis Output
=== Main Effects: bandwidth_GBs ===
Factor Effect Std Error % Contribution
--------------------------------------------------------------
numa_hop 66.7375 20.9093 43.3%
buffer_size -59.2917 20.9093 38.5%
thread_count -16.8250 20.9093 10.9%
transfer_mode 11.2250 20.9093 7.3%
=== Interaction Effects: bandwidth_GBs ===
Factor A Factor B Interaction % Contribution
------------------------------------------------------------------------
transfer_mode buffer_size 53.1583 67.9%
transfer_mode thread_count 13.2583 16.9%
thread_count buffer_size 11.9083 15.2%
=== Summary Statistics: bandwidth_GBs ===
numa_hop:
Level N Mean Std Min Max
------------------------------------------------------------
far 8 162.7625 94.4747 19.8000 297.6000
local 8 112.4250 110.3910 15.8000 316.2000
near 8 96.0250 102.9568 30.8000 271.9000
transfer_mode:
Level N Mean Std Min Max
------------------------------------------------------------
memcpy 12 118.1250 111.6678 15.8000 316.2000
streaming_store 12 129.3500 96.9587 19.8000 297.6000
thread_count:
Level N Mean Std Min Max
------------------------------------------------------------
1 12 132.1500 97.0430 29.9000 316.2000
14 12 115.3250 111.2100 15.8000 297.6000
buffer_size:
Level N Mean Std Min Max
------------------------------------------------------------
1048576 12 153.3833 112.8749 15.8000 316.2000
268435456 12 94.0917 85.3295 29.7000 297.6000
=== Main Effects: latency_ns ===
Factor Effect Std Error % Contribution
--------------------------------------------------------------
numa_hop 58.3750 10.4980 78.9%
buffer_size 8.4917 10.4980 11.5%
thread_count -3.8250 10.4980 5.2%
transfer_mode -3.2750 10.4980 4.4%
=== Interaction Effects: latency_ns ===
Factor A Factor B Interaction % Contribution
------------------------------------------------------------------------
transfer_mode thread_count -12.8250 40.2%
thread_count buffer_size -10.3917 32.6%
transfer_mode buffer_size 8.6583 27.2%
=== Summary Statistics: latency_ns ===
numa_hop:
Level N Mean Std Min Max
------------------------------------------------------------
far 8 158.7500 42.0005 83.0000 202.0000
local 8 141.0125 57.9953 68.6000 212.3000
near 8 100.3750 38.9371 61.5000 180.2000
transfer_mode:
Level N Mean Std Min Max
------------------------------------------------------------
memcpy 12 135.0167 47.3819 65.8000 200.5000
streaming_store 12 131.7417 57.2674 61.5000 212.3000
thread_count:
Level N Mean Std Min Max
------------------------------------------------------------
1 12 135.2917 53.3590 65.8000 212.3000
14 12 131.4667 51.7232 61.5000 205.1000
buffer_size:
Level N Mean Std Min Max
------------------------------------------------------------
1048576 12 129.1333 52.7718 61.5000 202.0000
268435456 12 137.6250 52.0217 65.8000 212.3000
Optimization Recommendations
=== Optimization: bandwidth_GBs ===
Direction: maximize
Best observed run: #14
numa_hop = local
transfer_mode = memcpy
thread_count = 14
buffer_size = 268435456
Value: 316.2
RSM Model (linear, R² = 0.0488, Adj R² = -0.1514):
Coefficients:
intercept: +123.7375
numa_hop: -13.7938
transfer_mode: +9.9542
thread_count: -7.8542
buffer_size: +14.2625
Predicted optimum:
numa_hop = far
transfer_mode = streaming_store
thread_count = 1
buffer_size = 268435456
Predicted value: 169.6021
Factor importance:
1. buffer_size (effect: 28.5, contribution: 31.1%)
2. numa_hop (effect: 27.6, contribution: 30.1%)
3. transfer_mode (effect: 19.9, contribution: 21.7%)
4. thread_count (effect: -15.7, contribution: 17.1%)
=== Optimization: latency_ns ===
Direction: minimize
Best observed run: #18
numa_hop = near
transfer_mode = streaming_store
thread_count = 1
buffer_size = 1048576
Value: 61.5
RSM Model (linear, R² = 0.2038, Adj R² = 0.0362):
Coefficients:
intercept: +133.3792
numa_hop: -25.4563
transfer_mode: +1.2792
thread_count: -0.8292
buffer_size: -9.0708
Predicted optimum:
numa_hop = far
transfer_mode = streaming_store
thread_count = 1
buffer_size = 1048576
Predicted value: 170.0146
Factor importance:
1. numa_hop (effect: 50.9, contribution: 69.5%)
2. buffer_size (effect: -18.1, contribution: 24.8%)
3. transfer_mode (effect: 2.6, contribution: 3.5%)
4. thread_count (effect: -1.7, contribution: 2.3%)
Multi-Objective Optimization
When responses compete, Derringer–Suich desirability finds the best compromise.
Each response is scaled to a 0–1 desirability, then combined via a weighted geometric mean.
Overall Desirability
D = 0.9204
Per-Response Desirability
| Response | Weight | Desirability | Predicted | Dir |
|---|
bandwidth_GBs |
1.5 |
|
316.20 0.9545 316.20 GB/s |
↑ |
latency_ns |
1.0 |
|
75.30 0.8714 75.30 ns |
↓ |
Recommended Settings
| Factor | Value |
|---|
numa_hop | local |
transfer_mode | memcpy |
thread_count | 14 threads |
buffer_size | 268435456 bytes |
Source: from observed run #14
Trade-off Summary
Sacrifice = how much worse than single-objective best.
| Response | Predicted | Best Observed | Sacrifice |
|---|
latency_ns | 75.30 | 61.50 | +13.80 |
Top 3 Runs by Desirability
| Run | D | Factor Settings |
|---|
| #20 | 0.8682 | numa_hop=far, transfer_mode=memcpy, thread_count=14, buffer_size=1048576 |
| #16 | 0.8108 | numa_hop=near, transfer_mode=memcpy, thread_count=14, buffer_size=1048576 |
Model Quality
| Response | R² | Type |
|---|
latency_ns | 0.2229 | linear |
Full Multi-Objective Output
============================================================
MULTI-OBJECTIVE OPTIMIZATION
Method: Derringer-Suich Desirability Function
============================================================
Overall desirability: D = 0.9204
Response Weight Desirability Predicted Direction
---------------------------------------------------------------------
bandwidth_GBs 1.5 0.9545 316.20 GB/s ↑
latency_ns 1.0 0.8714 75.30 ns ↓
Recommended settings:
numa_hop = local
transfer_mode = memcpy
thread_count = 14 threads
buffer_size = 268435456 bytes
(from observed run #14)
Trade-off summary:
bandwidth_GBs: 316.20 (best observed: 316.20, sacrifice: +0.00)
latency_ns: 75.30 (best observed: 61.50, sacrifice: +13.80)
Model quality:
bandwidth_GBs: R² = 0.3167 (linear)
latency_ns: R² = 0.2229 (linear)
Top 3 observed runs by overall desirability:
1. Run #14 (D=0.9204): numa_hop=local, transfer_mode=memcpy, thread_count=14, buffer_size=268435456
2. Run #20 (D=0.8682): numa_hop=far, transfer_mode=memcpy, thread_count=14, buffer_size=1048576
3. Run #16 (D=0.8108): numa_hop=near, transfer_mode=memcpy, thread_count=14, buffer_size=1048576