Summary
This experiment investigates serverless cold start. Plackett-Burman screening of 6 Lambda config knobs affecting cold start latency and cost.
The design varies 6 factors: memory mb (MB), ranging from 128 to 1024, runtime, ranging from python to go, package mb (MB), ranging from 5 to 50, vpc enabled, ranging from no to yes, layers count (count), ranging from 0 to 5, and provisioned (count), ranging from 0 to 10. The goal is to optimize 2 responses: cold start ms (ms) (minimize) and cost per million (USD) (minimize). Fixed conditions held constant across all runs include region = us-east-1, trigger = api-gateway.
A Plackett-Burman screening design was used to efficiently test 6 factors in only 8 runs. This design assumes interactions are negligible and focuses on identifying the most influential main effects.
Key Findings
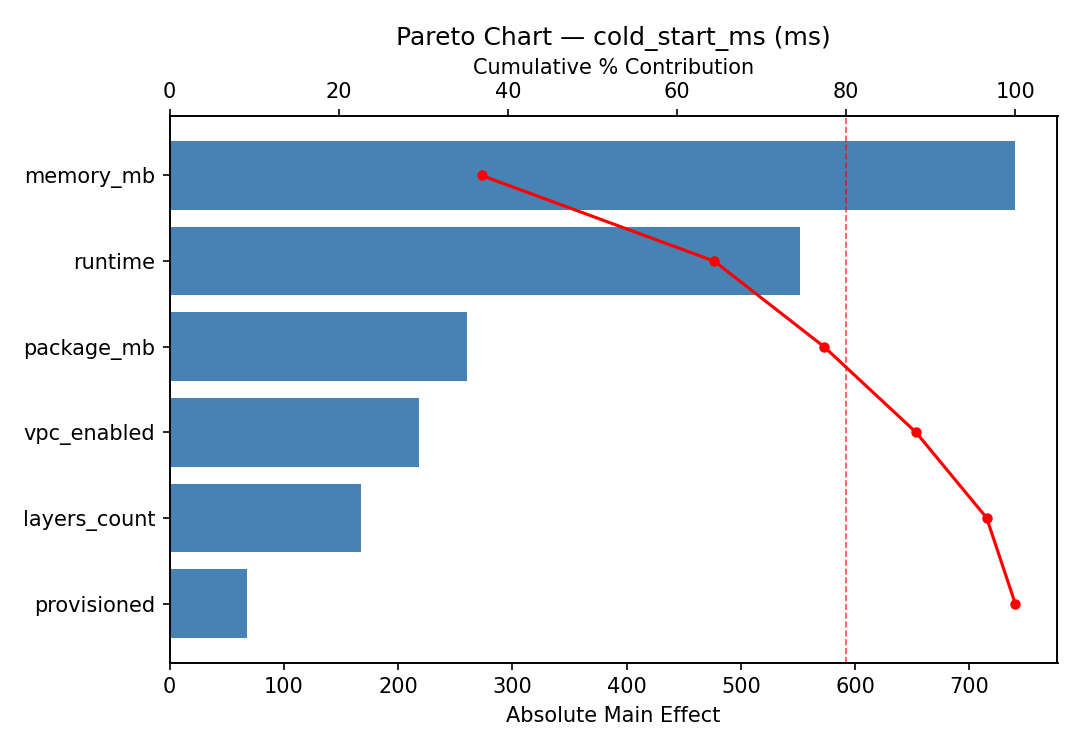
For cold start ms, the most influential factors were memory mb (34.8%), package mb (25.4%), vpc enabled (18.6%). The best observed value was -31.0 (at memory mb = 1024, runtime = go, package mb = 50).
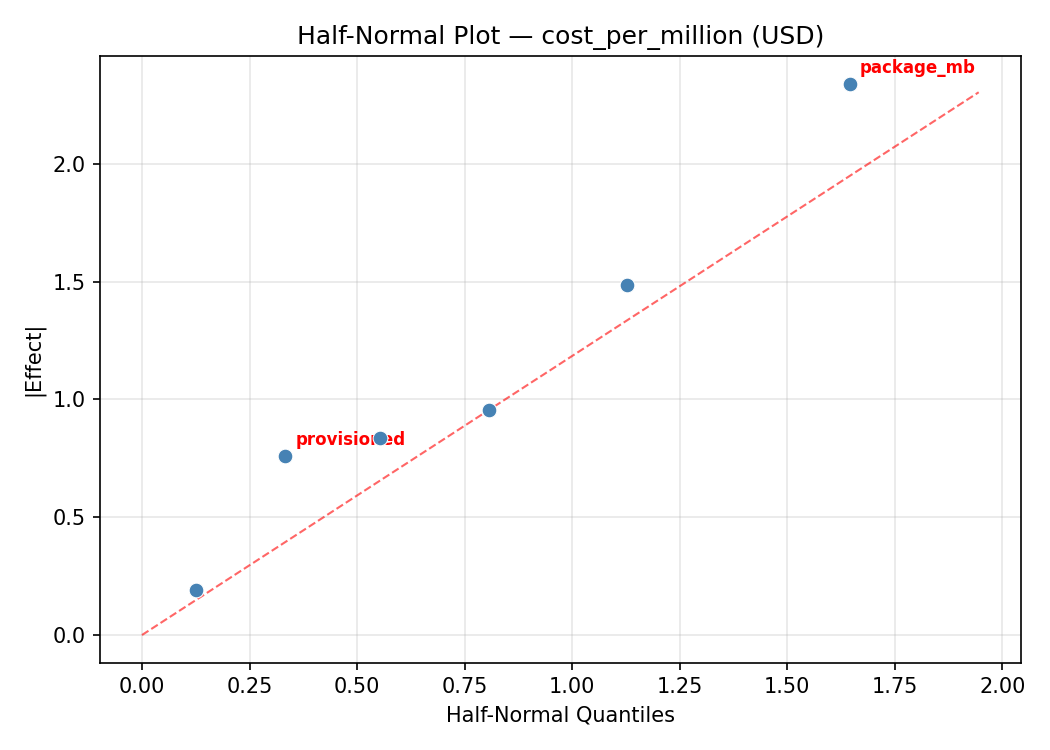
For cost per million, the most influential factors were memory mb (48.2%), runtime (19.6%), package mb (11.9%). The best observed value was 0.12 (at memory mb = 128, runtime = go, package mb = 5).
Recommended Next Steps
- Follow up with a response surface design (CCD or Box-Behnken) on the top 3–4 factors to model curvature and find the true optimum.
- Consider whether any fixed factors should be varied in a future study.
- The screening results can guide factor reduction — drop factors contributing less than 5% and re-run with a smaller, more focused design.
Experimental Setup
Factors
| Factor | Low | High | Unit |
|---|
memory_mb | 128 | 1024 | MB |
runtime | python | go | |
package_mb | 5 | 50 | MB |
vpc_enabled | no | yes | |
layers_count | 0 | 5 | count |
provisioned | 0 | 10 | count |
Fixed: region = us-east-1, trigger = api-gateway
Responses
| Response | Direction | Unit |
|---|
cold_start_ms | ↓ minimize | ms |
cost_per_million | ↓ minimize | USD |
Configuration
{
"metadata": {
"name": "Serverless Cold Start",
"description": "Plackett-Burman screening of 6 Lambda config knobs affecting cold start latency and cost"
},
"factors": [
{
"name": "memory_mb",
"levels": [
"128",
"1024"
],
"type": "continuous",
"unit": "MB"
},
{
"name": "runtime",
"levels": [
"python",
"go"
],
"type": "categorical",
"unit": ""
},
{
"name": "package_mb",
"levels": [
"5",
"50"
],
"type": "continuous",
"unit": "MB"
},
{
"name": "vpc_enabled",
"levels": [
"no",
"yes"
],
"type": "categorical",
"unit": ""
},
{
"name": "layers_count",
"levels": [
"0",
"5"
],
"type": "continuous",
"unit": "count"
},
{
"name": "provisioned",
"levels": [
"0",
"10"
],
"type": "continuous",
"unit": "count"
}
],
"fixed_factors": {
"region": "us-east-1",
"trigger": "api-gateway"
},
"responses": [
{
"name": "cold_start_ms",
"optimize": "minimize",
"unit": "ms"
},
{
"name": "cost_per_million",
"optimize": "minimize",
"unit": "USD"
}
],
"settings": {
"operation": "plackett_burman",
"test_script": "use_cases/30_serverless_cold_start/sim.sh"
}
}
Experimental Matrix
The Plackett-Burman Design produces 8 runs. Each row is one experiment with specific factor settings.
| Run | memory_mb | runtime | package_mb | vpc_enabled | layers_count | provisioned |
|---|
| 1 | 1024 | go | 50 | no | 0 | 0 |
| 2 | 128 | python | 50 | yes | 0 | 0 |
| 3 | 128 | go | 5 | yes | 0 | 10 |
| 4 | 1024 | go | 50 | yes | 5 | 10 |
| 5 | 128 | go | 5 | no | 5 | 0 |
| 6 | 1024 | python | 5 | yes | 5 | 0 |
| 7 | 128 | python | 50 | no | 5 | 10 |
| 8 | 1024 | python | 5 | no | 0 | 10 |
Step-by-Step Workflow
1
Preview the design
$ doe info --config use_cases/30_serverless_cold_start/config.json
2
Generate the runner script
$ doe generate --config use_cases/30_serverless_cold_start/config.json \
--output use_cases/30_serverless_cold_start/results/run.sh --seed 42
3
Execute the experiments
$ bash use_cases/30_serverless_cold_start/results/run.sh
4
Analyze results
$ doe analyze --config use_cases/30_serverless_cold_start/config.json
5
Get optimization recommendations
$ doe optimize --config use_cases/30_serverless_cold_start/config.json
6
Multi-objective optimization
With 2 competing responses, use --multi to find the best compromise via Derringer–Suich desirability.
$ doe optimize --config use_cases/30_serverless_cold_start/config.json --multi
7
Generate the HTML report
$ doe report --config use_cases/30_serverless_cold_start/config.json \
--output use_cases/30_serverless_cold_start/results/report.html
Features Exercised
| Feature | Value |
|---|
| Design type | plackett_burman |
| Factor types | continuous (4), categorical (2) |
| Arg style | double-dash |
| Responses | 2 (cold_start_ms ↓, cost_per_million ↓) |
| Total runs | 8 |
Analysis Results
Generated from actual experiment runs using the DOE Helper Tool.
Response: cold_start_ms
Top factors: memory_mb (34.8%), package_mb (25.4%), vpc_enabled (18.6%).
ANOVA
| Source | DF | SS | MS | F | p-value |
|---|
| Source | DF | SS | MS | F | p-value |
| memory_mb | 1 | 1095940.1250 | 1095940.1250 | 12.530 | 0.0095 |
| runtime | 1 | 148240.1250 | 148240.1250 | 1.695 | 0.2342 |
| package_mb | 1 | 583740.1250 | 583740.1250 | 6.674 | 0.0363 |
| vpc_enabled | 1 | 311655.1250 | 311655.1250 | 3.563 | 0.1010 |
| layers_count | 1 | 153.1250 | 153.1250 | 0.002 | 0.9678 |
| provisioned | 1 | 58311.1250 | 58311.1250 | 0.667 | 0.4411 |
| memory_mb*runtime | 1 | 583740.1250 | 583740.1250 | 6.674 | 0.0363 |
| memory_mb*package_mb | 1 | 148240.1250 | 148240.1250 | 1.695 | 0.2342 |
| memory_mb*vpc_enabled | 1 | 153.1250 | 153.1250 | 0.002 | 0.9678 |
| memory_mb*layers_count | 1 | 311655.1250 | 311655.1250 | 3.563 | 0.1010 |
| memory_mb*provisioned | 1 | 28920.1250 | 28920.1250 | 0.331 | 0.5833 |
| runtime*package_mb | 1 | 1095940.1250 | 1095940.1250 | 12.530 | 0.0095 |
| runtime*vpc_enabled | 1 | 58311.1250 | 58311.1250 | 0.667 | 0.4411 |
| runtime*layers_count | 1 | 28920.1250 | 28920.1250 | 0.331 | 0.5833 |
| runtime*provisioned | 1 | 311655.1250 | 311655.1250 | 3.563 | 0.1010 |
| package_mb*vpc_enabled | 1 | 28920.1250 | 28920.1250 | 0.331 | 0.5833 |
| package_mb*layers_count | 1 | 58311.1250 | 58311.1250 | 0.667 | 0.4411 |
| package_mb*provisioned | 1 | 153.1250 | 153.1250 | 0.002 | 0.9678 |
| vpc_enabled*layers_count | 1 | 1095940.1250 | 1095940.1250 | 12.530 | 0.0095 |
| vpc_enabled*provisioned | 1 | 148240.1250 | 148240.1250 | 1.695 | 0.2342 |
| layers_count*provisioned | 1 | 583740.1250 | 583740.1250 | 6.674 | 0.0363 |
| Error | (Lenth | PSE) | 7 | 612266.8125 | 87466.6875 |
| Total | 7 | 2226959.8750 | 318137.1250 | | |
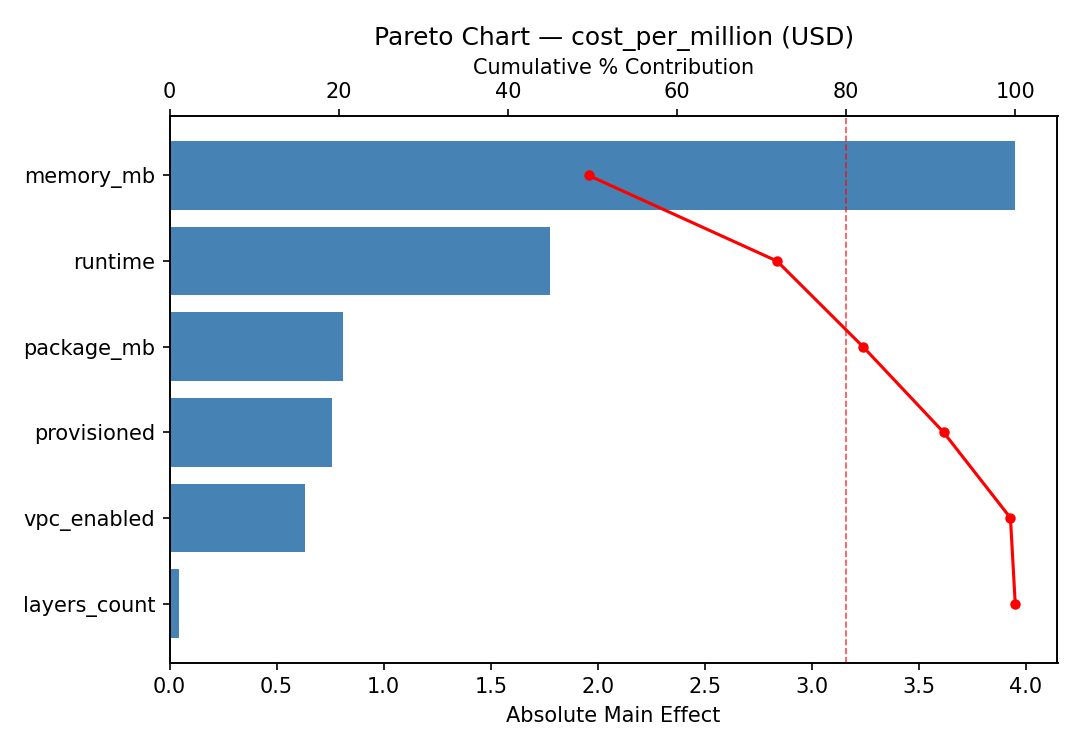
Pareto Chart
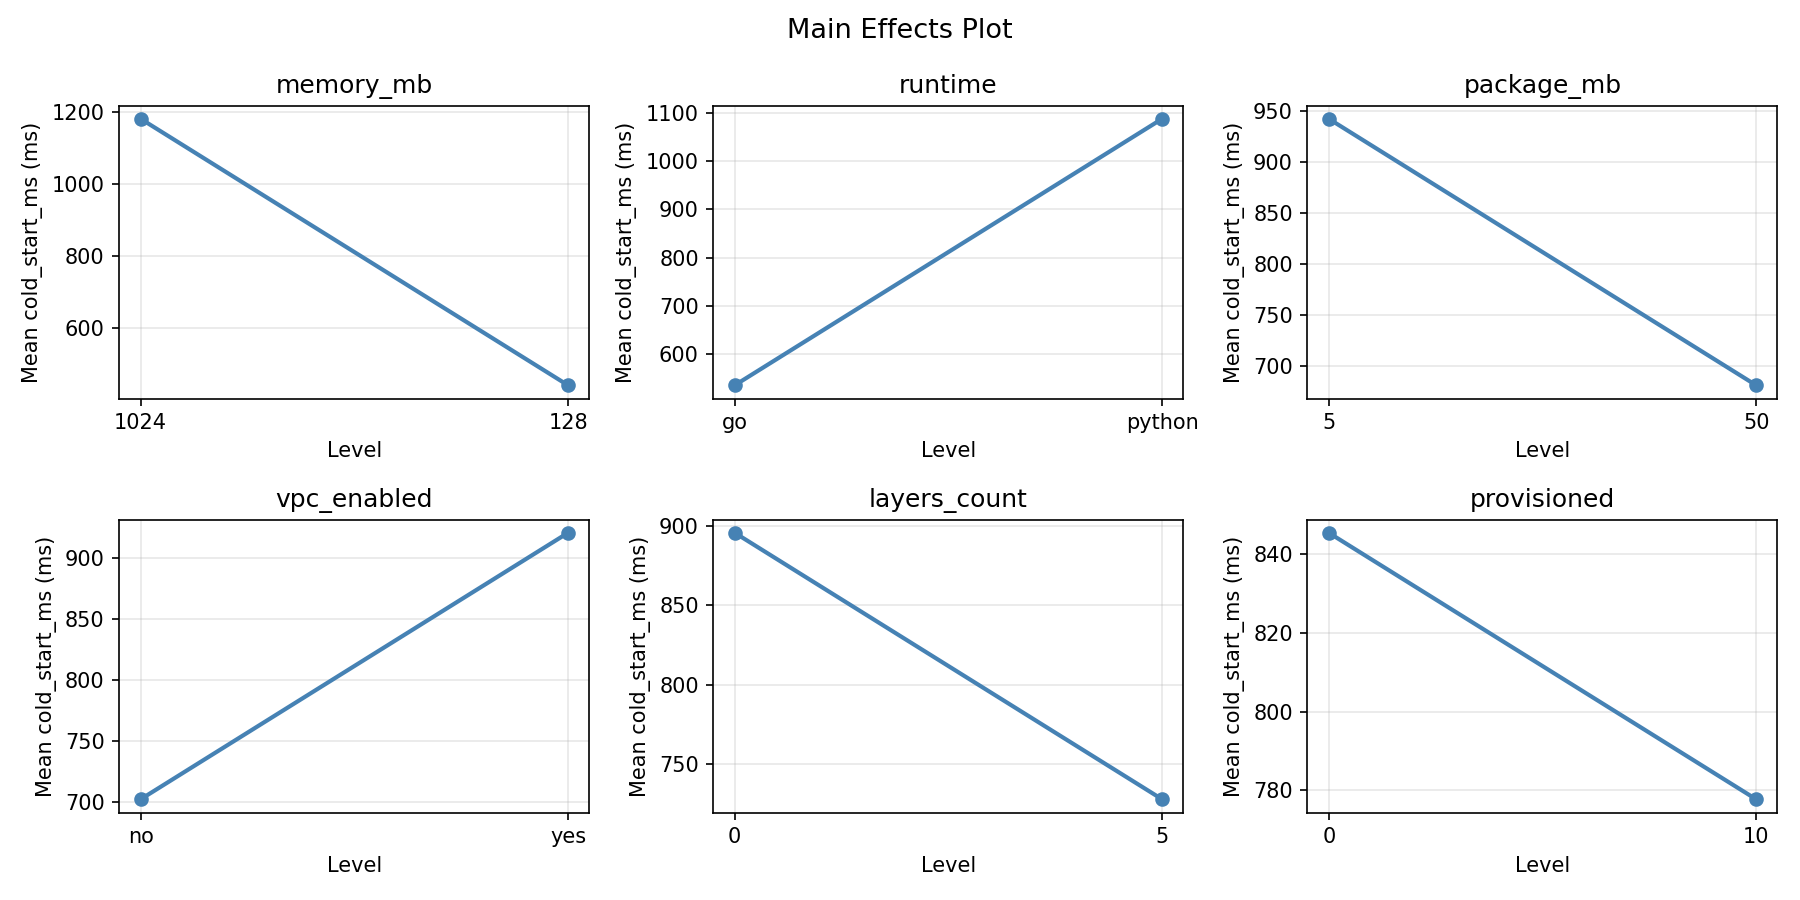
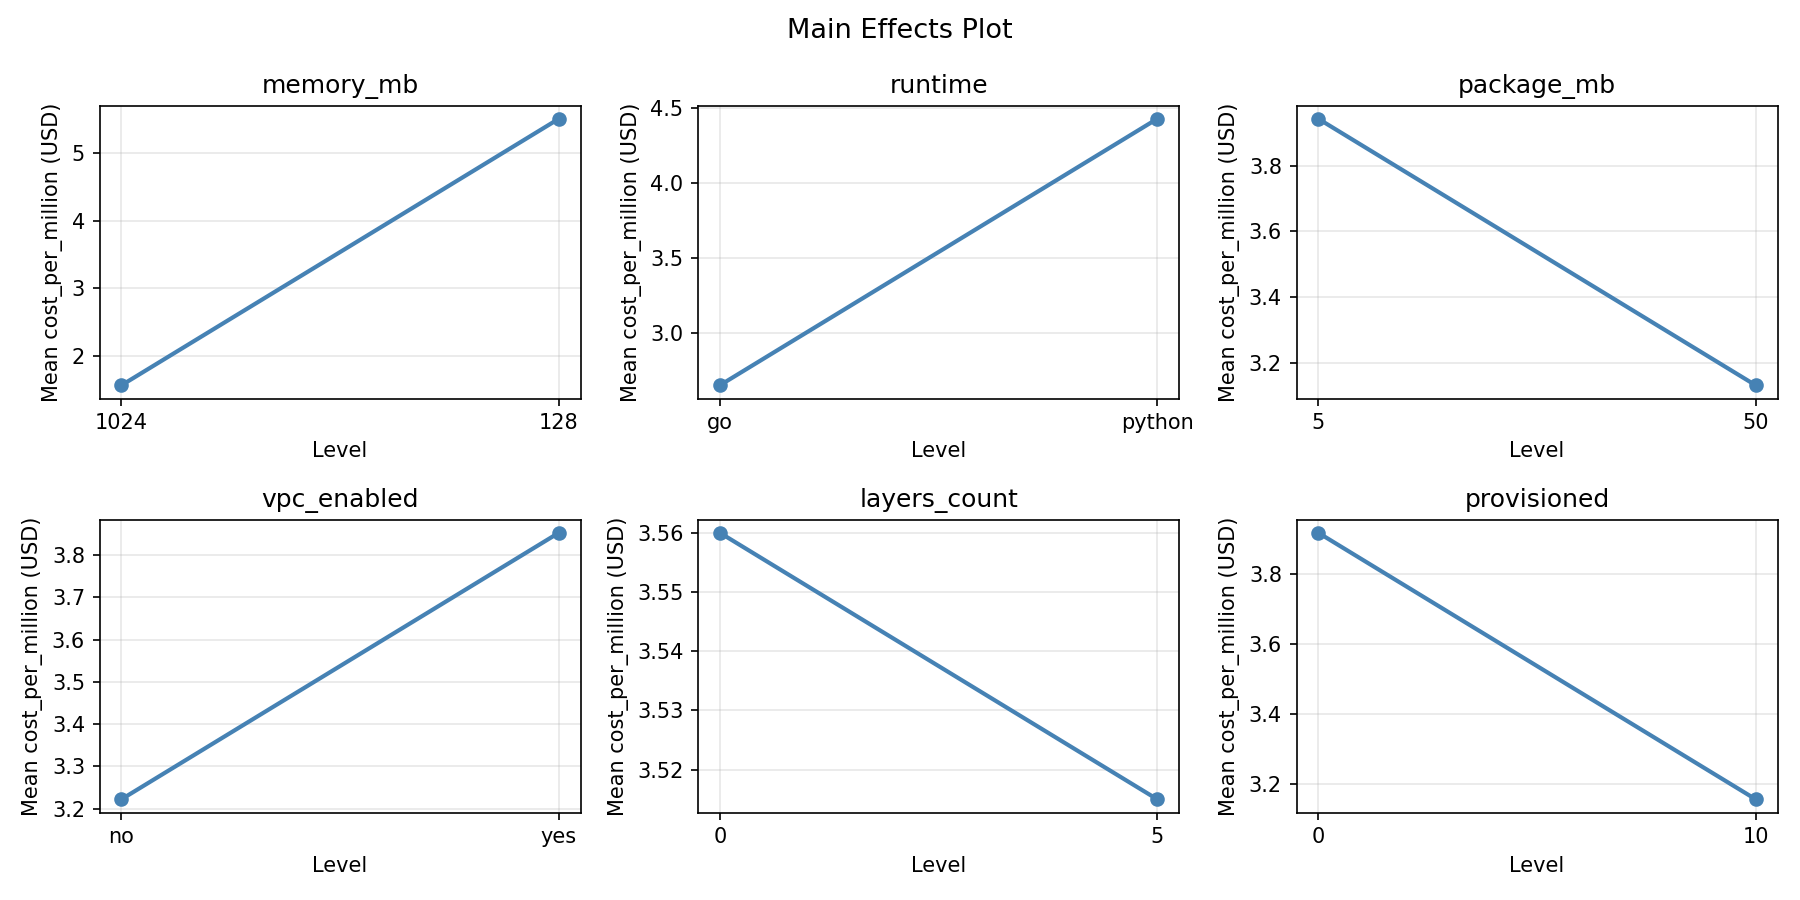
Main Effects Plot
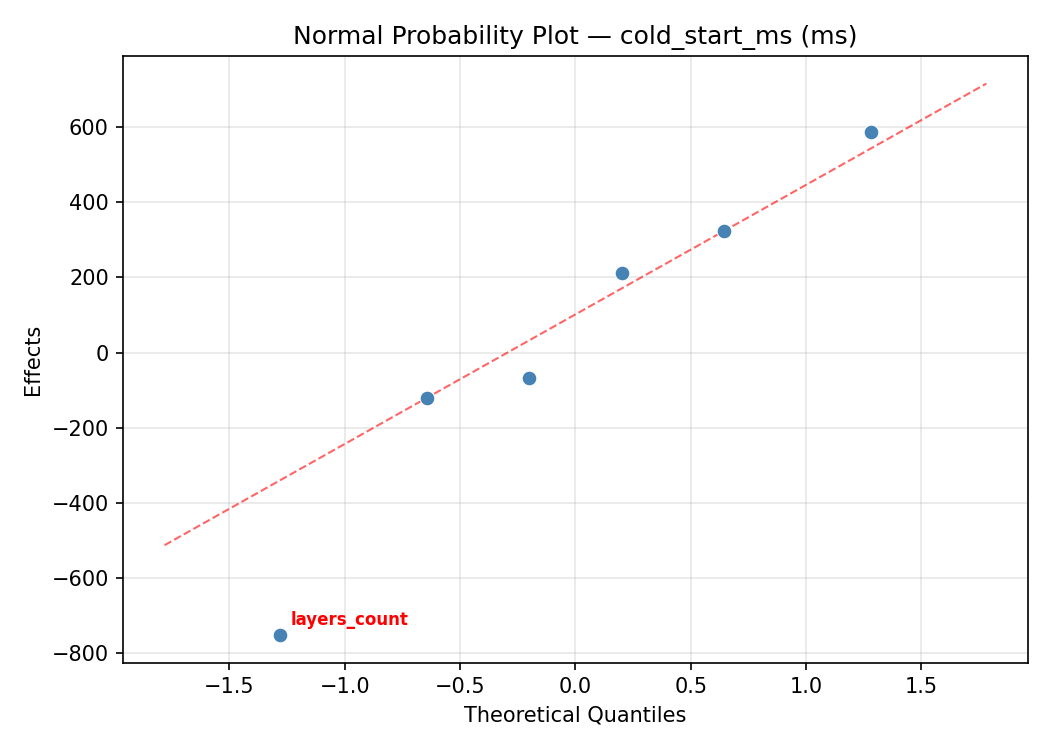
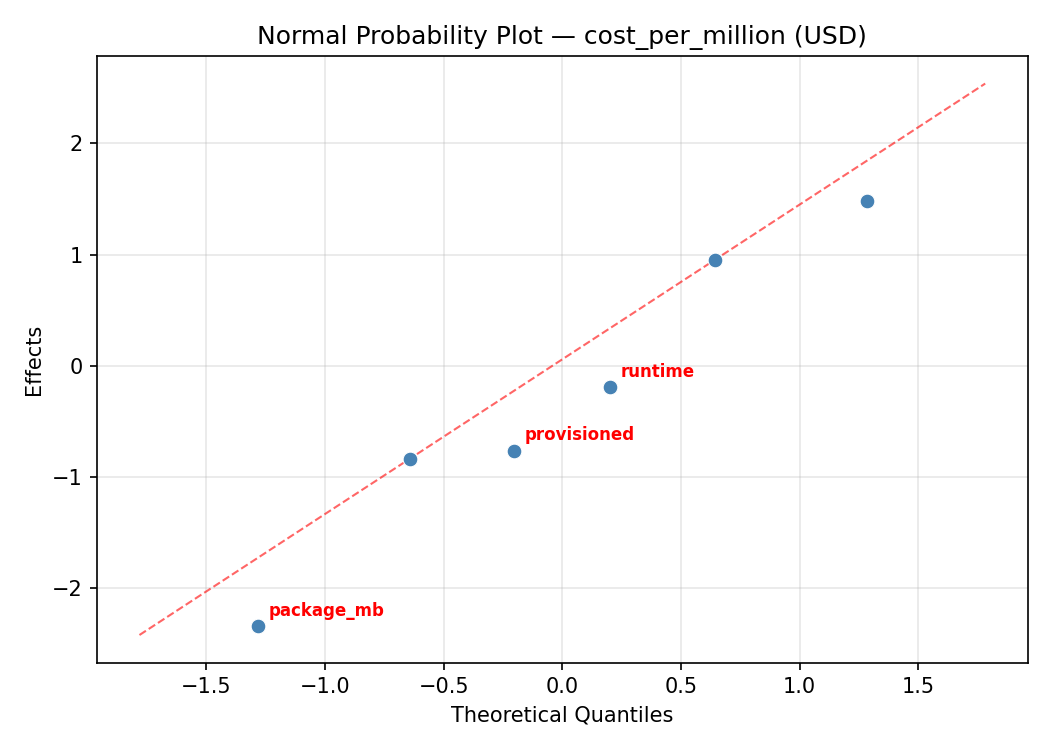
Normal Probability Plot of Effects
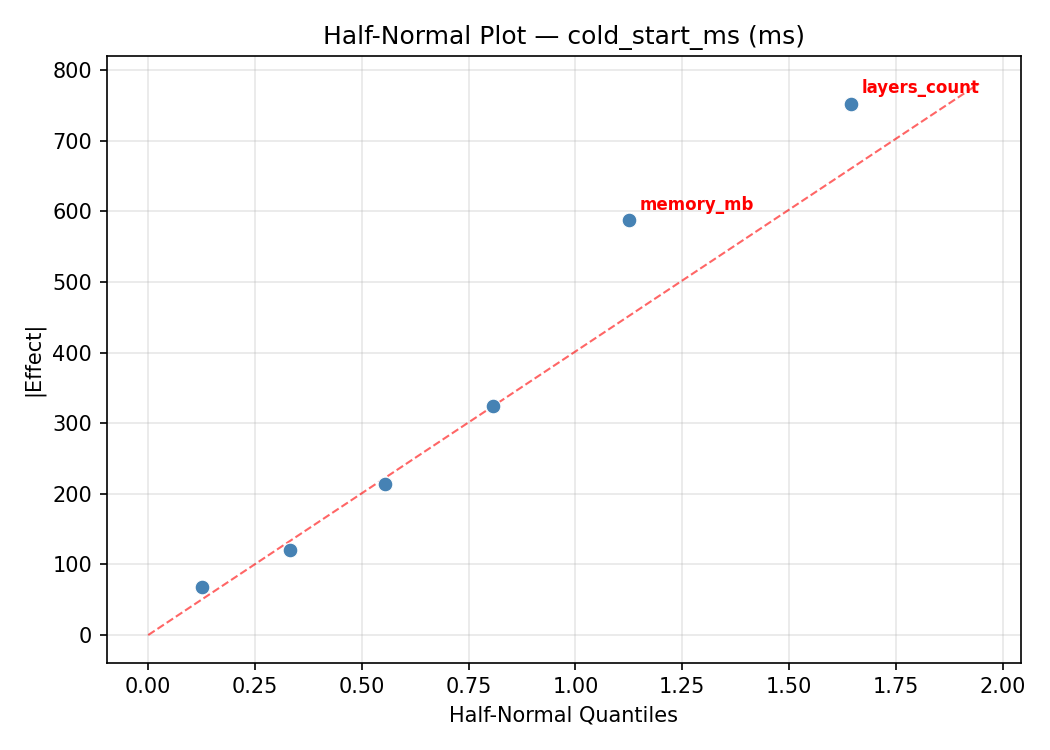
Half-Normal Plot of Effects
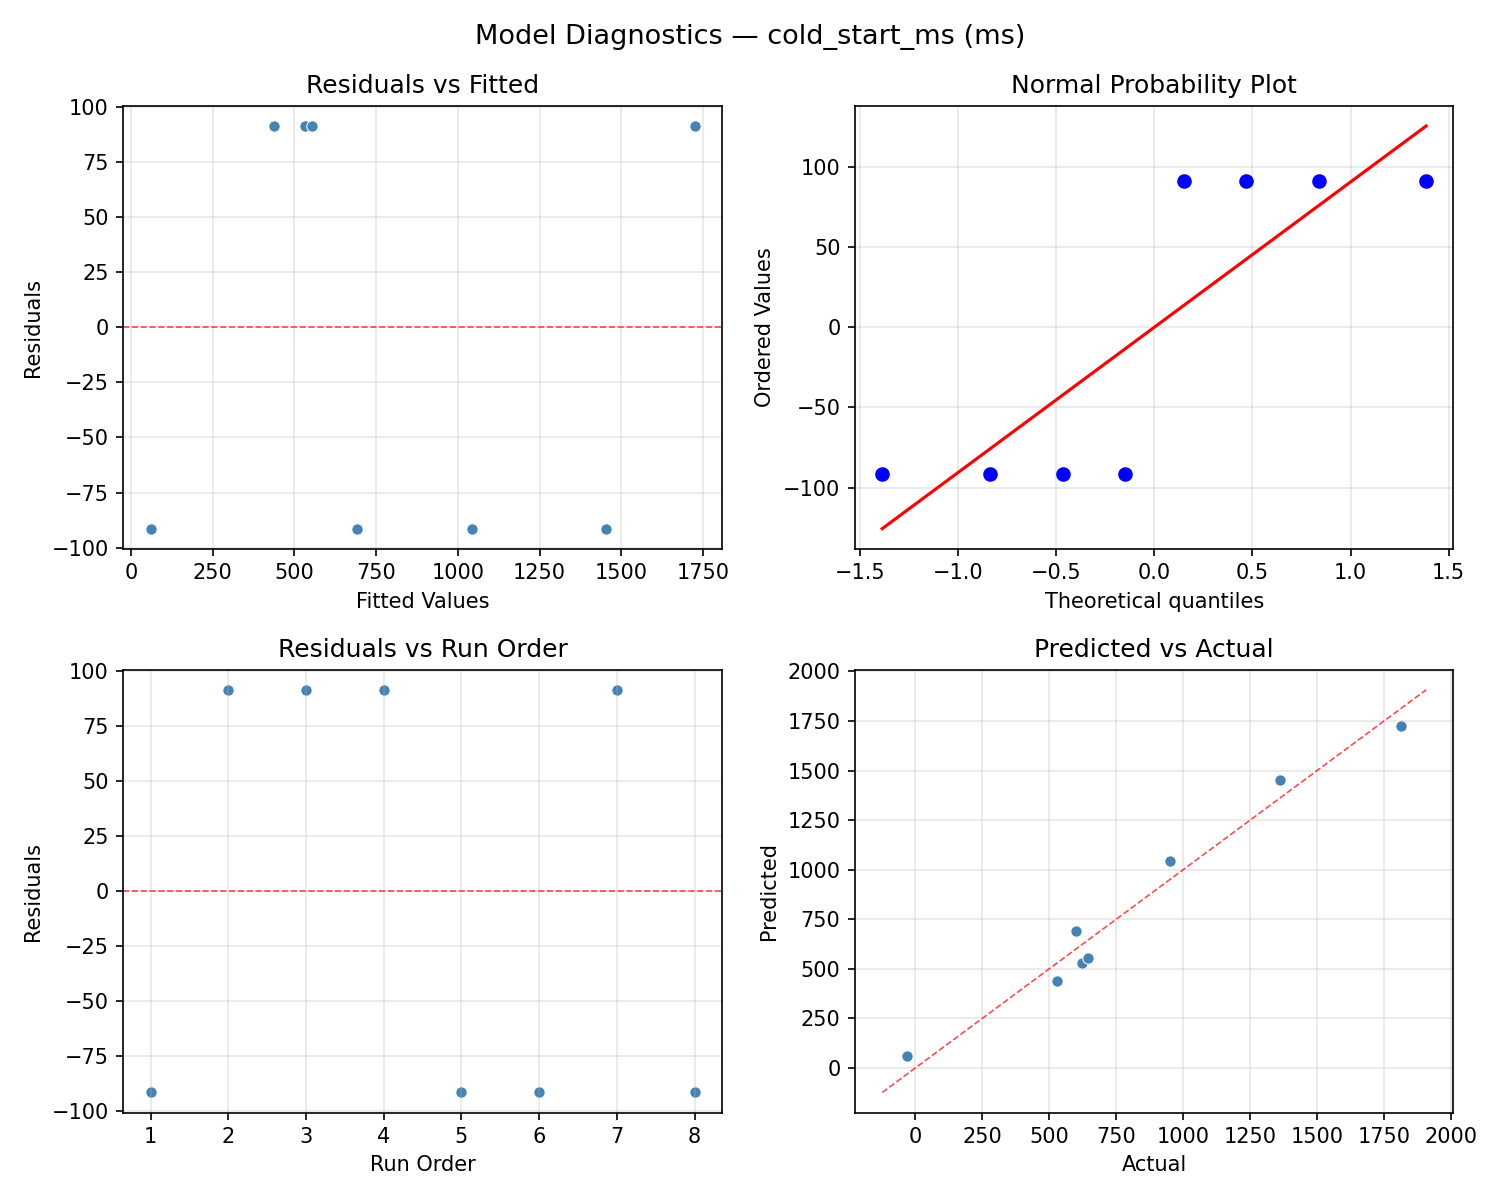
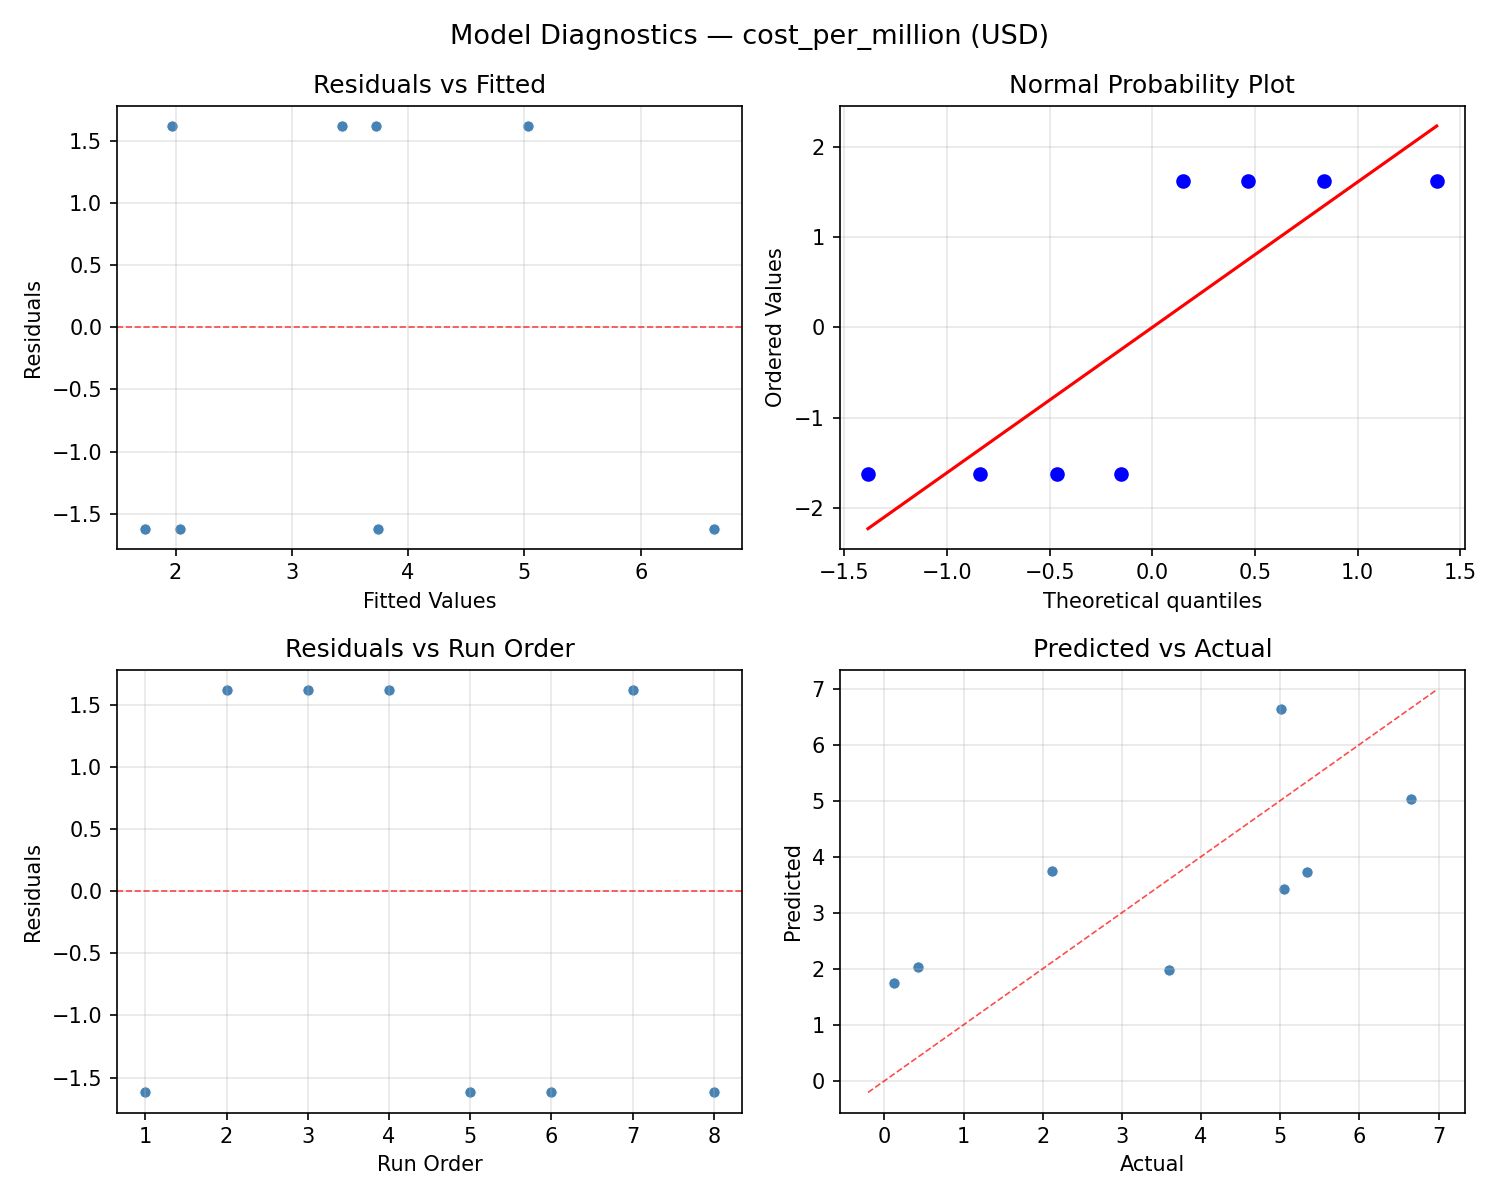
Model Diagnostics
Response: cost_per_million
Top factors: memory_mb (48.2%), runtime (19.6%), package_mb (11.9%).
ANOVA
| Source | DF | SS | MS | F | p-value |
|---|
| Source | DF | SS | MS | F | p-value |
| memory_mb | 1 | 31.2050 | 31.2050 | 17.318 | 0.0042 |
| runtime | 1 | 5.1842 | 5.1842 | 2.877 | 0.1337 |
| package_mb | 1 | 1.9013 | 1.9013 | 1.055 | 0.3385 |
| vpc_enabled | 1 | 1.2168 | 1.2168 | 0.675 | 0.4383 |
| layers_count | 1 | 0.0220 | 0.0220 | 0.012 | 0.9150 |
| provisioned | 1 | 1.2012 | 1.2012 | 0.667 | 0.4411 |
| memory_mb*runtime | 1 | 1.9013 | 1.9013 | 1.055 | 0.3385 |
| memory_mb*package_mb | 1 | 5.1842 | 5.1842 | 2.877 | 0.1337 |
| memory_mb*vpc_enabled | 1 | 0.0220 | 0.0220 | 0.012 | 0.9150 |
| memory_mb*layers_count | 1 | 1.2168 | 1.2168 | 0.675 | 0.4383 |
| memory_mb*provisioned | 1 | 0.0722 | 0.0722 | 0.040 | 0.8470 |
| runtime*package_mb | 1 | 31.2050 | 31.2050 | 17.318 | 0.0042 |
| runtime*vpc_enabled | 1 | 1.2012 | 1.2012 | 0.667 | 0.4411 |
| runtime*layers_count | 1 | 0.0722 | 0.0722 | 0.040 | 0.8470 |
| runtime*provisioned | 1 | 1.2168 | 1.2168 | 0.675 | 0.4383 |
| package_mb*vpc_enabled | 1 | 0.0722 | 0.0722 | 0.040 | 0.8470 |
| package_mb*layers_count | 1 | 1.2012 | 1.2012 | 0.667 | 0.4411 |
| package_mb*provisioned | 1 | 0.0220 | 0.0220 | 0.012 | 0.9150 |
| vpc_enabled*layers_count | 1 | 31.2050 | 31.2050 | 17.318 | 0.0042 |
| vpc_enabled*provisioned | 1 | 5.1842 | 5.1842 | 2.877 | 0.1337 |
| layers_count*provisioned | 1 | 1.9013 | 1.9013 | 1.055 | 0.3385 |
| Error | (Lenth | PSE) | 7 | 12.6131 | 1.8019 |
| Total | 7 | 40.8028 | 5.8290 | | |
Pareto Chart
Main Effects Plot
Normal Probability Plot of Effects
Half-Normal Plot of Effects
Model Diagnostics
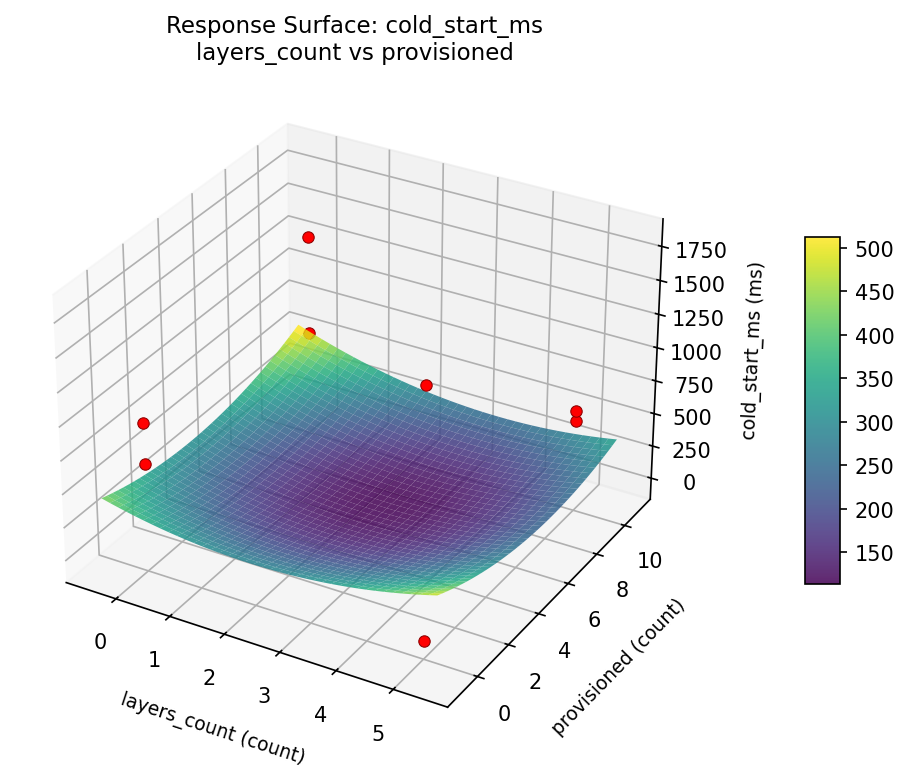
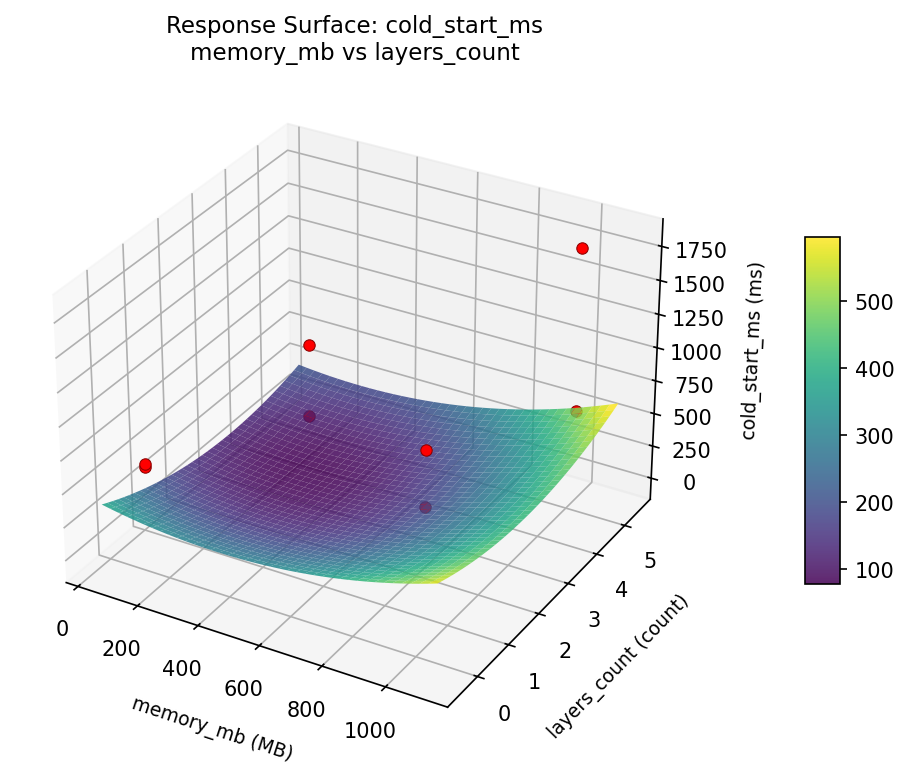
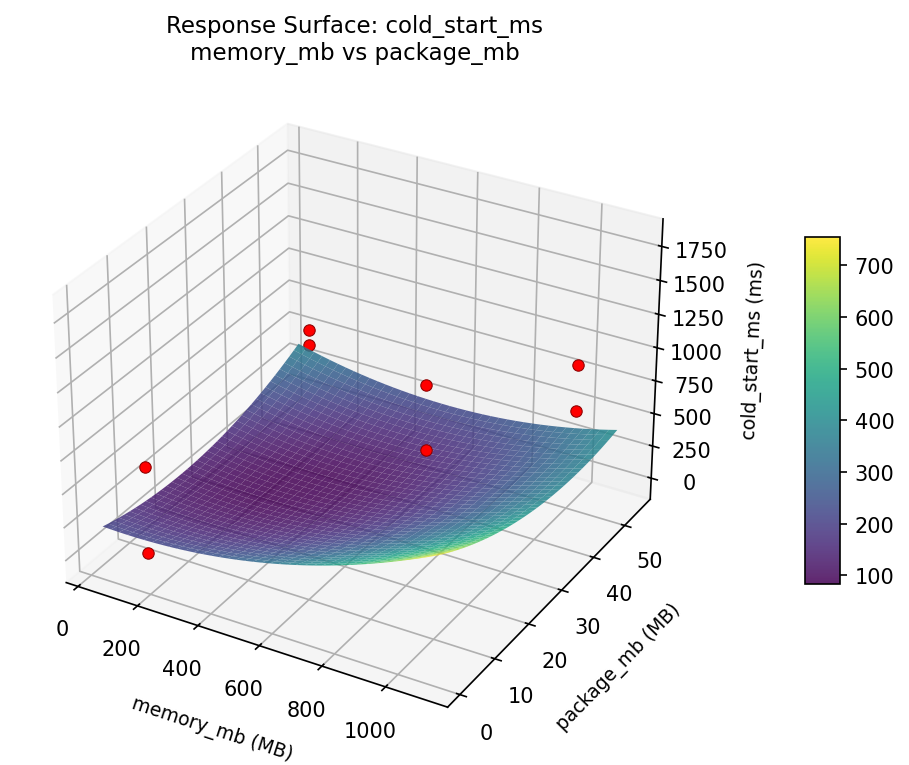
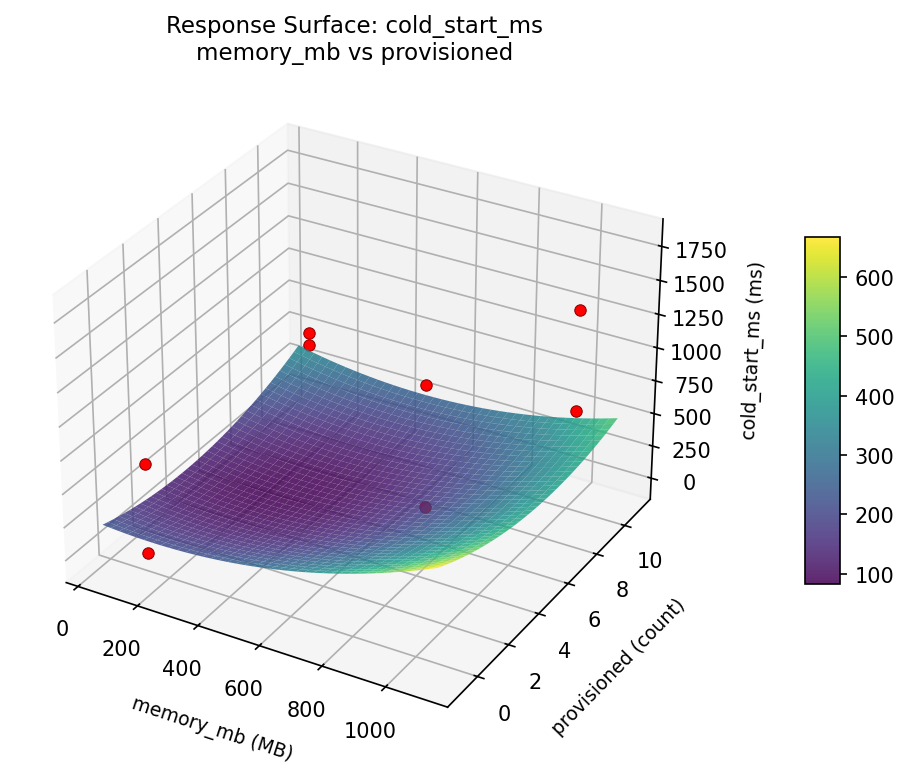
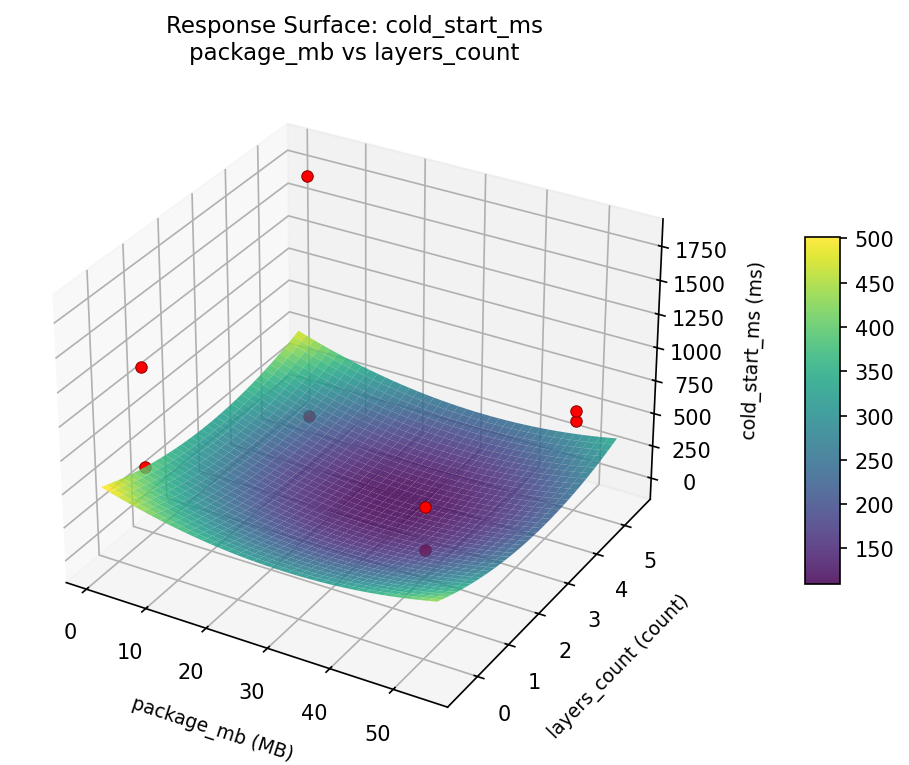
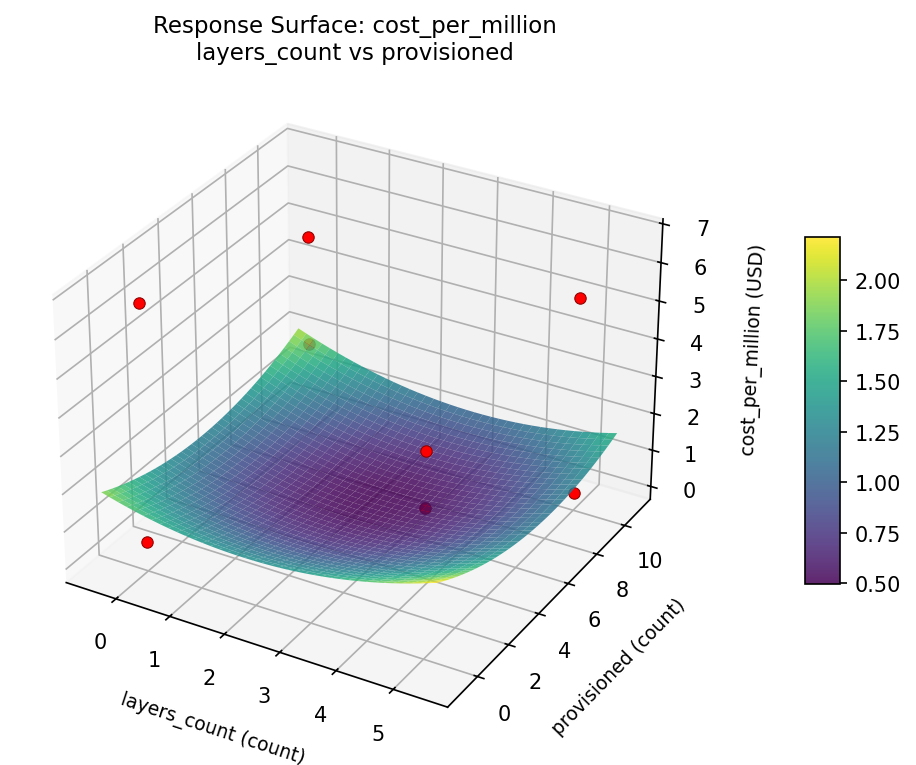
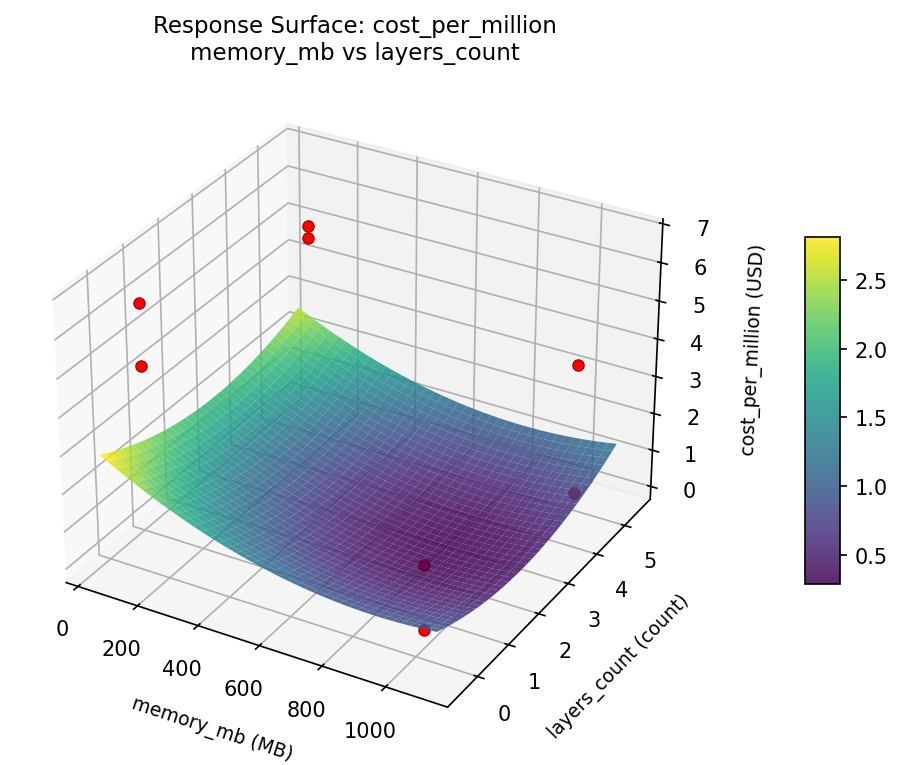
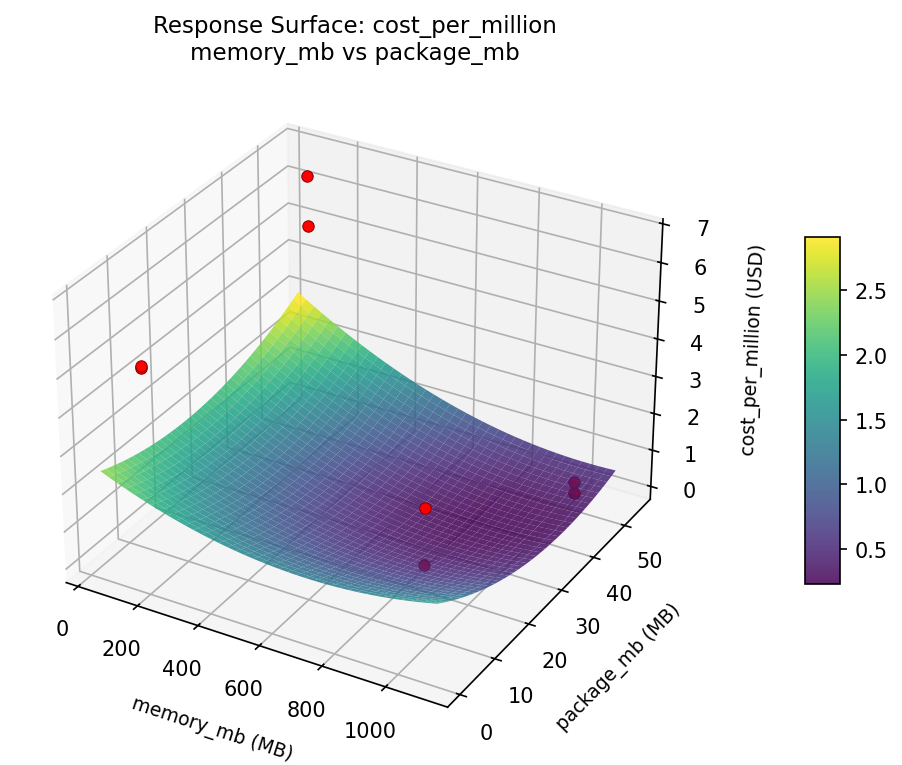
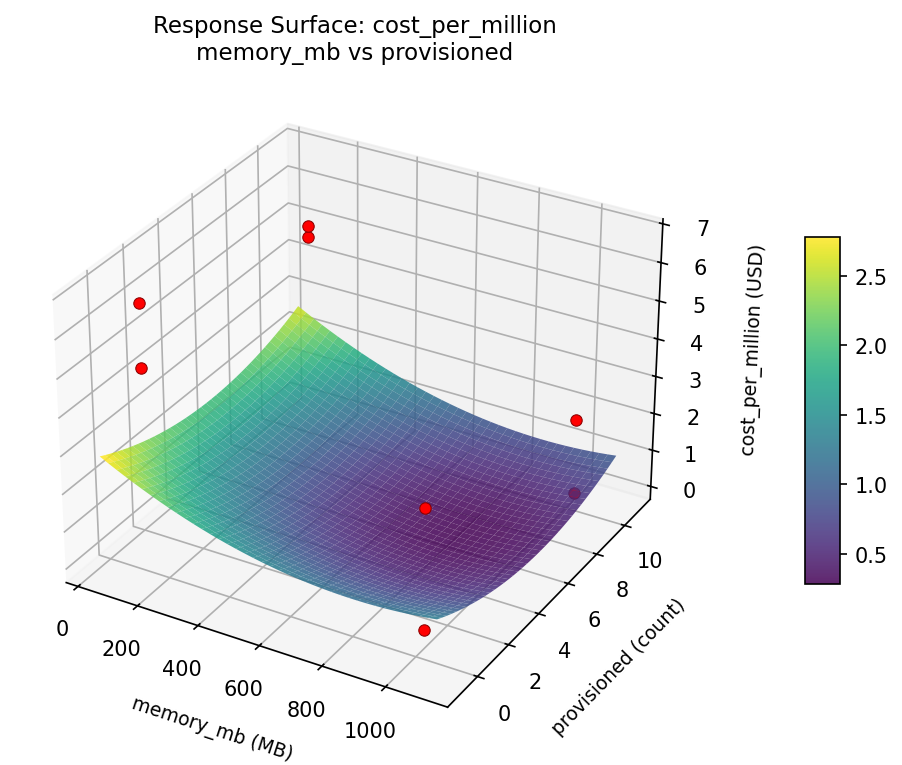
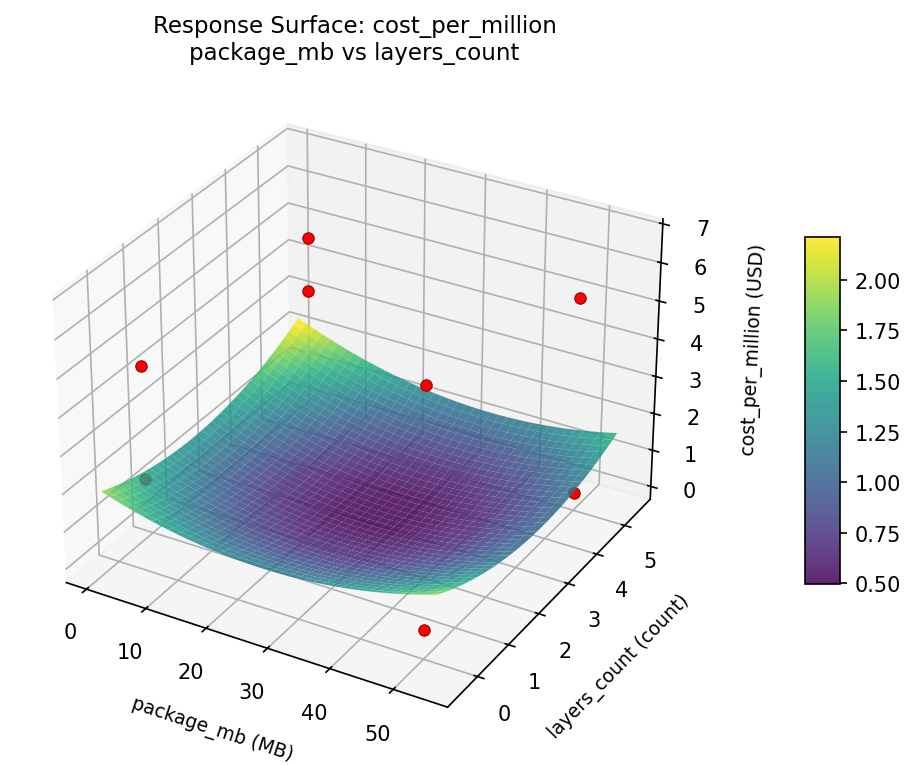
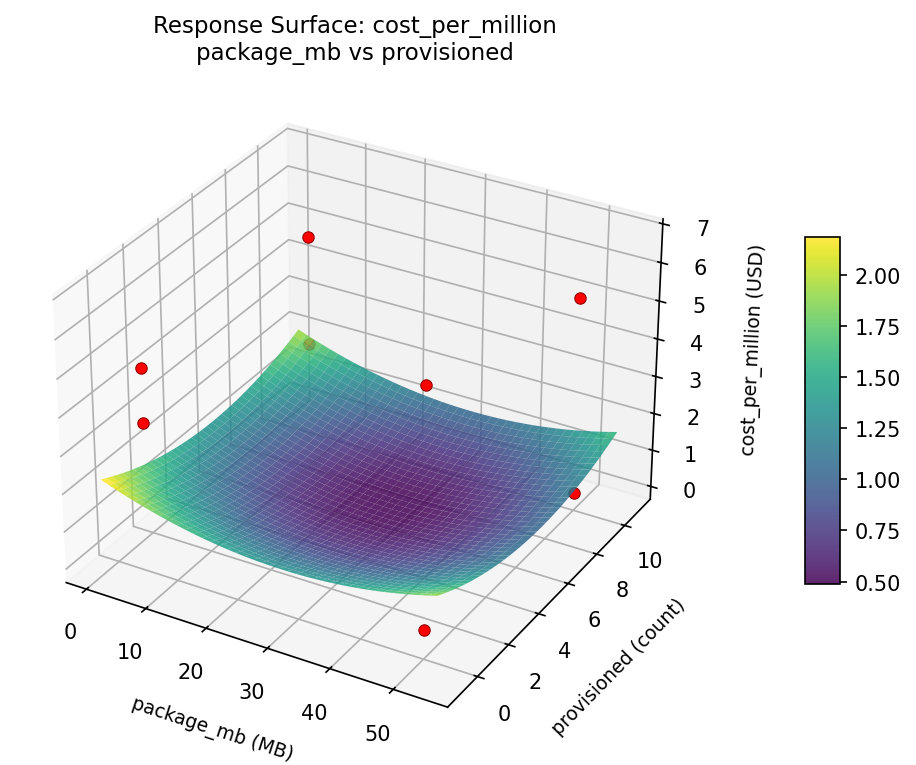
Response Surface Plots
3D surfaces fitted with quadratic RSM. Red dots are observed data points.
cold start ms layers count vs provisioned
cold start ms memory mb vs layers count
cold start ms memory mb vs package mb
cold start ms memory mb vs provisioned
cold start ms package mb vs layers count
cold start ms package mb vs provisioned

cost per million layers count vs provisioned
cost per million memory mb vs layers count
cost per million memory mb vs package mb
cost per million memory mb vs provisioned
cost per million package mb vs layers count
cost per million package mb vs provisioned
Multi-Objective Optimization
When responses compete, Derringer–Suich desirability finds the best compromise.
Each response is scaled to a 0–1 desirability, then combined via a weighted geometric mean.
Overall Desirability
D = 0.7862
Per-Response Desirability
| Response | Weight | Desirability | Predicted | Dir |
|---|
cold_start_ms |
1.5 |
|
316.06 0.7836 316.06 ms |
↓ |
cost_per_million |
1.0 |
|
1.30 0.7900 1.30 USD |
↓ |
Recommended Settings
| Factor | Value |
|---|
memory_mb | 237.7 MB |
runtime | go |
package_mb | 49.37 MB |
vpc_enabled | no |
layers_count | 4.879 count |
provisioned | 5.733 count |
Source: from RSM model prediction
Trade-off Summary
Sacrifice = how much worse than single-objective best.
| Response | Predicted | Best Observed | Sacrifice |
|---|
cost_per_million | 1.30 | 0.12 | +1.18 |
Top 3 Runs by Desirability
| Run | D | Factor Settings |
|---|
| #5 | 0.6133 | memory_mb=1024, runtime=go, package_mb=50, vpc_enabled=no, layers_count=0, provisioned=0 |
| #8 | 0.5792 | memory_mb=128, runtime=go, package_mb=5, vpc_enabled=no, layers_count=5, provisioned=0 |
Model Quality
| Response | R² | Type |
|---|
cost_per_million | 0.4918 | linear |
Full Multi-Objective Output
============================================================
MULTI-OBJECTIVE OPTIMIZATION
Method: Derringer-Suich Desirability Function
============================================================
Overall desirability: D = 0.7862
Response Weight Desirability Predicted Direction
---------------------------------------------------------------------
cold_start_ms 1.5 0.7836 316.06 ms ↓
cost_per_million 1.0 0.7900 1.30 USD ↓
Recommended settings:
memory_mb = 237.7 MB
runtime = go
package_mb = 49.37 MB
vpc_enabled = no
layers_count = 4.879 count
provisioned = 5.733 count
(from RSM model prediction)
Trade-off summary:
cold_start_ms: 316.06 (best observed: -31.00, sacrifice: +347.06)
cost_per_million: 1.30 (best observed: 0.12, sacrifice: +1.18)
Model quality:
cold_start_ms: R² = 0.9813 (linear)
cost_per_million: R² = 0.4918 (linear)
Top 3 observed runs by overall desirability:
1. Run #1 (D=0.7540): memory_mb=128, runtime=python, package_mb=50, vpc_enabled=no, layers_count=5, provisioned=10
2. Run #5 (D=0.6133): memory_mb=1024, runtime=go, package_mb=50, vpc_enabled=no, layers_count=0, provisioned=0
3. Run #8 (D=0.5792): memory_mb=128, runtime=go, package_mb=5, vpc_enabled=no, layers_count=5, provisioned=0
Full Analysis Output
=== Main Effects: cold_start_ms ===
Factor Effect Std Error % Contribution
--------------------------------------------------------------
memory_mb -740.2500 199.4170 34.8%
package_mb 540.2500 199.4170 25.4%
vpc_enabled 394.7500 199.4170 18.6%
runtime -272.2500 199.4170 12.8%
provisioned 170.7500 199.4170 8.0%
layers_count 8.7500 199.4170 0.4%
=== ANOVA Table: cold_start_ms ===
Source DF SS MS F p-value
-----------------------------------------------------------------------------
memory_mb 1 1095940.1250 1095940.1250 12.530 0.0095
runtime 1 148240.1250 148240.1250 1.695 0.2342
package_mb 1 583740.1250 583740.1250 6.674 0.0363
vpc_enabled 1 311655.1250 311655.1250 3.563 0.1010
layers_count 1 153.1250 153.1250 0.002 0.9678
provisioned 1 58311.1250 58311.1250 0.667 0.4411
memory_mb*runtime 1 583740.1250 583740.1250 6.674 0.0363
memory_mb*package_mb 1 148240.1250 148240.1250 1.695 0.2342
memory_mb*vpc_enabled 1 153.1250 153.1250 0.002 0.9678
memory_mb*layers_count 1 311655.1250 311655.1250 3.563 0.1010
memory_mb*provisioned 1 28920.1250 28920.1250 0.331 0.5833
runtime*package_mb 1 1095940.1250 1095940.1250 12.530 0.0095
runtime*vpc_enabled 1 58311.1250 58311.1250 0.667 0.4411
runtime*layers_count 1 28920.1250 28920.1250 0.331 0.5833
runtime*provisioned 1 311655.1250 311655.1250 3.563 0.1010
package_mb*vpc_enabled 1 28920.1250 28920.1250 0.331 0.5833
package_mb*layers_count 1 58311.1250 58311.1250 0.667 0.4411
package_mb*provisioned 1 153.1250 153.1250 0.002 0.9678
vpc_enabled*layers_count 1 1095940.1250 1095940.1250 12.530 0.0095
vpc_enabled*provisioned 1 148240.1250 148240.1250 1.695 0.2342
layers_count*provisioned 1 583740.1250 583740.1250 6.674 0.0363
Error (Lenth PSE) 7 612266.8125 87466.6875
Total 7 2226959.8750 318137.1250
Note: Error estimated using Lenth's pseudo-standard-error (unreplicated design)
=== Interaction Effects: cold_start_ms ===
Factor A Factor B Interaction % Contribution
------------------------------------------------------------------------
runtime package_mb -740.2500 16.0%
vpc_enabled layers_count 740.2500 16.0%
memory_mb runtime 540.2500 11.7%
layers_count provisioned 540.2500 11.7%
memory_mb layers_count -394.7500 8.6%
runtime provisioned -394.7500 8.6%
memory_mb package_mb -272.2500 5.9%
vpc_enabled provisioned 272.2500 5.9%
runtime vpc_enabled -170.7500 3.7%
package_mb layers_count 170.7500 3.7%
memory_mb provisioned 120.2500 2.6%
runtime layers_count 120.2500 2.6%
package_mb vpc_enabled -120.2500 2.6%
memory_mb vpc_enabled -8.7500 0.2%
package_mb provisioned 8.7500 0.2%
=== Summary Statistics: cold_start_ms ===
memory_mb:
Level N Mean Std Min Max
------------------------------------------------------------
1024 4 1181.7500 524.5693 599.0000 1815.0000
128 4 441.5000 319.1139 -31.0000 646.0000
runtime:
Level N Mean Std Min Max
------------------------------------------------------------
go 4 947.7500 810.7410 -31.0000 1815.0000
python 4 675.5000 188.6946 528.0000 952.0000
package_mb:
Level N Mean Std Min Max
------------------------------------------------------------
5 4 541.5000 412.5098 -31.0000 952.0000
50 4 1081.7500 614.4718 528.0000 1815.0000
vpc_enabled:
Level N Mean Std Min Max
------------------------------------------------------------
no 4 614.2500 572.0299 -31.0000 1361.0000
yes 4 1009.0000 557.8680 623.0000 1815.0000
layers_count:
Level N Mean Std Min Max
------------------------------------------------------------
0 4 807.2500 369.6651 599.0000 1361.0000
5 4 816.0000 778.2138 -31.0000 1815.0000
provisioned:
Level N Mean Std Min Max
------------------------------------------------------------
0 4 726.2500 588.2060 -31.0000 1361.0000
10 4 897.0000 613.9191 528.0000 1815.0000
=== Main Effects: cost_per_million ===
Factor Effect Std Error % Contribution
--------------------------------------------------------------
memory_mb 3.9500 0.8536 48.2%
runtime -1.6100 0.8536 19.6%
package_mb 0.9750 0.8536 11.9%
vpc_enabled 0.7800 0.8536 9.5%
provisioned 0.7750 0.8536 9.5%
layers_count 0.1050 0.8536 1.3%
=== ANOVA Table: cost_per_million ===
Source DF SS MS F p-value
-----------------------------------------------------------------------------
memory_mb 1 31.2050 31.2050 17.318 0.0042
runtime 1 5.1842 5.1842 2.877 0.1337
package_mb 1 1.9013 1.9013 1.055 0.3385
vpc_enabled 1 1.2168 1.2168 0.675 0.4383
layers_count 1 0.0220 0.0220 0.012 0.9150
provisioned 1 1.2012 1.2012 0.667 0.4411
memory_mb*runtime 1 1.9013 1.9013 1.055 0.3385
memory_mb*package_mb 1 5.1842 5.1842 2.877 0.1337
memory_mb*vpc_enabled 1 0.0220 0.0220 0.012 0.9150
memory_mb*layers_count 1 1.2168 1.2168 0.675 0.4383
memory_mb*provisioned 1 0.0722 0.0722 0.040 0.8470
runtime*package_mb 1 31.2050 31.2050 17.318 0.0042
runtime*vpc_enabled 1 1.2012 1.2012 0.667 0.4411
runtime*layers_count 1 0.0722 0.0722 0.040 0.8470
runtime*provisioned 1 1.2168 1.2168 0.675 0.4383
package_mb*vpc_enabled 1 0.0722 0.0722 0.040 0.8470
package_mb*layers_count 1 1.2012 1.2012 0.667 0.4411
package_mb*provisioned 1 0.0220 0.0220 0.012 0.9150
vpc_enabled*layers_count 1 31.2050 31.2050 17.318 0.0042
vpc_enabled*provisioned 1 5.1842 5.1842 2.877 0.1337
layers_count*provisioned 1 1.9013 1.9013 1.055 0.3385
Error (Lenth PSE) 7 12.6131 1.8019
Total 7 40.8028 5.8290
Note: Error estimated using Lenth's pseudo-standard-error (unreplicated design)
=== Interaction Effects: cost_per_million ===
Factor A Factor B Interaction % Contribution
------------------------------------------------------------------------
runtime package_mb 3.9500 23.3%
vpc_enabled layers_count -3.9500 23.3%
memory_mb package_mb -1.6100 9.5%
vpc_enabled provisioned 1.6100 9.5%
memory_mb runtime 0.9750 5.7%
layers_count provisioned 0.9750 5.7%
memory_mb layers_count -0.7800 4.6%
runtime provisioned -0.7800 4.6%
runtime vpc_enabled -0.7750 4.6%
package_mb layers_count 0.7750 4.6%
memory_mb provisioned 0.1900 1.1%
runtime layers_count 0.1900 1.1%
package_mb vpc_enabled -0.1900 1.1%
memory_mb vpc_enabled -0.1050 0.6%
package_mb provisioned 0.1050 0.6%
=== Summary Statistics: cost_per_million ===
memory_mb:
Level N Mean Std Min Max
------------------------------------------------------------
1024 4 1.5625 1.6132 0.1200 3.5900
128 4 5.5125 0.7725 5.0100 6.6500
runtime:
Level N Mean Std Min Max
------------------------------------------------------------
go 4 4.3425 1.9387 2.1200 6.6500
python 4 2.7325 2.8485 0.1200 5.3400
package_mb:
Level N Mean Std Min Max
------------------------------------------------------------
5 4 3.0500 3.2814 0.1200 6.6500
50 4 4.0250 1.4830 2.1200 5.3400
vpc_enabled:
Level N Mean Std Min Max
------------------------------------------------------------
no 4 3.1475 2.4831 0.1200 5.3400
yes 4 3.9275 2.6513 0.4200 6.6500
layers_count:
Level N Mean Std Min Max
------------------------------------------------------------
0 4 3.4850 2.9242 0.1200 6.6500
5 4 3.5900 2.2456 0.4200 5.3400
provisioned:
Level N Mean Std Min Max
------------------------------------------------------------
0 4 3.1500 2.2791 0.4200 5.0500
10 4 3.9250 2.8295 0.1200 6.6500
Optimization Recommendations
=== Optimization: cold_start_ms ===
Direction: minimize
Best observed run: #8
memory_mb = 1024
runtime = go
package_mb = 50
vpc_enabled = yes
layers_count = 5
provisioned = 10
Value: -31.0
RSM Model (linear, R² = 0.8601, Adj R² = 0.0204):
Coefficients:
intercept +811.6250
memory_mb -287.8750
runtime +275.8750
package_mb +212.6250
vpc_enabled -161.8750
layers_count -54.3750
provisioned -77.8750
Predicted optimum (from linear model, at observed points):
memory_mb = 128
runtime = python
package_mb = 50
vpc_enabled = no
layers_count = 5
provisioned = 10
Predicted value: 1617.6250
Surface optimum (via L-BFGS-B, linear model):
memory_mb = 1024
runtime = python
package_mb = 5
vpc_enabled = yes
layers_count = 5
provisioned = 10
Predicted value: -258.8750
Model quality: Good fit — general trends are captured, some noise remains.
Factor importance:
1. memory_mb (effect: 575.8, contribution: 26.9%)
2. runtime (effect: 551.8, contribution: 25.8%)
3. package_mb (effect: 425.2, contribution: 19.9%)
4. vpc_enabled (effect: -323.8, contribution: 15.1%)
5. provisioned (effect: -155.8, contribution: 7.3%)
6. layers_count (effect: -108.8, contribution: 5.1%)
=== Optimization: cost_per_million ===
Direction: minimize
Best observed run: #1
memory_mb = 128
runtime = go
package_mb = 5
vpc_enabled = no
layers_count = 5
provisioned = 0
Value: 0.12
RSM Model (linear, R² = 0.9702, Adj R² = 0.7912):
Coefficients:
intercept +3.5375
memory_mb +0.8175
runtime +0.8875
package_mb -0.7525
vpc_enabled +1.1700
layers_count +0.3050
provisioned +1.2100
Predicted optimum (from linear model, at observed points):
memory_mb = 1024
runtime = python
package_mb = 5
vpc_enabled = yes
layers_count = 5
provisioned = 0
Predicted value: 6.2600
Surface optimum (via L-BFGS-B, linear model):
memory_mb = 128
runtime = python
package_mb = 50
vpc_enabled = no
layers_count = 0
provisioned = 0
Predicted value: -1.6050
Model quality: Excellent fit — surface predictions are reliable.
Factor importance:
1. provisioned (effect: 2.4, contribution: 23.5%)
2. vpc_enabled (effect: 2.3, contribution: 22.8%)
3. runtime (effect: 1.8, contribution: 17.3%)
4. memory_mb (effect: -1.6, contribution: 15.9%)
5. package_mb (effect: -1.5, contribution: 14.6%)
6. layers_count (effect: 0.6, contribution: 5.9%)