Summary
This experiment investigates smart sensor sampling. Fractional factorial of 5 sensor sampling parameters for measurement accuracy and power consumption.
The design varies 5 factors: sample rate hz (Hz), ranging from 1 to 100, adc resolution bits (bits), ranging from 8 to 16, averaging window (samples), ranging from 1 to 32, sleep mode depth (level), ranging from 1 to 4, and wakeup interval sec (sec), ranging from 1 to 60. The goal is to optimize 2 responses: measurement accuracy pct (%) (maximize) and power consumption mw (mW) (minimize). Fixed conditions held constant across all runs include mcu = esp32, sensor = bme280.
A fractional factorial design reduces the number of runs from 32 to 8 by deliberately confounding higher-order interactions. This is ideal for screening — identifying which of the 5 factors matter most before investing in a full study.
Key Findings
For measurement accuracy pct, the most influential factors were wakeup interval sec (50.1%), averaging window (39.7%), adc resolution bits (7.7%). The best observed value was 99.9 (at sample rate hz = 1, adc resolution bits = 8, averaging window = 1).
For power consumption mw, the most influential factors were sleep mode depth (50.4%), adc resolution bits (20.5%), wakeup interval sec (20.4%). The best observed value was 2.4 (at sample rate hz = 100, adc resolution bits = 8, averaging window = 1).
Recommended Next Steps
- Follow up with a response surface design (CCD or Box-Behnken) on the top 3–4 factors to model curvature and find the true optimum.
- Consider whether any fixed factors should be varied in a future study.
- The screening results can guide factor reduction — drop factors contributing less than 5% and re-run with a smaller, more focused design.
Experimental Setup
Factors
| Factor | Low | High | Unit |
|---|
sample_rate_hz | 1 | 100 | Hz |
adc_resolution_bits | 8 | 16 | bits |
averaging_window | 1 | 32 | samples |
sleep_mode_depth | 1 | 4 | level |
wakeup_interval_sec | 1 | 60 | sec |
Fixed: mcu = esp32, sensor = bme280
Responses
| Response | Direction | Unit |
|---|
measurement_accuracy_pct | ↑ maximize | % |
power_consumption_mw | ↓ minimize | mW |
Configuration
{
"metadata": {
"name": "Smart Sensor Sampling",
"description": "Fractional factorial of 5 sensor sampling parameters for measurement accuracy and power consumption"
},
"factors": [
{
"name": "sample_rate_hz",
"levels": [
"1",
"100"
],
"type": "continuous",
"unit": "Hz"
},
{
"name": "adc_resolution_bits",
"levels": [
"8",
"16"
],
"type": "continuous",
"unit": "bits"
},
{
"name": "averaging_window",
"levels": [
"1",
"32"
],
"type": "continuous",
"unit": "samples"
},
{
"name": "sleep_mode_depth",
"levels": [
"1",
"4"
],
"type": "continuous",
"unit": "level"
},
{
"name": "wakeup_interval_sec",
"levels": [
"1",
"60"
],
"type": "continuous",
"unit": "sec"
}
],
"fixed_factors": {
"mcu": "esp32",
"sensor": "bme280"
},
"responses": [
{
"name": "measurement_accuracy_pct",
"optimize": "maximize",
"unit": "%"
},
{
"name": "power_consumption_mw",
"optimize": "minimize",
"unit": "mW"
}
],
"settings": {
"operation": "fractional_factorial",
"test_script": "use_cases/67_smart_sensor_sampling/sim.sh"
}
}
Experimental Matrix
The Fractional Factorial Design produces 8 runs. Each row is one experiment with specific factor settings.
| Run | sample_rate_hz | adc_resolution_bits | averaging_window | sleep_mode_depth | wakeup_interval_sec |
|---|
| 1 | 1 | 16 | 32 | 1 | 1 |
| 2 | 100 | 8 | 1 | 1 | 1 |
| 3 | 100 | 16 | 1 | 4 | 1 |
| 4 | 100 | 16 | 32 | 4 | 60 |
| 5 | 1 | 16 | 1 | 1 | 60 |
| 6 | 100 | 8 | 32 | 1 | 60 |
| 7 | 1 | 8 | 1 | 4 | 60 |
| 8 | 1 | 8 | 32 | 4 | 1 |
Step-by-Step Workflow
1
Preview the design
$ doe info --config use_cases/67_smart_sensor_sampling/config.json
2
Generate the runner script
$ doe generate --config use_cases/67_smart_sensor_sampling/config.json \
--output use_cases/67_smart_sensor_sampling/results/run.sh --seed 42
3
Execute the experiments
$ bash use_cases/67_smart_sensor_sampling/results/run.sh
4
Analyze results
$ doe analyze --config use_cases/67_smart_sensor_sampling/config.json
5
Get optimization recommendations
$ doe optimize --config use_cases/67_smart_sensor_sampling/config.json
6
Multi-objective optimization
With 2 competing responses, use --multi to find the best compromise via Derringer–Suich desirability.
$ doe optimize --config use_cases/67_smart_sensor_sampling/config.json --multi
7
Generate the HTML report
$ doe report --config use_cases/67_smart_sensor_sampling/config.json \
--output use_cases/67_smart_sensor_sampling/results/report.html
Features Exercised
| Feature | Value |
|---|
| Design type | fractional_factorial |
| Factor types | continuous (all 5) |
| Arg style | double-dash |
| Responses | 2 (measurement_accuracy_pct ↑, power_consumption_mw ↓) |
| Total runs | 8 |
Analysis Results
Generated from actual experiment runs using the DOE Helper Tool.
Response: measurement_accuracy_pct
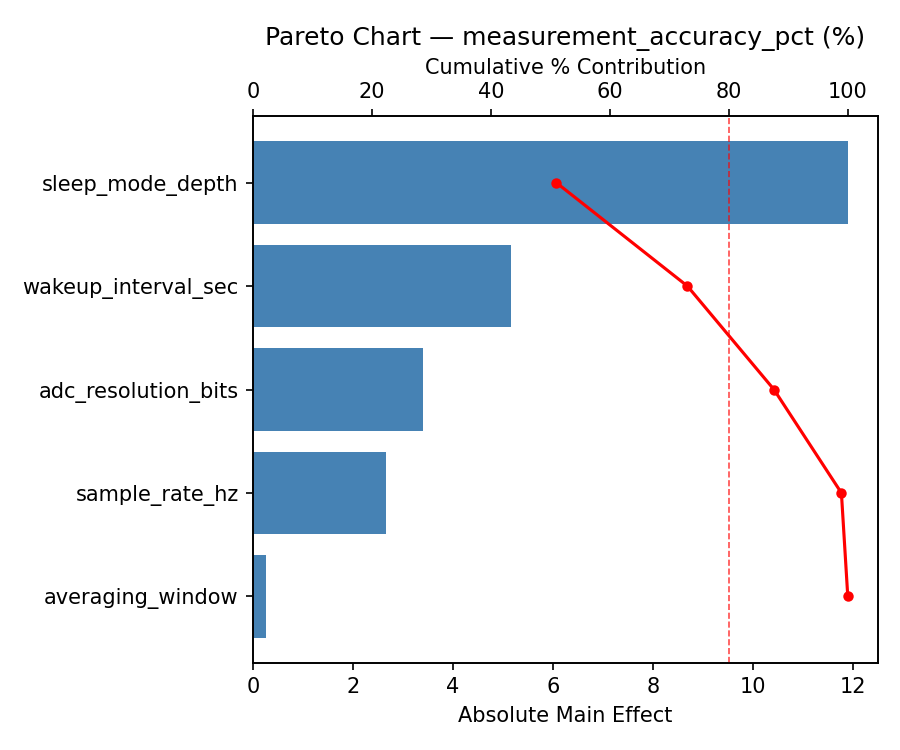
Top factors: wakeup_interval_sec (50.1%), averaging_window (39.7%), adc_resolution_bits (7.7%).
ANOVA
| Source | DF | SS | MS | F | p-value |
|---|
| Source | DF | SS | MS | F | p-value |
| sample_rate_hz | 1 | 0.1250 | 0.1250 | 0.667 | 0.4513 |
| adc_resolution_bits | 1 | 6.8450 | 6.8450 | 36.507 | 0.0018 |
| averaging_window | 1 | 182.4050 | 182.4050 | 972.827 | 0.0000 |
| sleep_mode_depth | 1 | 0.2450 | 0.2450 | 1.307 | 0.3048 |
| wakeup_interval_sec | 1 | 290.4050 | 290.4050 | 1548.827 | 0.0000 |
| sample_rate_hz*adc_resolution_bits | 1 | 0.2450 | 0.2450 | 1.307 | 0.3048 |
| sample_rate_hz*averaging_window | 1 | 290.4050 | 290.4050 | 1548.827 | 0.0000 |
| sample_rate_hz*sleep_mode_depth | 1 | 6.8450 | 6.8450 | 36.507 | 0.0018 |
| sample_rate_hz*wakeup_interval_sec | 1 | 182.4050 | 182.4050 | 972.827 | 0.0000 |
| adc_resolution_bits*averaging_window | 1 | 0.1250 | 0.1250 | 0.667 | 0.4513 |
| adc_resolution_bits*sleep_mode_depth | 1 | 0.1250 | 0.1250 | 0.667 | 0.4513 |
| adc_resolution_bits*wakeup_interval_sec | 1 | 129.6050 | 129.6050 | 691.227 | 0.0000 |
| averaging_window*sleep_mode_depth | 1 | 129.6050 | 129.6050 | 691.227 | 0.0000 |
| averaging_window*wakeup_interval_sec | 1 | 0.1250 | 0.1250 | 0.667 | 0.4513 |
| sleep_mode_depth*wakeup_interval_sec | 1 | 0.1250 | 0.1250 | 0.667 | 0.4513 |
| Error | (Lenth | PSE) | 5 | 0.9375 | 0.1875 |
| Total | 7 | 609.7550 | 87.1079 | | |
Pareto Chart
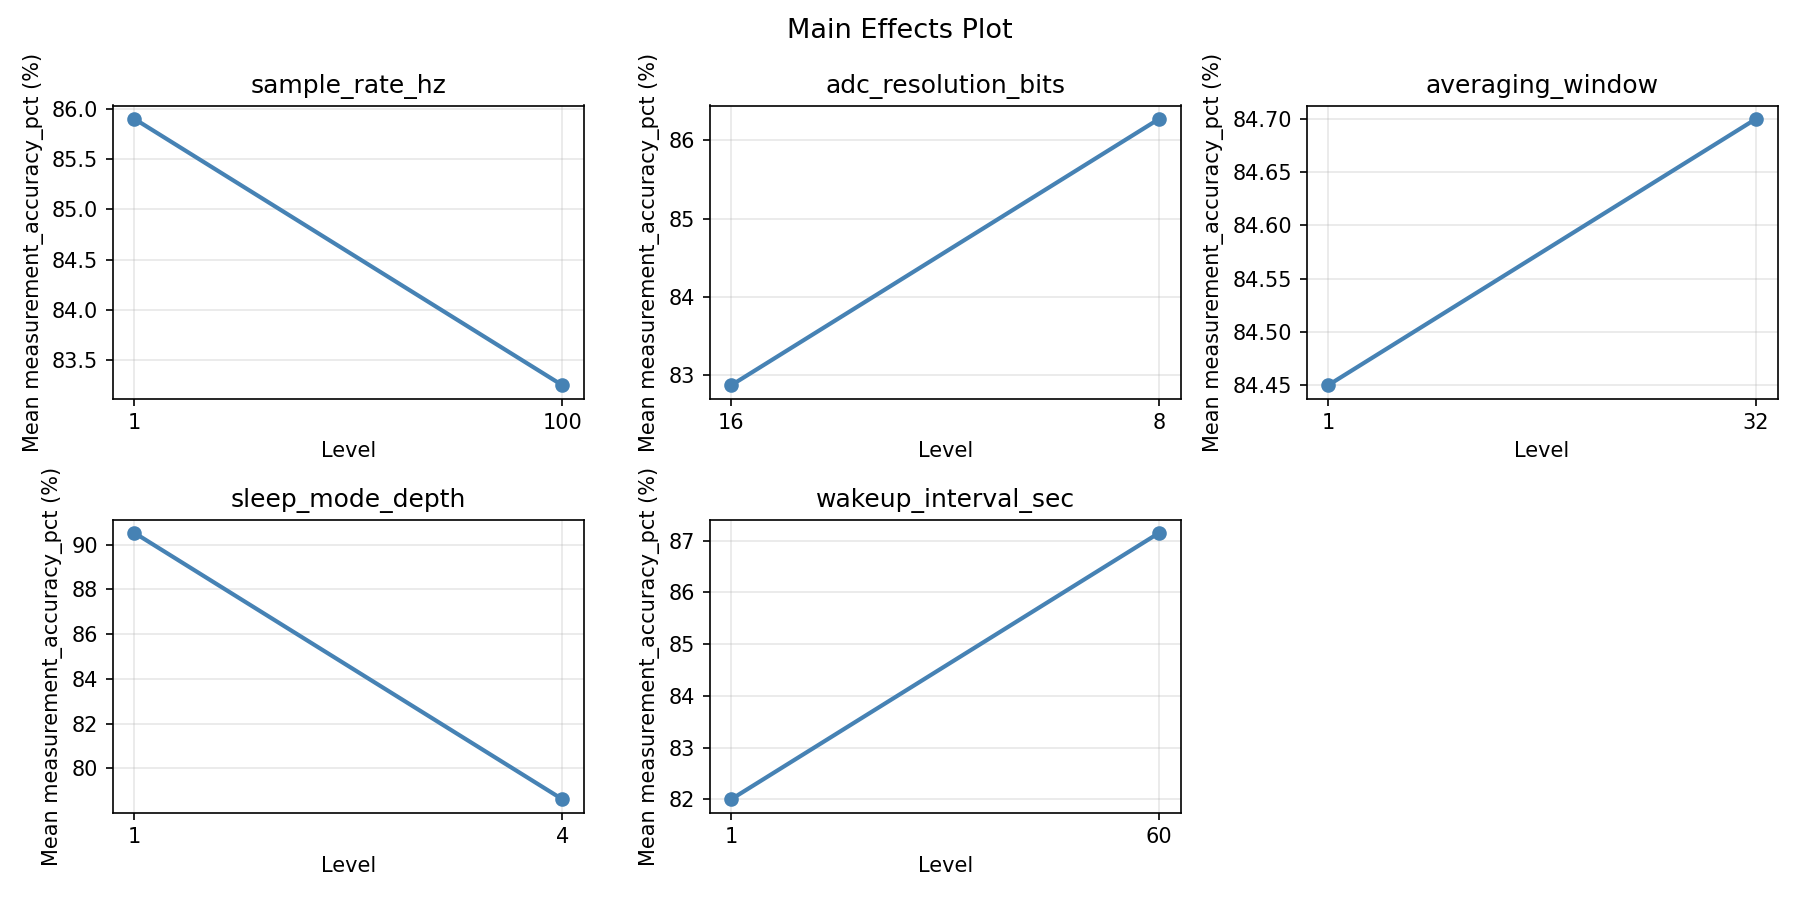
Main Effects Plot
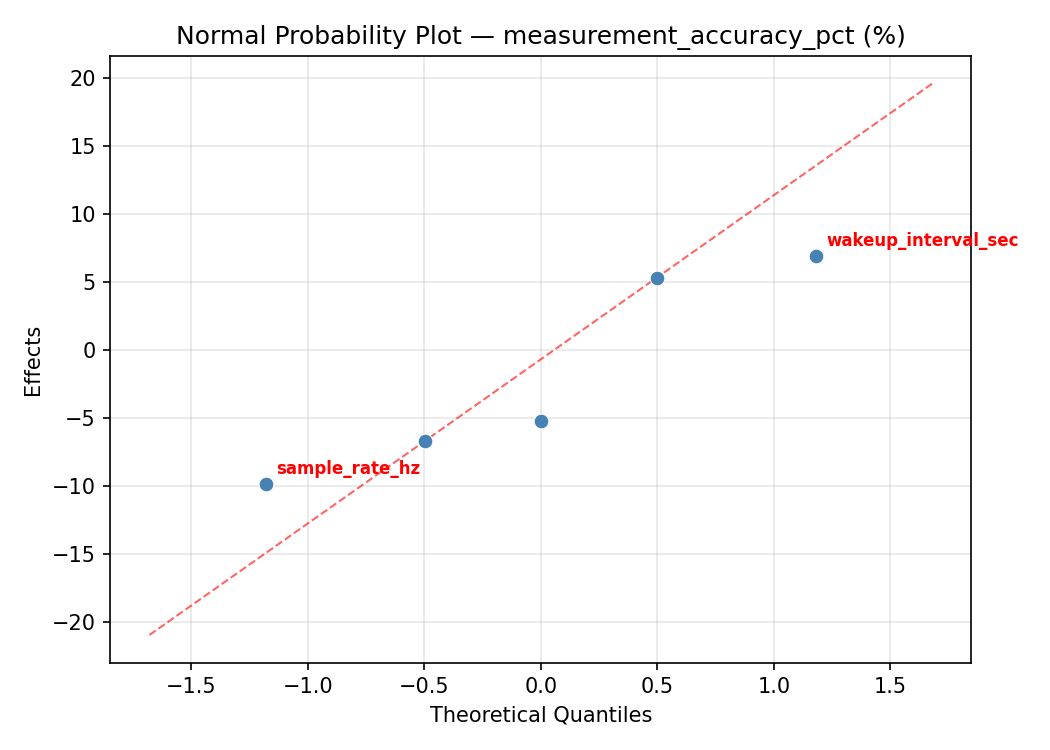
Normal Probability Plot of Effects
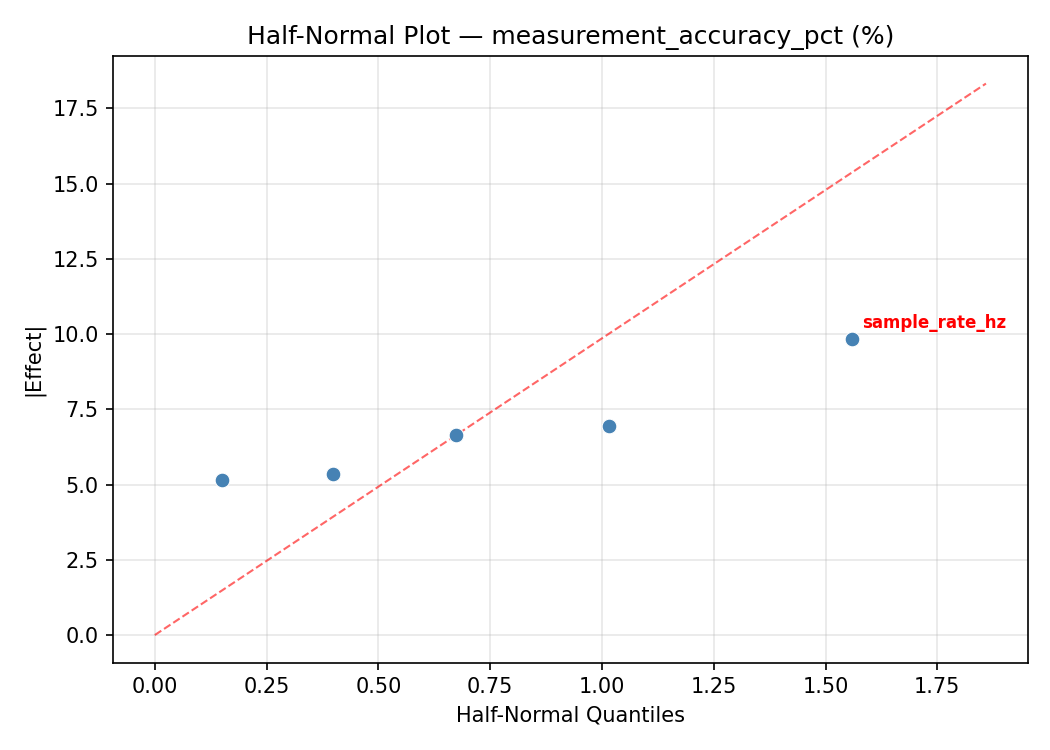
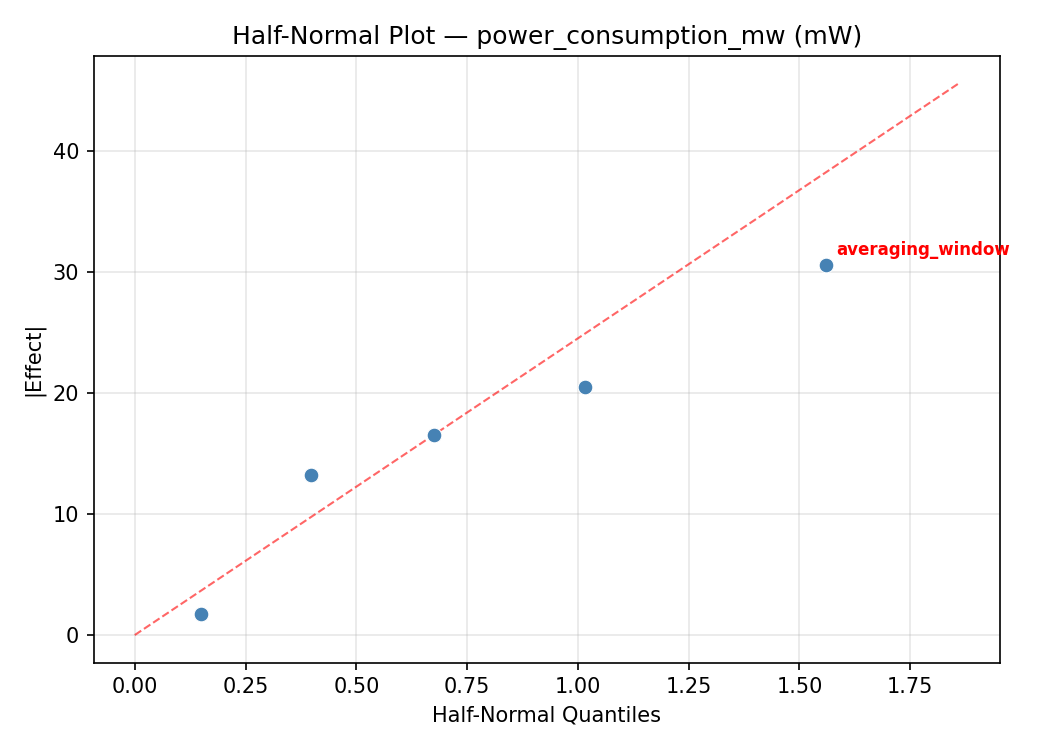
Half-Normal Plot of Effects
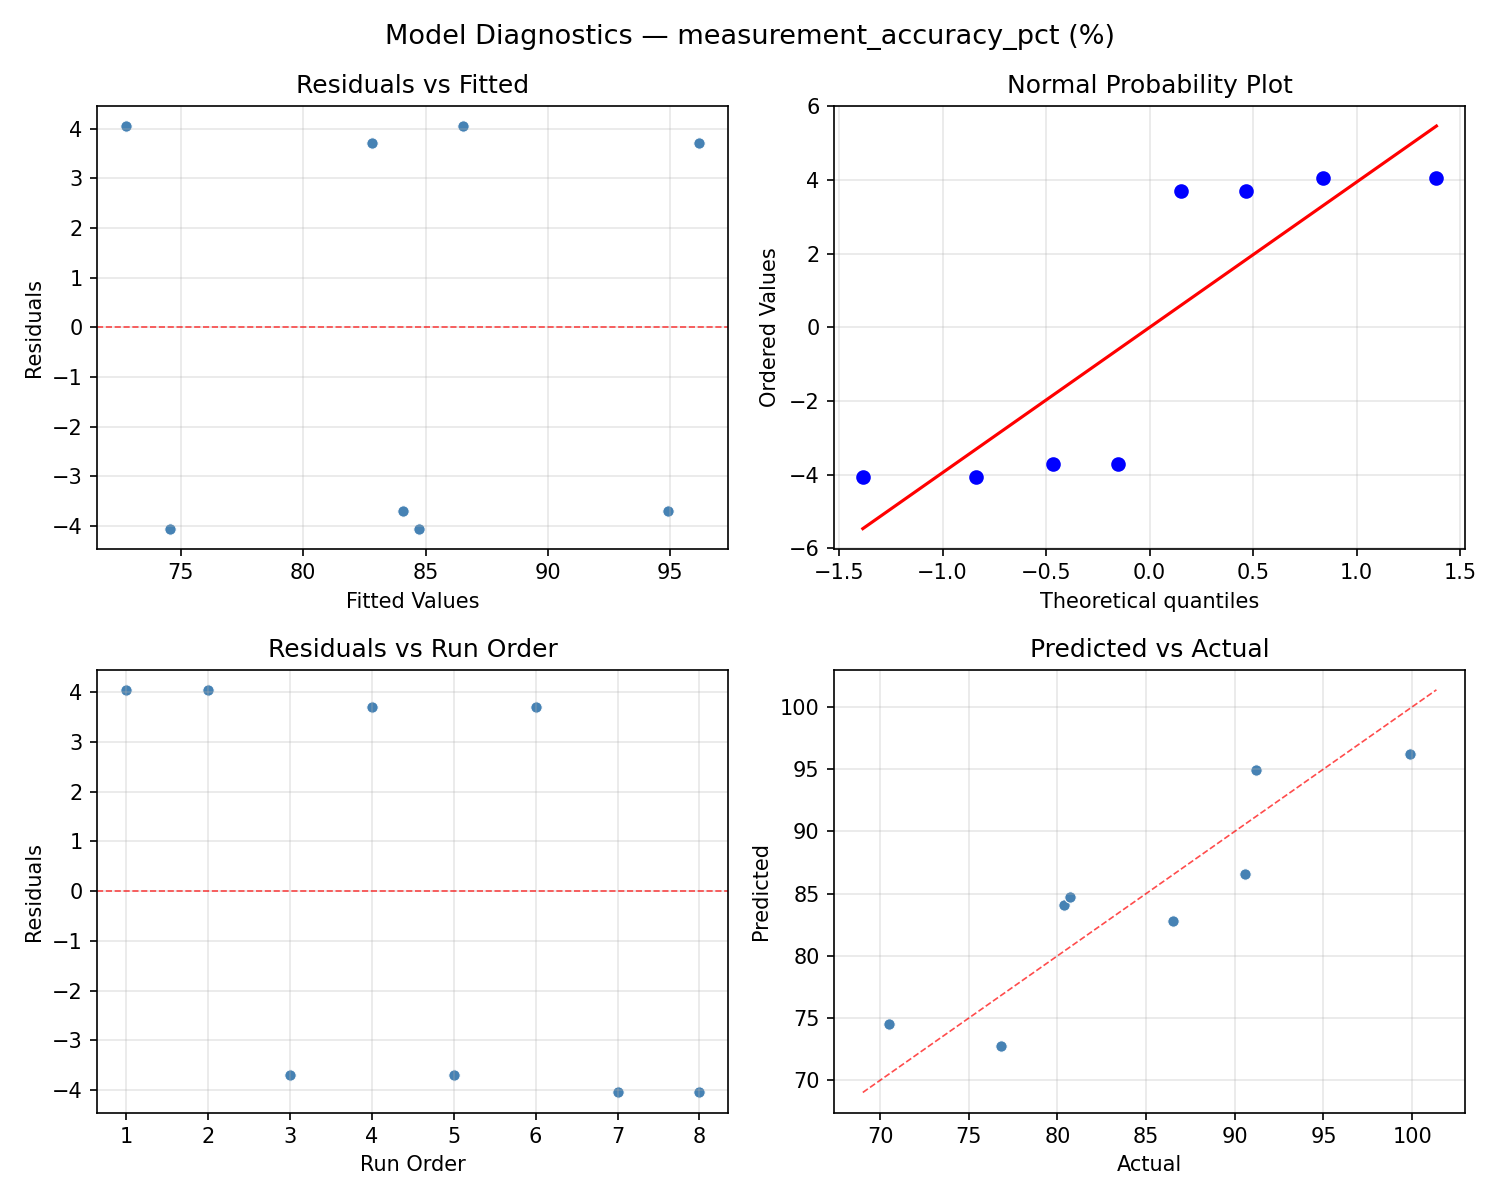
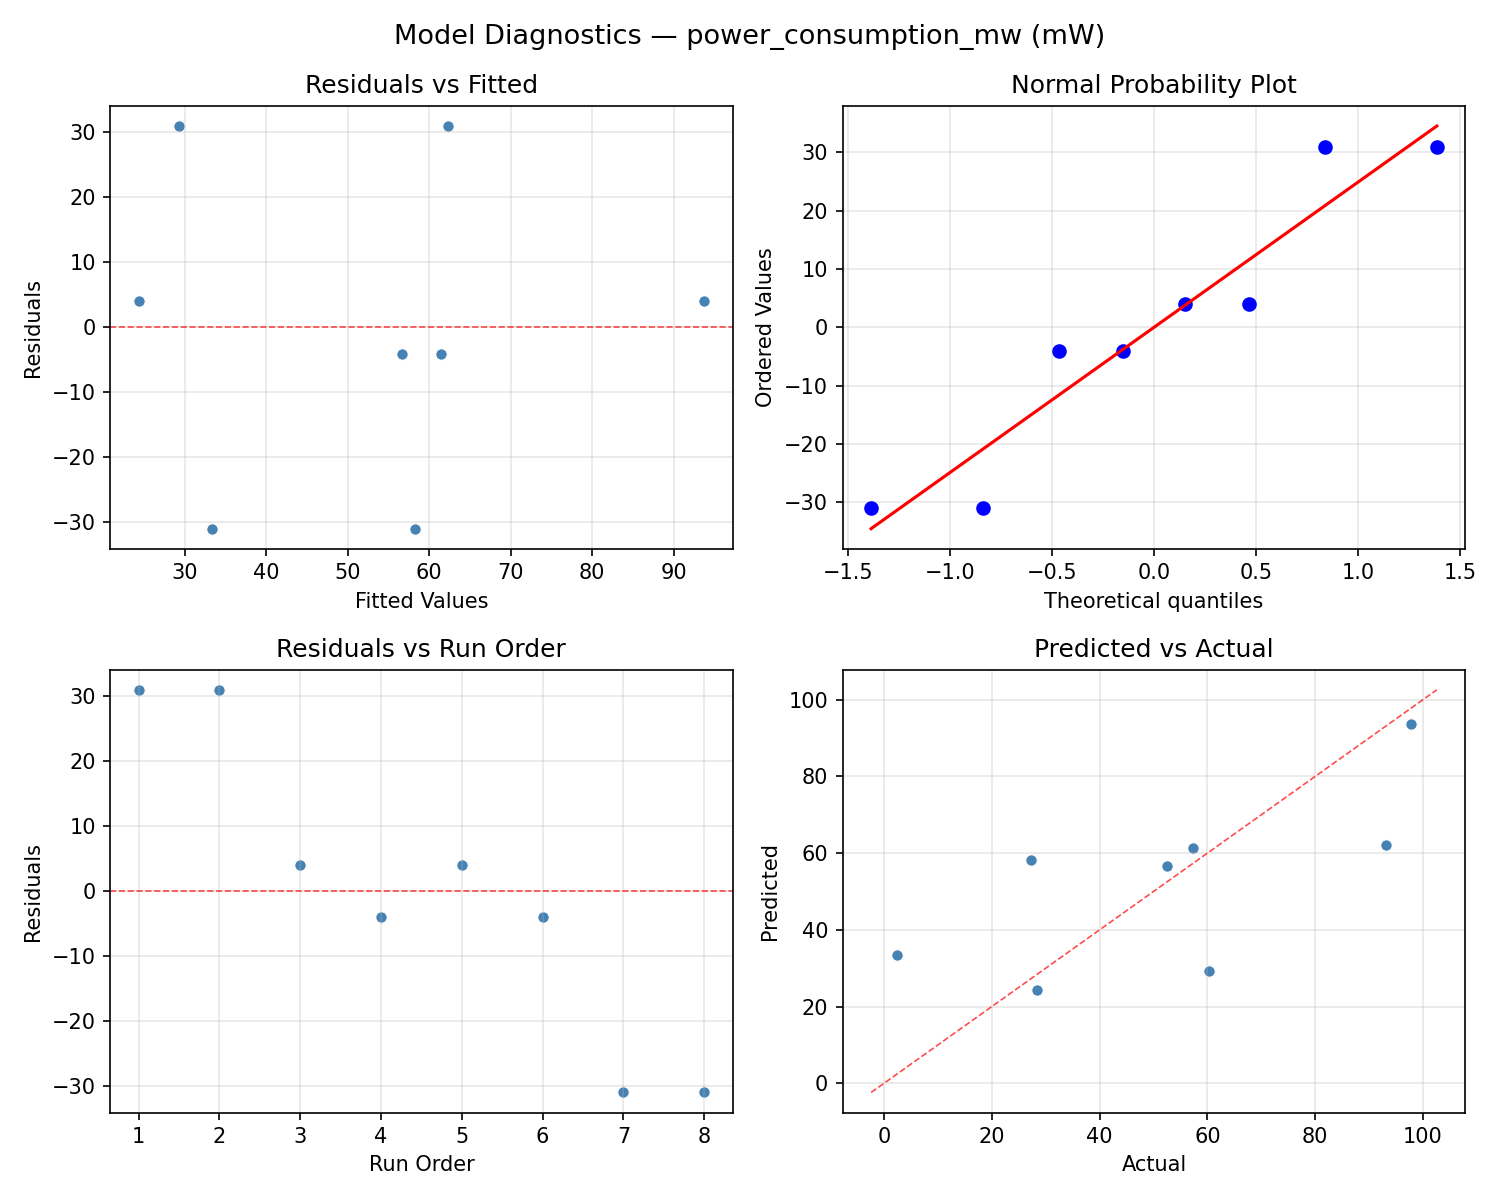
Model Diagnostics
Response: power_consumption_mw
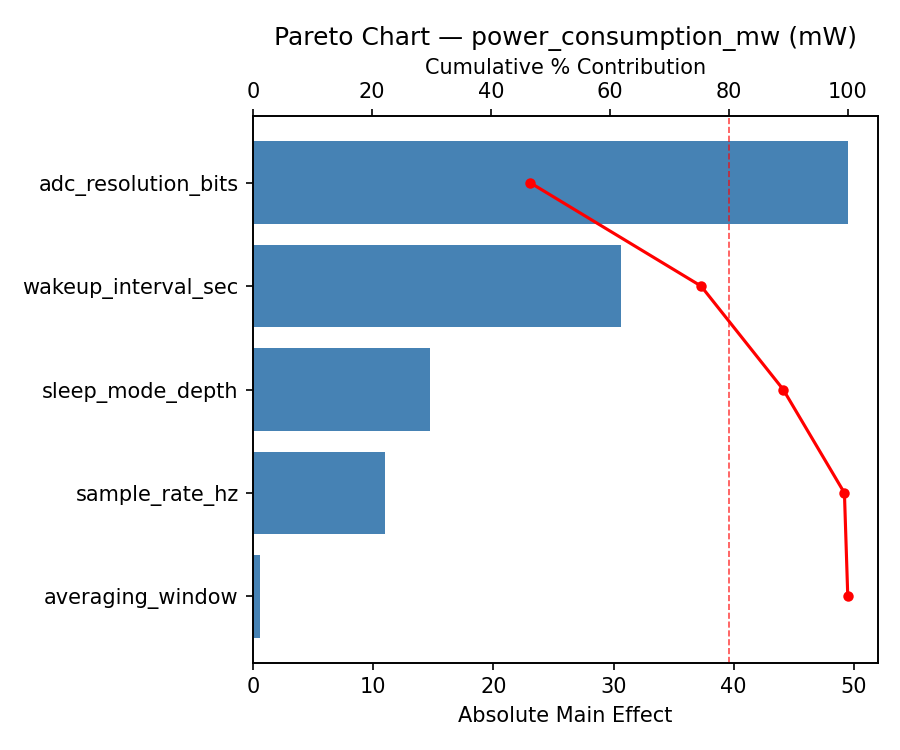
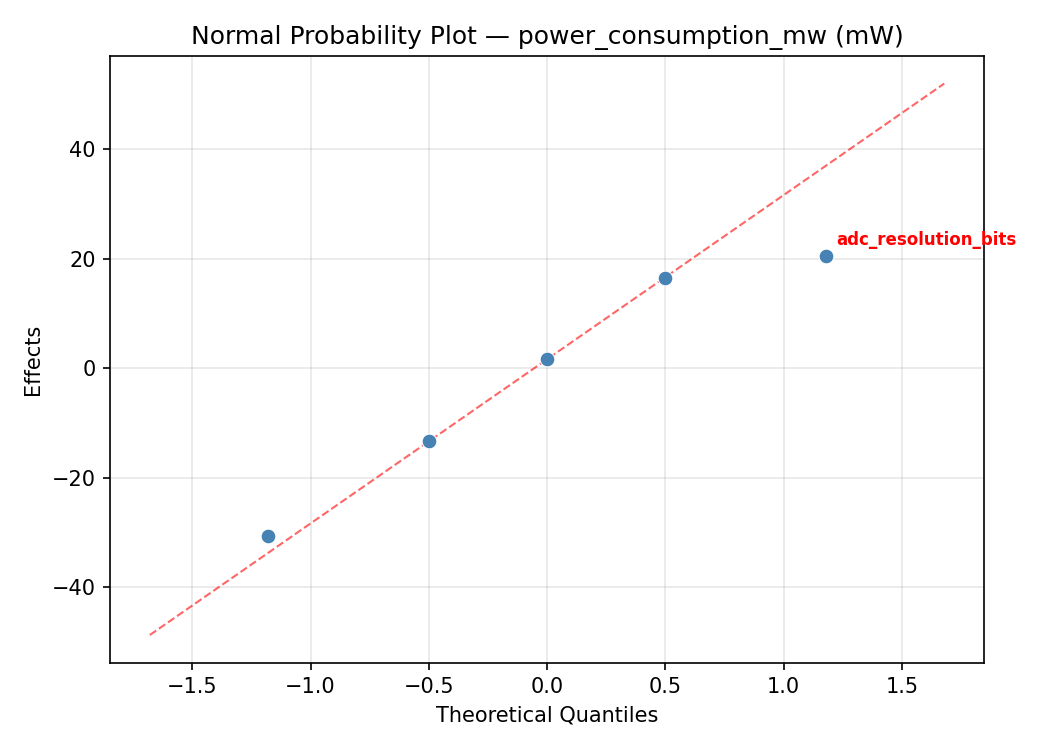
Top factors: sleep_mode_depth (50.4%), adc_resolution_bits (20.5%), wakeup_interval_sec (20.4%).
ANOVA
| Source | DF | SS | MS | F | p-value |
|---|
| Source | DF | SS | MS | F | p-value |
| sample_rate_hz | 1 | 0.7200 | 0.7200 | 0.008 | 0.9325 |
| adc_resolution_bits | 1 | 406.1250 | 406.1250 | 4.475 | 0.0880 |
| averaging_window | 1 | 60.5000 | 60.5000 | 0.667 | 0.4513 |
| sleep_mode_depth | 1 | 2450.0000 | 2450.0000 | 26.997 | 0.0035 |
| wakeup_interval_sec | 1 | 400.4450 | 400.4450 | 4.413 | 0.0897 |
| sample_rate_hz*adc_resolution_bits | 1 | 2450.0000 | 2450.0000 | 26.997 | 0.0035 |
| sample_rate_hz*averaging_window | 1 | 400.4450 | 400.4450 | 4.413 | 0.0897 |
| sample_rate_hz*sleep_mode_depth | 1 | 406.1250 | 406.1250 | 4.475 | 0.0880 |
| sample_rate_hz*wakeup_interval_sec | 1 | 60.5000 | 60.5000 | 0.667 | 0.4513 |
| adc_resolution_bits*averaging_window | 1 | 33.6200 | 33.6200 | 0.370 | 0.5693 |
| adc_resolution_bits*sleep_mode_depth | 1 | 0.7200 | 0.7200 | 0.008 | 0.9325 |
| adc_resolution_bits*wakeup_interval_sec | 1 | 4167.8450 | 4167.8450 | 45.927 | 0.0011 |
| averaging_window*sleep_mode_depth | 1 | 4167.8450 | 4167.8450 | 45.927 | 0.0011 |
| averaging_window*wakeup_interval_sec | 1 | 0.7200 | 0.7200 | 0.008 | 0.9325 |
| sleep_mode_depth*wakeup_interval_sec | 1 | 33.6200 | 33.6200 | 0.370 | 0.5693 |
| Error | (Lenth | PSE) | 5 | 453.7500 | 90.7500 |
| Total | 7 | 7519.2550 | 1074.1793 | | |
Pareto Chart
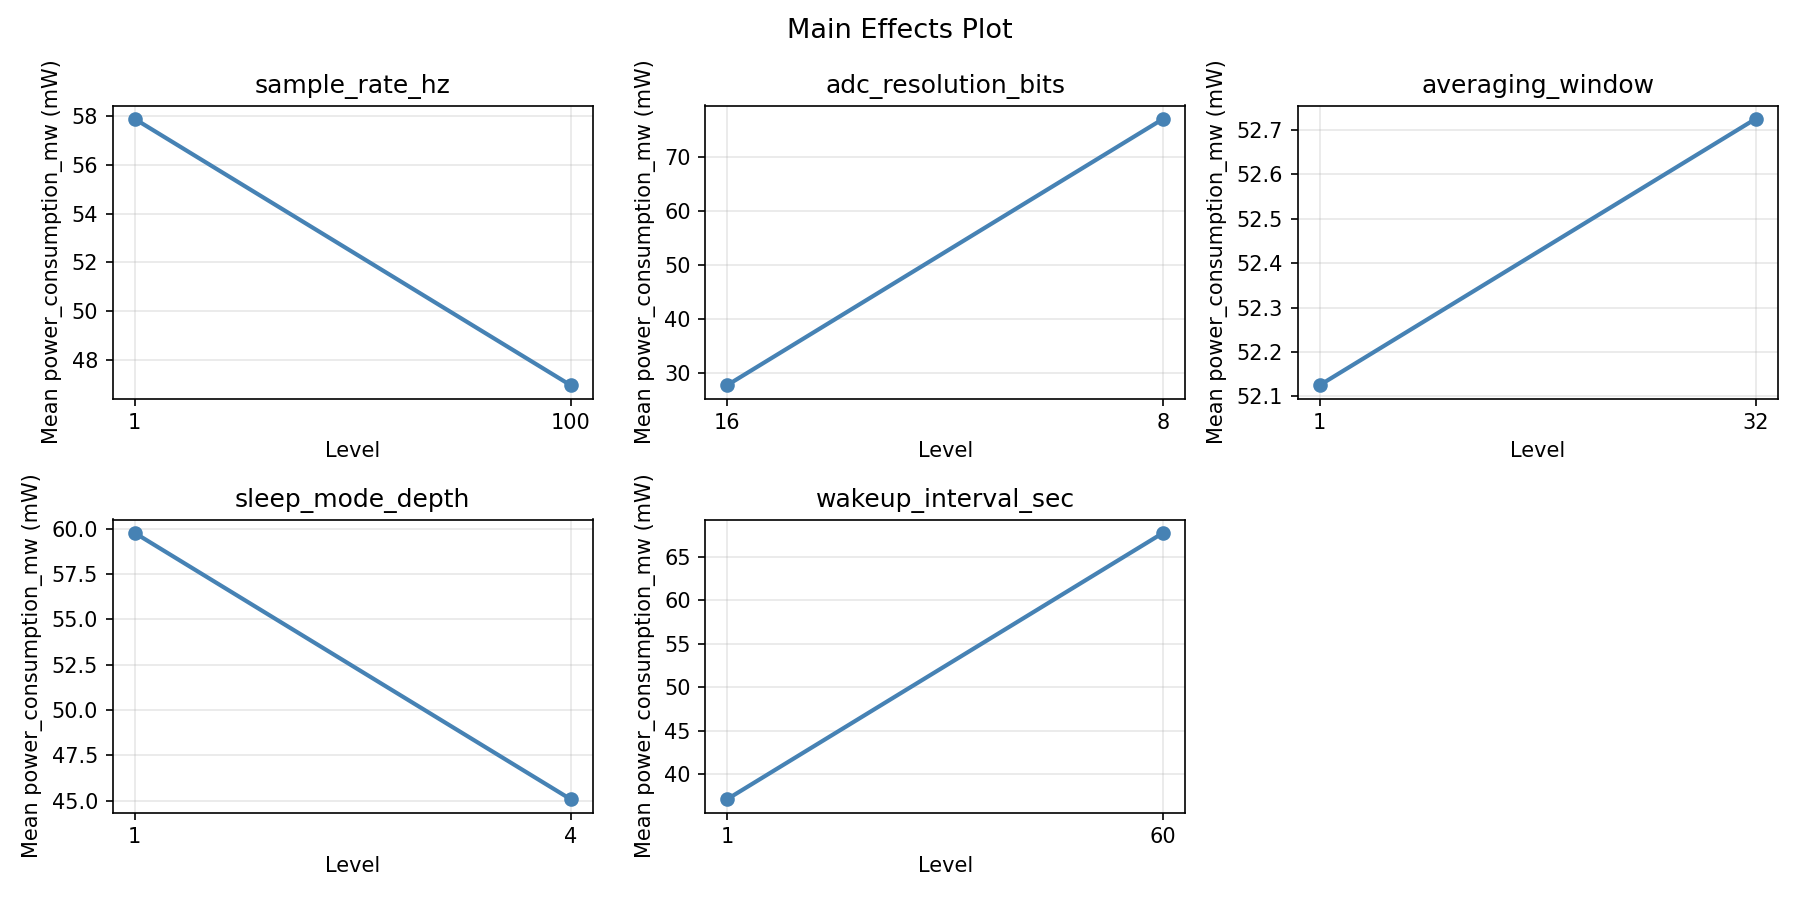
Main Effects Plot
Normal Probability Plot of Effects
Half-Normal Plot of Effects
Model Diagnostics
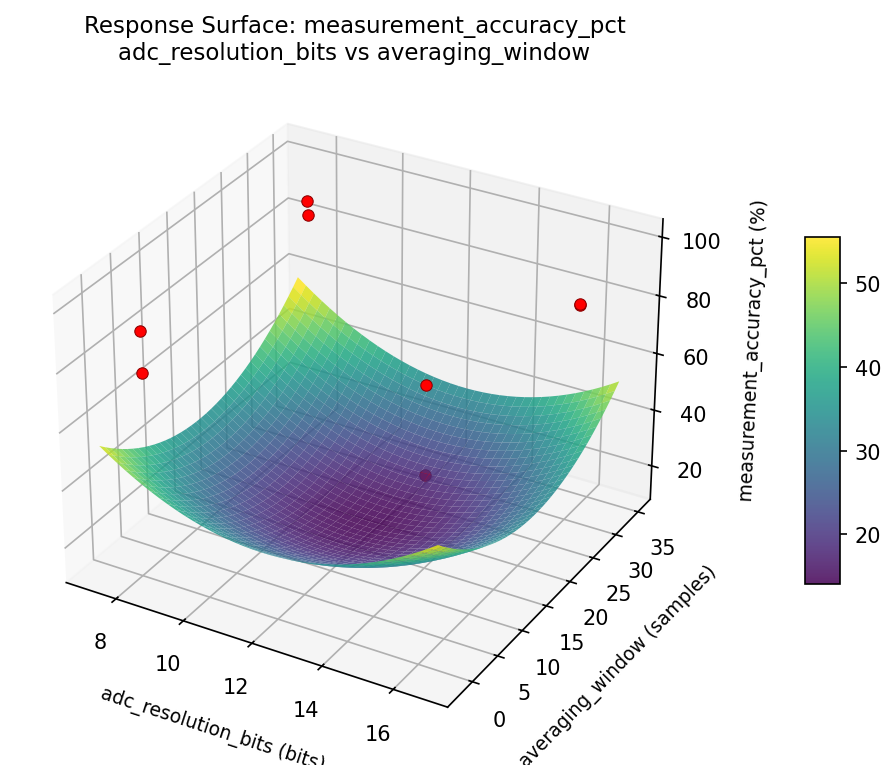
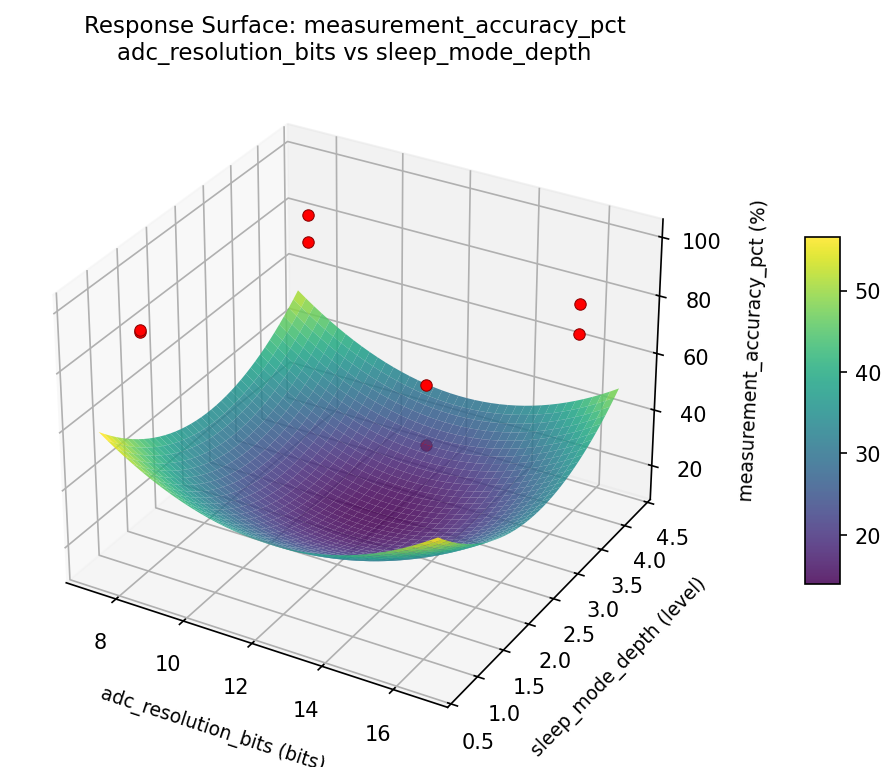
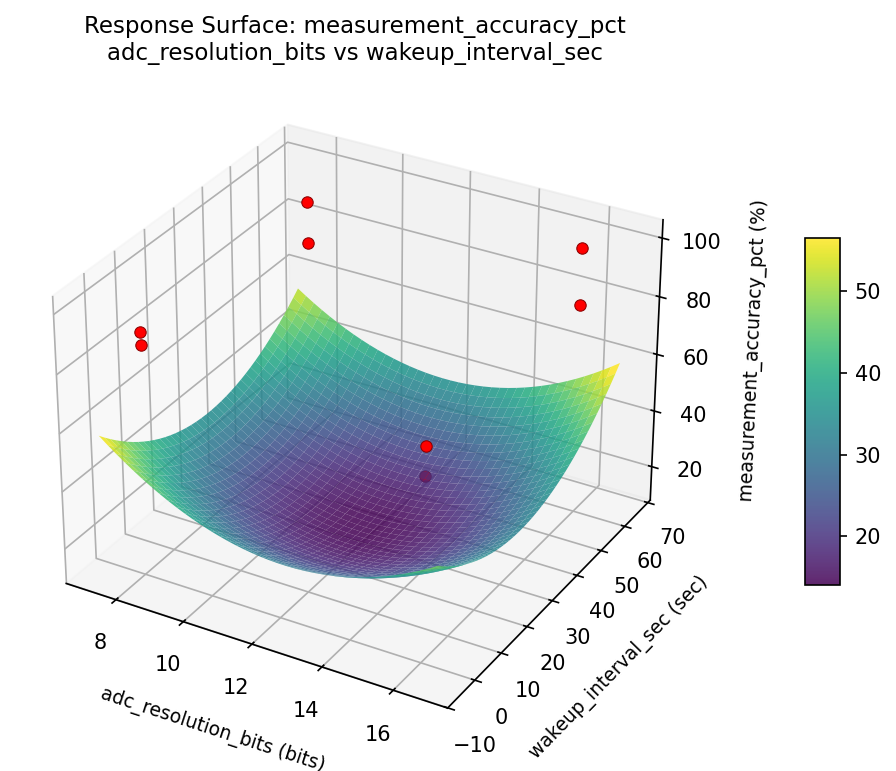
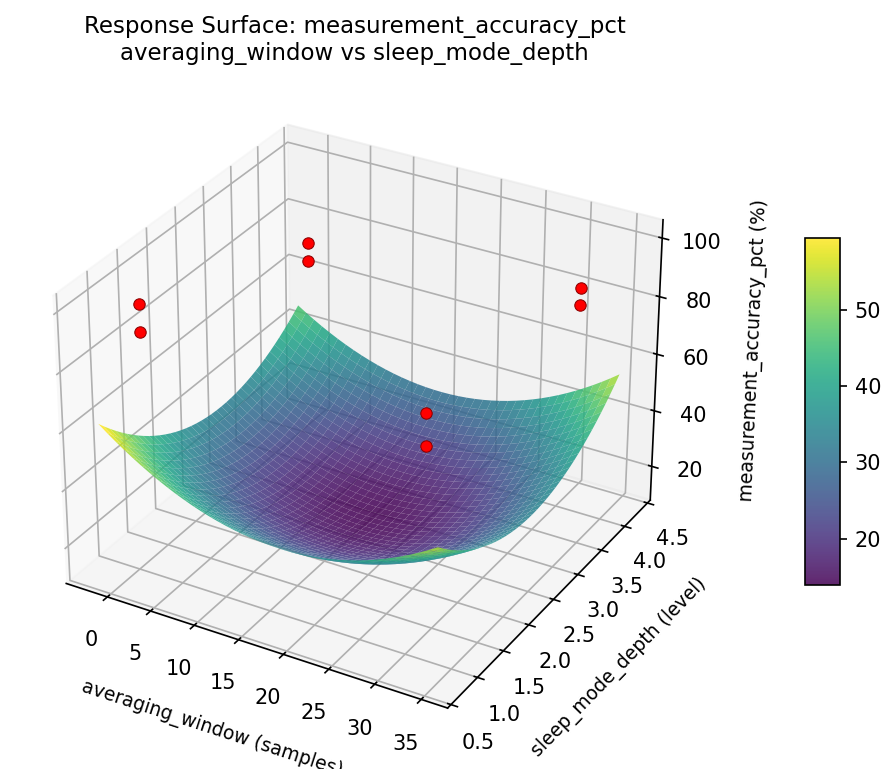
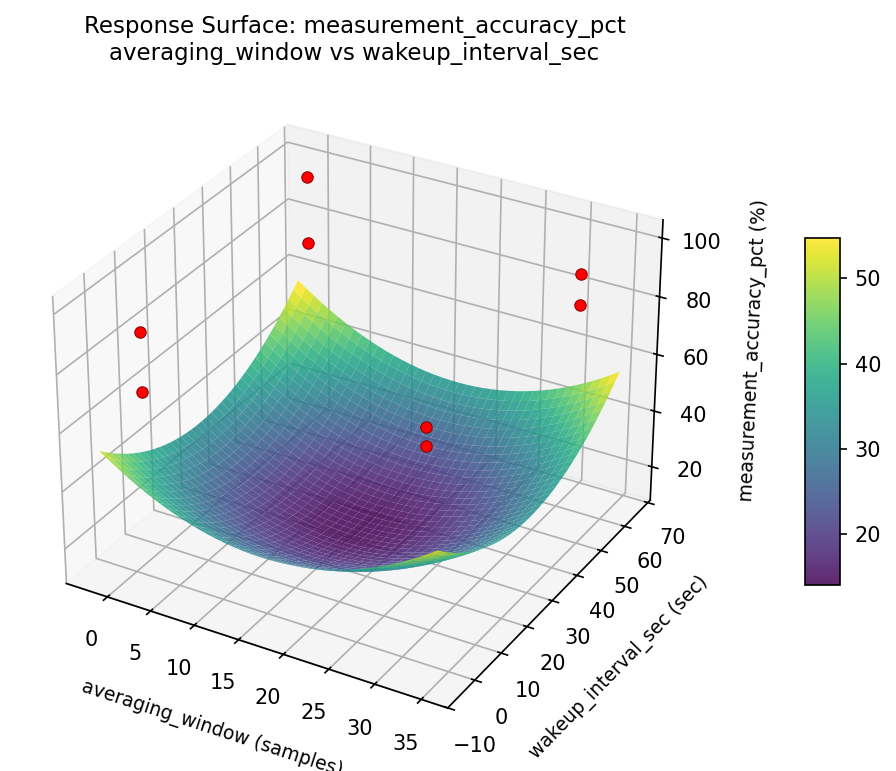
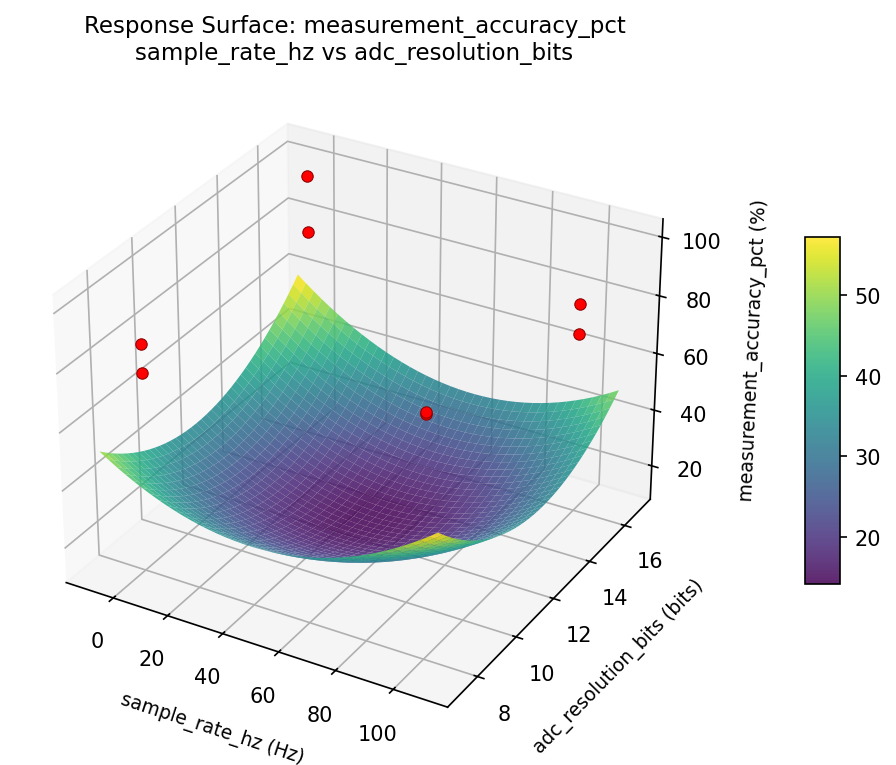
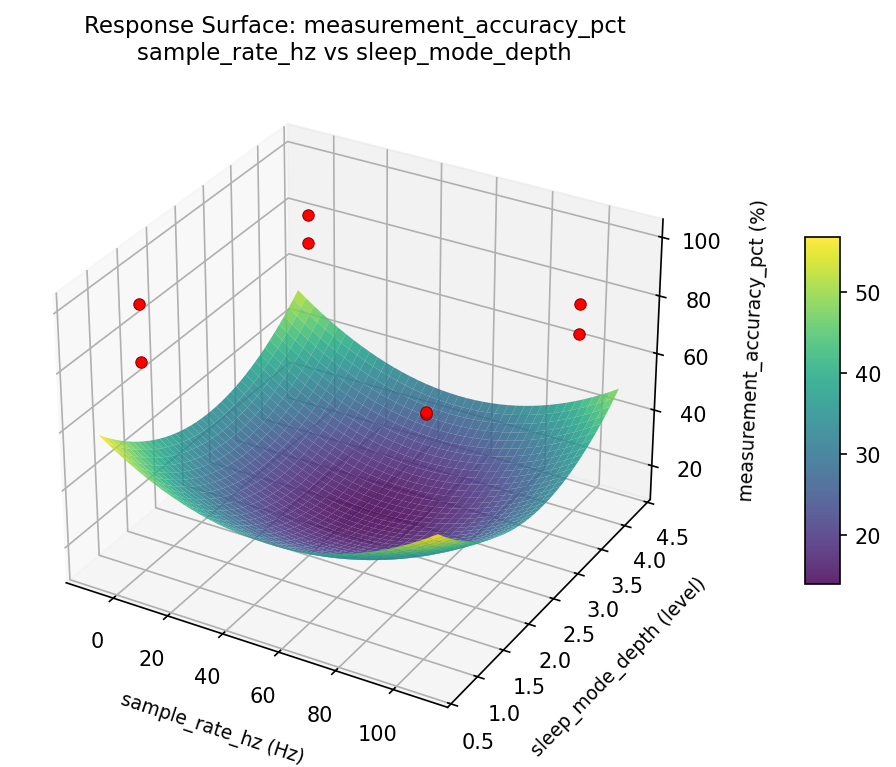
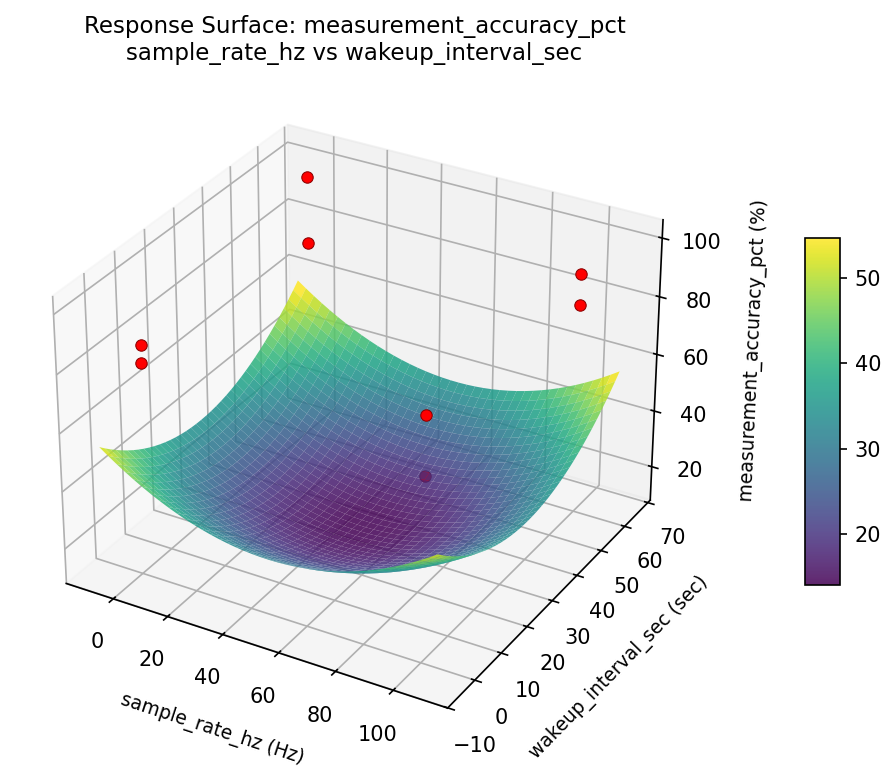
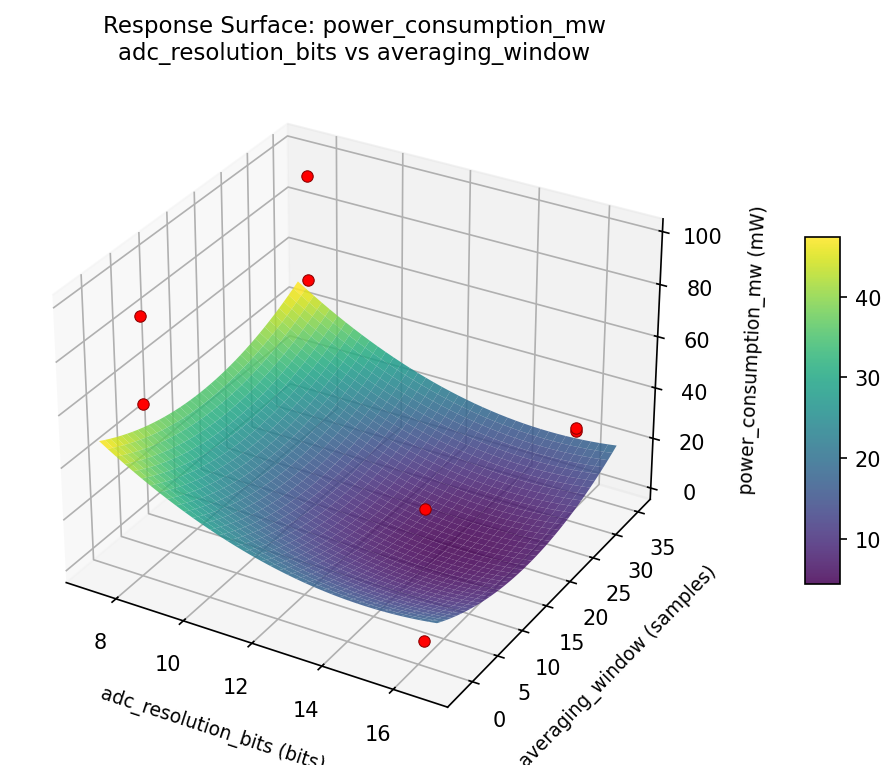
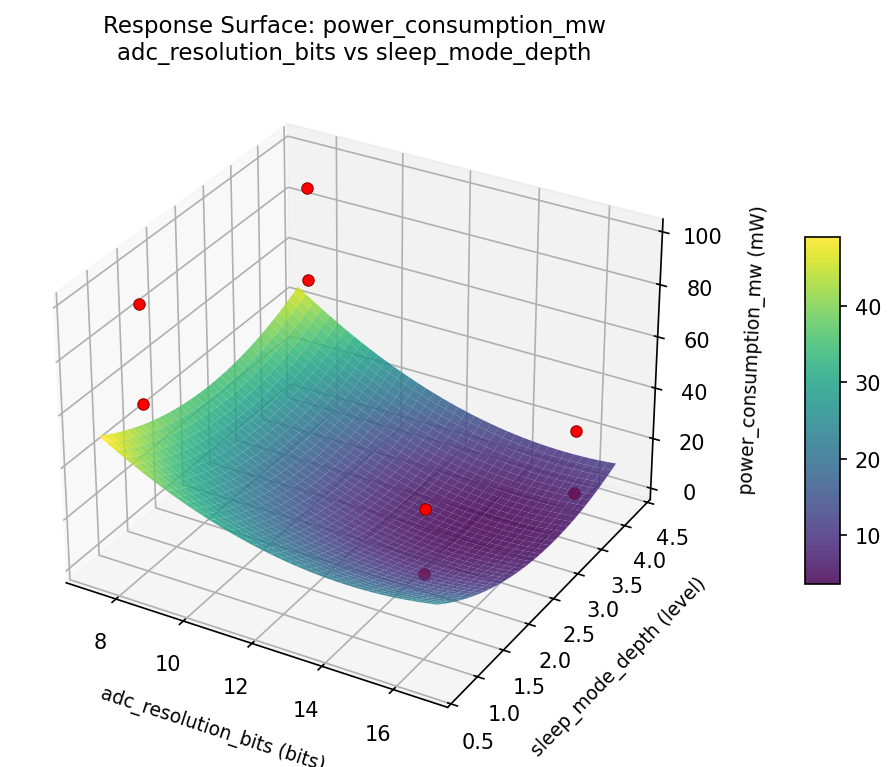
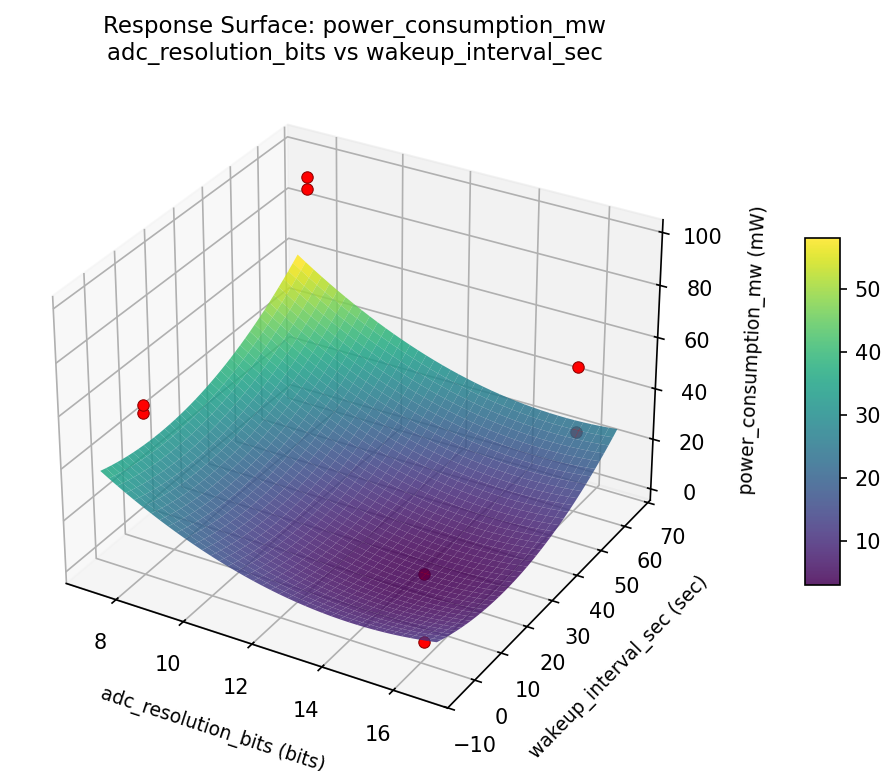
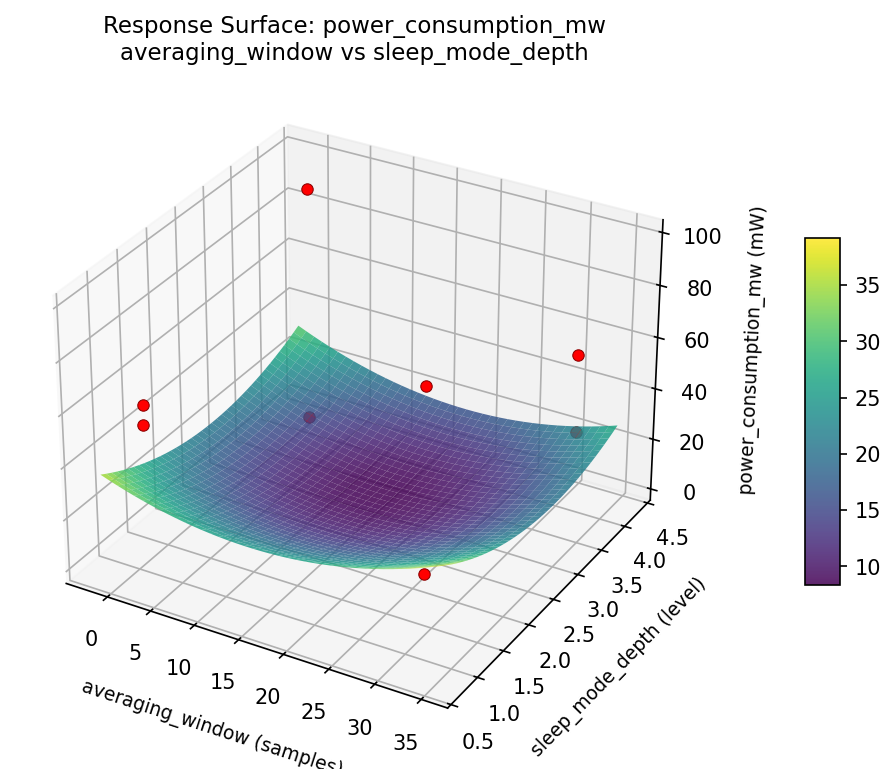
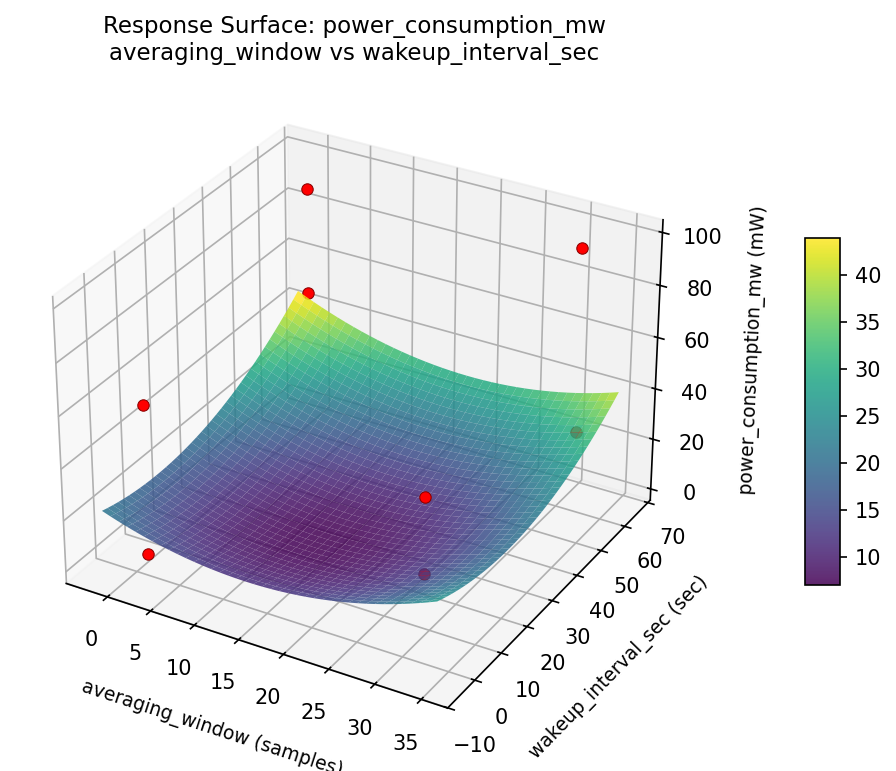
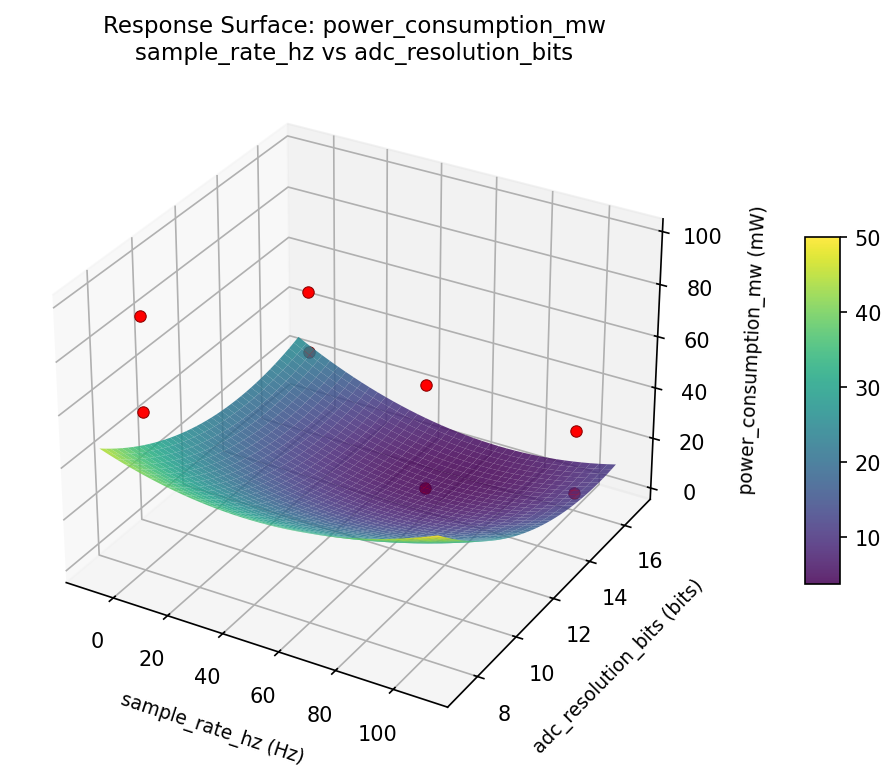
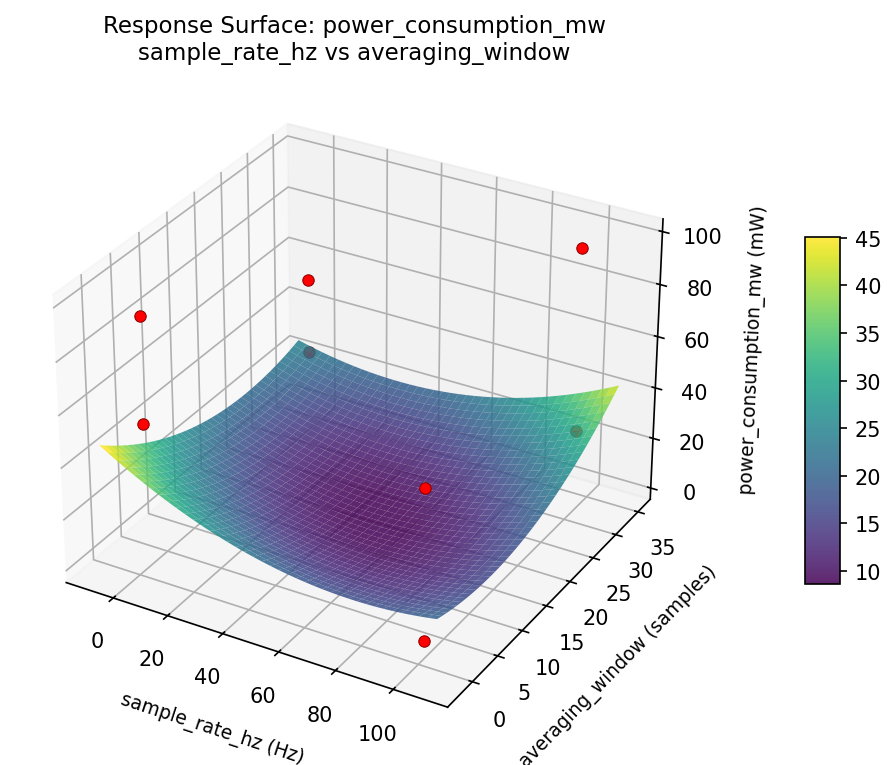
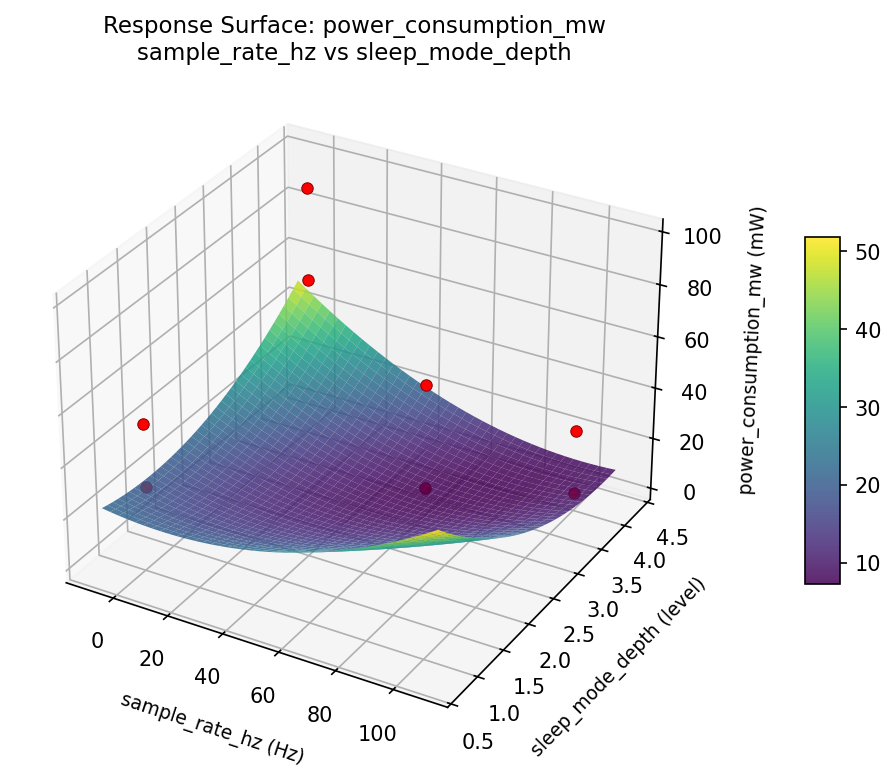
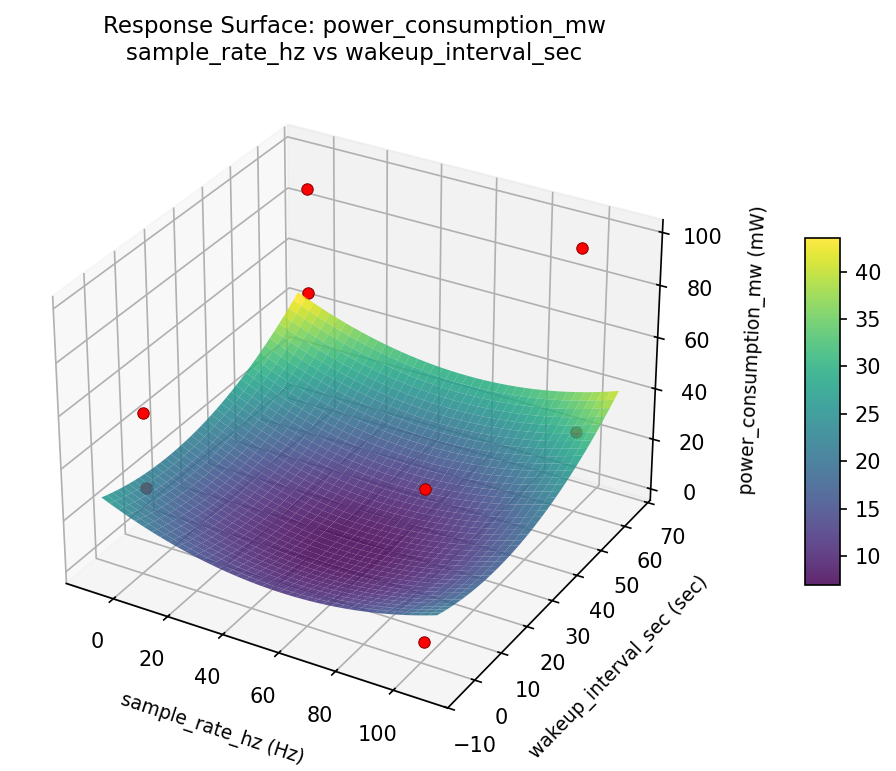
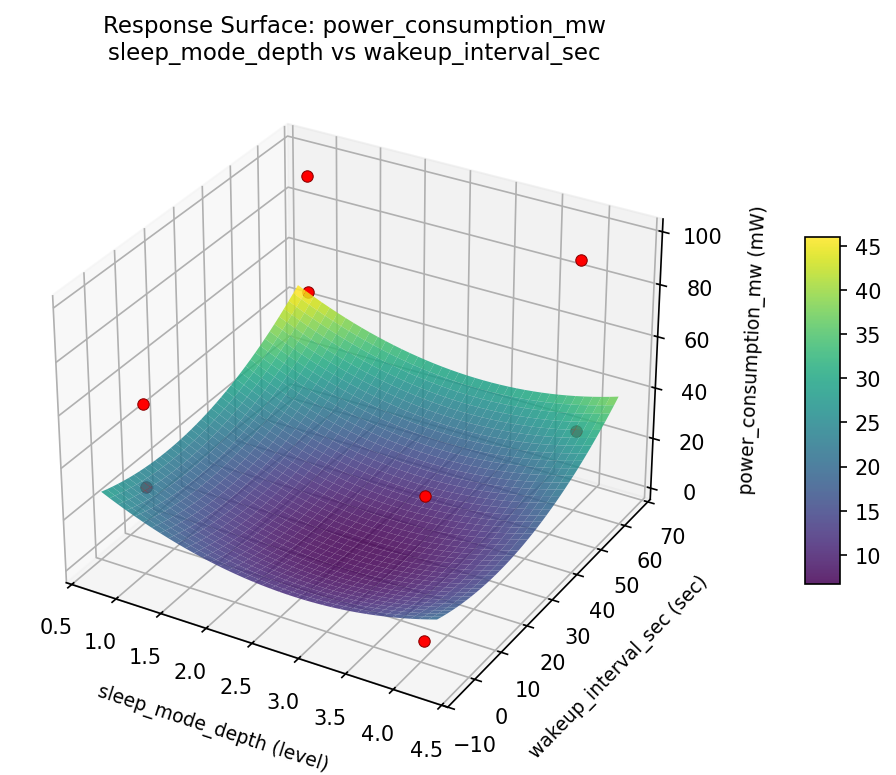
Response Surface Plots
3D surfaces fitted with quadratic RSM. Red dots are observed data points.
measurement accuracy pct adc resolution bits vs averaging window
measurement accuracy pct adc resolution bits vs sleep mode depth
measurement accuracy pct adc resolution bits vs wakeup interval sec
measurement accuracy pct averaging window vs sleep mode depth
measurement accuracy pct averaging window vs wakeup interval sec
measurement accuracy pct sample rate hz vs adc resolution bits
measurement accuracy pct sample rate hz vs averaging window

measurement accuracy pct sample rate hz vs sleep mode depth
measurement accuracy pct sample rate hz vs wakeup interval sec
measurement accuracy pct sleep mode depth vs wakeup interval sec

power consumption mw adc resolution bits vs averaging window
power consumption mw adc resolution bits vs sleep mode depth
power consumption mw adc resolution bits vs wakeup interval sec
power consumption mw averaging window vs sleep mode depth
power consumption mw averaging window vs wakeup interval sec
power consumption mw sample rate hz vs adc resolution bits
power consumption mw sample rate hz vs averaging window
power consumption mw sample rate hz vs sleep mode depth
power consumption mw sample rate hz vs wakeup interval sec
power consumption mw sleep mode depth vs wakeup interval sec
Multi-Objective Optimization
When responses compete, Derringer–Suich desirability finds the best compromise.
Each response is scaled to a 0–1 desirability, then combined via a weighted geometric mean.
Overall Desirability
D = 0.7227
Per-Response Desirability
| Response | Weight | Desirability | Predicted | Dir |
|---|
measurement_accuracy_pct |
1.5 |
|
99.90 0.9545 99.90 % |
↑ |
power_consumption_mw |
1.0 |
|
52.60 0.4762 52.60 mW |
↓ |
Recommended Settings
| Factor | Value |
|---|
sample_rate_hz | 100 Hz |
adc_resolution_bits | 16 bits |
averaging_window | 32 samples |
sleep_mode_depth | 4 level |
wakeup_interval_sec | 60 sec |
Source: from observed run #4
Trade-off Summary
Sacrifice = how much worse than single-objective best.
| Response | Predicted | Best Observed | Sacrifice |
|---|
power_consumption_mw | 52.60 | 2.40 | +50.20 |
Top 3 Runs by Desirability
| Run | D | Factor Settings |
|---|
| #1 | 0.5451 | sample_rate_hz=1, adc_resolution_bits=16, averaging_window=1, sleep_mode_depth=1, wakeup_interval_sec=60 |
| #6 | 0.4933 | sample_rate_hz=1, adc_resolution_bits=16, averaging_window=32, sleep_mode_depth=1, wakeup_interval_sec=1 |
Model Quality
| Response | R² | Type |
|---|
power_consumption_mw | 0.9000 | linear |
Full Multi-Objective Output
============================================================
MULTI-OBJECTIVE OPTIMIZATION
Method: Derringer-Suich Desirability Function
============================================================
Overall desirability: D = 0.7227
Response Weight Desirability Predicted Direction
---------------------------------------------------------------------
measurement_accuracy_pct 1.5 0.9545 99.90 % ↑
power_consumption_mw 1.0 0.4762 52.60 mW ↓
Recommended settings:
sample_rate_hz = 100 Hz
adc_resolution_bits = 16 bits
averaging_window = 32 samples
sleep_mode_depth = 4 level
wakeup_interval_sec = 60 sec
(from observed run #4)
Trade-off summary:
measurement_accuracy_pct: 99.90 (best observed: 99.90, sacrifice: +0.00)
power_consumption_mw: 52.60 (best observed: 2.40, sacrifice: +50.20)
Model quality:
measurement_accuracy_pct: R² = 0.2055 (linear)
power_consumption_mw: R² = 0.9000 (linear)
Top 3 observed runs by overall desirability:
1. Run #4 (D=0.7227): sample_rate_hz=100, adc_resolution_bits=16, averaging_window=32, sleep_mode_depth=4, wakeup_interval_sec=60
2. Run #1 (D=0.5451): sample_rate_hz=1, adc_resolution_bits=16, averaging_window=1, sleep_mode_depth=1, wakeup_interval_sec=60
3. Run #6 (D=0.4933): sample_rate_hz=1, adc_resolution_bits=16, averaging_window=32, sleep_mode_depth=1, wakeup_interval_sec=1
Full Analysis Output
=== Main Effects: measurement_accuracy_pct ===
Factor Effect Std Error % Contribution
--------------------------------------------------------------
wakeup_interval_sec -12.0500 3.2998 50.1%
averaging_window 9.5500 3.2998 39.7%
adc_resolution_bits -1.8500 3.2998 7.7%
sleep_mode_depth 0.3500 3.2998 1.5%
sample_rate_hz 0.2500 3.2998 1.0%
=== ANOVA Table: measurement_accuracy_pct ===
Source DF SS MS F p-value
-----------------------------------------------------------------------------
sample_rate_hz 1 0.1250 0.1250 0.667 0.4513
adc_resolution_bits 1 6.8450 6.8450 36.507 0.0018
averaging_window 1 182.4050 182.4050 972.827 0.0000
sleep_mode_depth 1 0.2450 0.2450 1.307 0.3048
wakeup_interval_sec 1 290.4050 290.4050 1548.827 0.0000
sample_rate_hz*adc_resolution_bits 1 0.2450 0.2450 1.307 0.3048
sample_rate_hz*averaging_window 1 290.4050 290.4050 1548.827 0.0000
sample_rate_hz*sleep_mode_depth 1 6.8450 6.8450 36.507 0.0018
sample_rate_hz*wakeup_interval_sec 1 182.4050 182.4050 972.827 0.0000
adc_resolution_bits*averaging_window 1 0.1250 0.1250 0.667 0.4513
adc_resolution_bits*sleep_mode_depth 1 0.1250 0.1250 0.667 0.4513
adc_resolution_bits*wakeup_interval_sec 1 129.6050 129.6050 691.227 0.0000
averaging_window*sleep_mode_depth 1 129.6050 129.6050 691.227 0.0000
averaging_window*wakeup_interval_sec 1 0.1250 0.1250 0.667 0.4513
sleep_mode_depth*wakeup_interval_sec 1 0.1250 0.1250 0.667 0.4513
Error (Lenth PSE) 5 0.9375 0.1875
Total 7 609.7550 87.1079
Note: Error estimated using Lenth's pseudo-standard-error (unreplicated design)
=== Interaction Effects: measurement_accuracy_pct ===
Factor A Factor B Interaction % Contribution
------------------------------------------------------------------------
sample_rate_hz averaging_window -12.0500 29.5%
sample_rate_hz wakeup_interval_sec 9.5500 23.3%
adc_resolution_bits wakeup_interval_sec 8.0500 19.7%
averaging_window sleep_mode_depth -8.0500 19.7%
sample_rate_hz sleep_mode_depth 1.8500 4.5%
sample_rate_hz adc_resolution_bits -0.3500 0.9%
adc_resolution_bits averaging_window 0.2500 0.6%
adc_resolution_bits sleep_mode_depth -0.2500 0.6%
averaging_window wakeup_interval_sec 0.2500 0.6%
sleep_mode_depth wakeup_interval_sec -0.2500 0.6%
=== Summary Statistics: measurement_accuracy_pct ===
sample_rate_hz:
Level N Mean Std Min Max
------------------------------------------------------------
1 4 84.4500 13.2872 70.5000 99.9000
100 4 84.7000 5.1633 80.4000 91.2000
adc_resolution_bits:
Level N Mean Std Min Max
------------------------------------------------------------
16 4 85.5000 12.7914 70.5000 99.9000
8 4 83.6500 6.1115 76.8000 90.6000
averaging_window:
Level N Mean Std Min Max
------------------------------------------------------------
1 4 79.8000 8.6845 70.5000 91.2000
32 4 89.3500 8.1872 80.4000 99.9000
sleep_mode_depth:
Level N Mean Std Min Max
------------------------------------------------------------
1 4 84.4000 12.2687 70.5000 99.9000
4 4 84.7500 7.2560 76.8000 91.2000
wakeup_interval_sec:
Level N Mean Std Min Max
------------------------------------------------------------
1 4 90.6000 7.8498 80.7000 99.9000
60 4 78.5500 6.6955 70.5000 86.5000
=== Main Effects: power_consumption_mw ===
Factor Effect Std Error % Contribution
--------------------------------------------------------------
sleep_mode_depth 35.0000 11.5876 50.4%
adc_resolution_bits 14.2500 11.5876 20.5%
wakeup_interval_sec -14.1500 11.5876 20.4%
averaging_window -5.5000 11.5876 7.9%
sample_rate_hz 0.6000 11.5876 0.9%
=== ANOVA Table: power_consumption_mw ===
Source DF SS MS F p-value
-----------------------------------------------------------------------------
sample_rate_hz 1 0.7200 0.7200 0.008 0.9325
adc_resolution_bits 1 406.1250 406.1250 4.475 0.0880
averaging_window 1 60.5000 60.5000 0.667 0.4513
sleep_mode_depth 1 2450.0000 2450.0000 26.997 0.0035
wakeup_interval_sec 1 400.4450 400.4450 4.413 0.0897
sample_rate_hz*adc_resolution_bits 1 2450.0000 2450.0000 26.997 0.0035
sample_rate_hz*averaging_window 1 400.4450 400.4450 4.413 0.0897
sample_rate_hz*sleep_mode_depth 1 406.1250 406.1250 4.475 0.0880
sample_rate_hz*wakeup_interval_sec 1 60.5000 60.5000 0.667 0.4513
adc_resolution_bits*averaging_window 1 33.6200 33.6200 0.370 0.5693
adc_resolution_bits*sleep_mode_depth 1 0.7200 0.7200 0.008 0.9325
adc_resolution_bits*wakeup_interval_sec 1 4167.8450 4167.8450 45.927 0.0011
averaging_window*sleep_mode_depth 1 4167.8450 4167.8450 45.927 0.0011
averaging_window*wakeup_interval_sec 1 0.7200 0.7200 0.008 0.9325
sleep_mode_depth*wakeup_interval_sec 1 33.6200 33.6200 0.370 0.5693
Error (Lenth PSE) 5 453.7500 90.7500
Total 7 7519.2550 1074.1793
Note: Error estimated using Lenth's pseudo-standard-error (unreplicated design)
=== Interaction Effects: power_consumption_mw ===
Factor A Factor B Interaction % Contribution
------------------------------------------------------------------------
adc_resolution_bits wakeup_interval_sec 45.6500 26.9%
averaging_window sleep_mode_depth -45.6500 26.9%
sample_rate_hz adc_resolution_bits -35.0000 20.6%
sample_rate_hz sleep_mode_depth -14.2500 8.4%
sample_rate_hz averaging_window -14.1500 8.3%
sample_rate_hz wakeup_interval_sec -5.5000 3.2%
adc_resolution_bits averaging_window 4.1000 2.4%
sleep_mode_depth wakeup_interval_sec -4.1000 2.4%
adc_resolution_bits sleep_mode_depth -0.6000 0.4%
averaging_window wakeup_interval_sec 0.6000 0.4%
=== Summary Statistics: power_consumption_mw ===
sample_rate_hz:
Level N Mean Std Min Max
------------------------------------------------------------
1 4 52.1250 37.5357 2.4000 93.2000
100 4 52.7250 33.1248 27.3000 97.8000
adc_resolution_bits:
Level N Mean Std Min Max
------------------------------------------------------------
16 4 45.3000 40.5609 2.4000 97.8000
8 4 59.5500 26.9417 27.3000 93.2000
averaging_window:
Level N Mean Std Min Max
------------------------------------------------------------
1 4 55.1750 47.6970 2.4000 97.8000
32 4 49.6750 14.5344 28.4000 60.3000
sleep_mode_depth:
Level N Mean Std Min Max
------------------------------------------------------------
1 4 34.9250 25.3873 2.4000 57.4000
4 4 69.9250 32.3301 28.4000 97.8000
wakeup_interval_sec:
Level N Mean Std Min Max
------------------------------------------------------------
1 4 59.5000 29.1661 27.3000 97.8000
60 4 45.3500 39.0164 2.4000 93.2000
Optimization Recommendations
=== Optimization: measurement_accuracy_pct ===
Direction: maximize
Best observed run: #4
sample_rate_hz = 1
adc_resolution_bits = 8
averaging_window = 1
sleep_mode_depth = 4
wakeup_interval_sec = 60
Value: 99.9
RSM Model (linear, R² = 0.4450, Adj R² = -0.9426):
Coefficients:
intercept +84.5750
sample_rate_hz -2.5000
adc_resolution_bits +2.6000
averaging_window -0.7750
sleep_mode_depth +3.8750
wakeup_interval_sec +2.3000
Predicted optimum (from linear model, at observed points):
sample_rate_hz = 1
adc_resolution_bits = 8
averaging_window = 1
sleep_mode_depth = 4
wakeup_interval_sec = 60
Predicted value: 91.4250
Surface optimum (via L-BFGS-B, linear model):
sample_rate_hz = 1
adc_resolution_bits = 16
averaging_window = 1
sleep_mode_depth = 4
wakeup_interval_sec = 60
Predicted value: 96.6250
Model quality: Weak fit — consider adding center points or using a different design.
Factor importance:
1. sleep_mode_depth (effect: 7.8, contribution: 32.2%)
2. adc_resolution_bits (effect: -5.2, contribution: 21.6%)
3. sample_rate_hz (effect: -5.0, contribution: 20.7%)
4. wakeup_interval_sec (effect: 4.6, contribution: 19.1%)
5. averaging_window (effect: -1.5, contribution: 6.4%)
=== Optimization: power_consumption_mw ===
Direction: minimize
Best observed run: #7
sample_rate_hz = 100
adc_resolution_bits = 8
averaging_window = 1
sleep_mode_depth = 1
wakeup_interval_sec = 1
Value: 2.4
RSM Model (linear, R² = 0.9467, Adj R² = 0.8135):
Coefficients:
intercept +52.4250
sample_rate_hz -15.5750
adc_resolution_bits +8.5500
averaging_window +16.5000
sleep_mode_depth +13.4500
wakeup_interval_sec -11.0000
Predicted optimum (from linear model, at observed points):
sample_rate_hz = 1
adc_resolution_bits = 8
averaging_window = 32
sleep_mode_depth = 4
wakeup_interval_sec = 1
Predicted value: 100.4000
Surface optimum (via L-BFGS-B, linear model):
sample_rate_hz = 100
adc_resolution_bits = 8
averaging_window = 1
sleep_mode_depth = 1
wakeup_interval_sec = 60
Predicted value: -12.6500
Model quality: Excellent fit — surface predictions are reliable.
Factor importance:
1. averaging_window (effect: 33.0, contribution: 25.4%)
2. sample_rate_hz (effect: -31.1, contribution: 23.9%)
3. sleep_mode_depth (effect: 26.9, contribution: 20.7%)
4. wakeup_interval_sec (effect: -22.0, contribution: 16.9%)
5. adc_resolution_bits (effect: -17.1, contribution: 13.1%)