Summary
This experiment investigates mqtt broker tuning. Latin Hypercube exploration of 4 MQTT broker parameters for message throughput and memory usage.
The design varies 4 factors: max connections (conns), ranging from 100 to 10000, message queue depth (msgs), ranging from 100 to 5000, keepalive sec (sec), ranging from 15 to 300, and qos level, ranging from 0 to 2. The goal is to optimize 2 responses: message throughput kps (kmsg/s) (maximize) and memory usage mb (MB) (minimize). Fixed conditions held constant across all runs include broker = mosquitto, protocol = mqtt_v5.
Latin Hypercube Sampling was used to space 10 runs across the 4-dimensional factor space with good coverage and minimal gaps, making it ideal for computer experiments where the response surface may be complex.
Key Findings
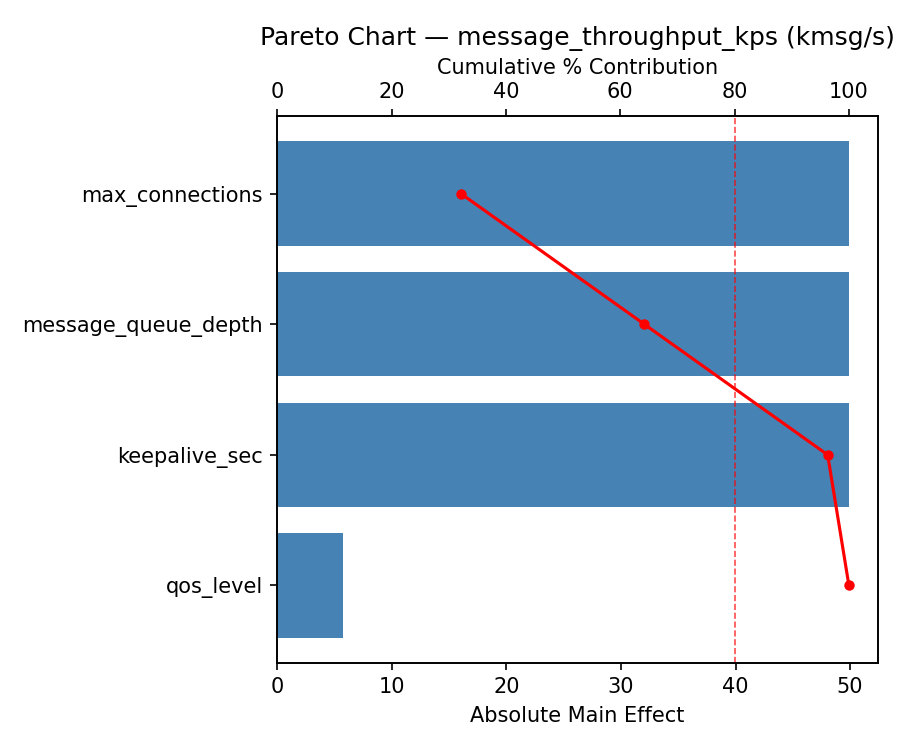
For message throughput kps, the most influential factors were max connections (33.2%), message queue depth (33.2%), keepalive sec (33.2%). The best observed value was 73.4 (at max connections = 6829.26, message queue depth = 3528.83, keepalive sec = 200.578).
For memory usage mb, the most influential factors were max connections (32.9%), message queue depth (32.9%), keepalive sec (32.9%). The best observed value was 92.0 (at max connections = 7351.69, message queue depth = 245.886, keepalive sec = 244.791).
Recommended Next Steps
- Consider whether any fixed factors should be varied in a future study.
Experimental Setup
Factors
| Factor | Low | High | Unit |
|---|
max_connections | 100 | 10000 | conns |
message_queue_depth | 100 | 5000 | msgs |
keepalive_sec | 15 | 300 | sec |
qos_level | 0 | 2 | |
Fixed: broker = mosquitto, protocol = mqtt_v5
Responses
| Response | Direction | Unit |
|---|
message_throughput_kps | ↑ maximize | kmsg/s |
memory_usage_mb | ↓ minimize | MB |
Configuration
{
"metadata": {
"name": "MQTT Broker Tuning",
"description": "Latin Hypercube exploration of 4 MQTT broker parameters for message throughput and memory usage"
},
"factors": [
{
"name": "max_connections",
"levels": [
"100",
"10000"
],
"type": "continuous",
"unit": "conns"
},
{
"name": "message_queue_depth",
"levels": [
"100",
"5000"
],
"type": "continuous",
"unit": "msgs"
},
{
"name": "keepalive_sec",
"levels": [
"15",
"300"
],
"type": "continuous",
"unit": "sec"
},
{
"name": "qos_level",
"levels": [
"0",
"2"
],
"type": "categorical",
"unit": ""
}
],
"fixed_factors": {
"broker": "mosquitto",
"protocol": "mqtt_v5"
},
"responses": [
{
"name": "message_throughput_kps",
"optimize": "maximize",
"unit": "kmsg/s"
},
{
"name": "memory_usage_mb",
"optimize": "minimize",
"unit": "MB"
}
],
"settings": {
"operation": "latin_hypercube",
"test_script": "use_cases/72_mqtt_broker_tuning/sim.sh"
}
}
Experimental Matrix
The Latin Hypercube Design produces 10 runs. Each row is one experiment with specific factor settings.
| Run | max_connections | message_queue_depth | keepalive_sec | qos_level |
|---|
| 1 | 2016.92 | 1643.39 | 194.36 | 0 |
| 2 | 3383.63 | 3636.1 | 259.741 | 2 |
| 3 | 6763.43 | 3055.73 | 102.771 | 0 |
| 4 | 9144.5 | 616.621 | 229.959 | 2 |
| 5 | 2341 | 4173.03 | 154.968 | 0 |
| 6 | 5080.13 | 408.814 | 74.6152 | 2 |
| 7 | 7571.55 | 4601.83 | 282.55 | 0 |
| 8 | 1079.9 | 2170.77 | 169.247 | 2 |
| 9 | 8442.25 | 1173.44 | 42.1958 | 2 |
| 10 | 4387.23 | 2915.9 | 48.1618 | 0 |
Step-by-Step Workflow
1
Preview the design
$ doe info --config use_cases/72_mqtt_broker_tuning/config.json
2
Generate the runner script
$ doe generate --config use_cases/72_mqtt_broker_tuning/config.json \
--output use_cases/72_mqtt_broker_tuning/results/run.sh --seed 42
3
Execute the experiments
$ bash use_cases/72_mqtt_broker_tuning/results/run.sh
4
Analyze results
$ doe analyze --config use_cases/72_mqtt_broker_tuning/config.json
5
Get optimization recommendations
$ doe optimize --config use_cases/72_mqtt_broker_tuning/config.json
6
Multi-objective optimization
With 2 competing responses, use --multi to find the best compromise via Derringer–Suich desirability.
$ doe optimize --config use_cases/72_mqtt_broker_tuning/config.json --multi
7
Generate the HTML report
$ doe report --config use_cases/72_mqtt_broker_tuning/config.json \
--output use_cases/72_mqtt_broker_tuning/results/report.html
Features Exercised
| Feature | Value |
|---|
| Design type | latin_hypercube |
| Factor types | continuous (3), categorical (1) |
| Arg style | double-dash |
| Responses | 2 (message_throughput_kps ↑, memory_usage_mb ↓) |
| Total runs | 10 |
Analysis Results
Generated from actual experiment runs using the DOE Helper Tool.
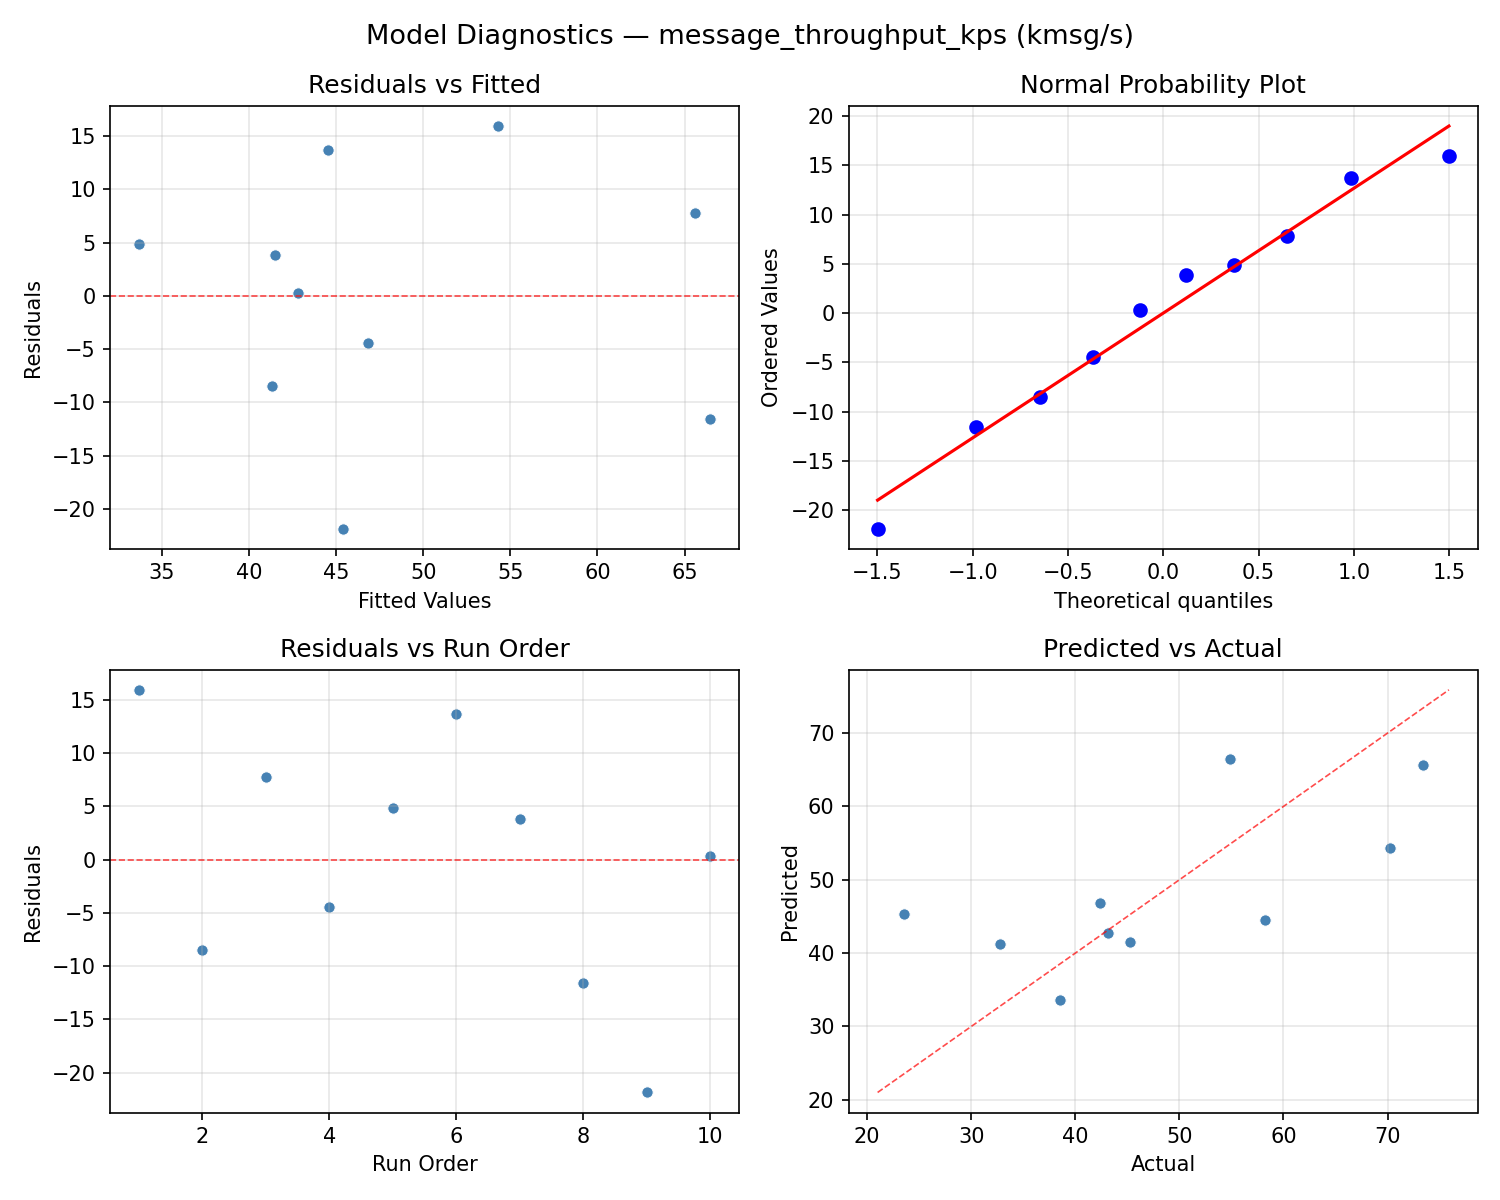
Response: message_throughput_kps
Top factors: max_connections (33.2%), message_queue_depth (33.2%), keepalive_sec (33.2%).
ANOVA
| Source | DF | SS | MS | F | p-value |
|---|
| Source | DF | SS | MS | F | p-value |
| max_connections | 9 | 2273.3210 | 252.5912 | 318.325 | 0.0435 |
| message_queue_depth | 9 | 2273.3210 | 252.5912 | 318.325 | 0.0435 |
| keepalive_sec | 9 | 2273.3210 | 252.5912 | 318.325 | 0.0435 |
| qos_level | 1 | 0.5290 | 0.5290 | 0.667 | 0.5641 |
| Error | (Lenth | PSE) | 1 | 0.7935 | 0.7935 |
| Total | 9 | 2273.3210 | 252.5912 | | |
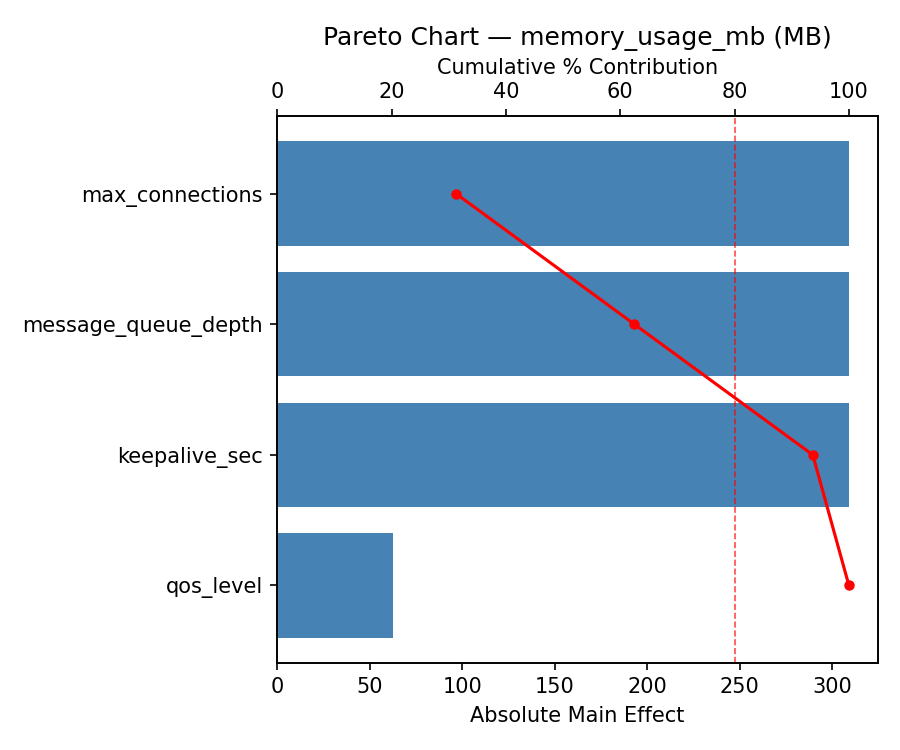
Pareto Chart
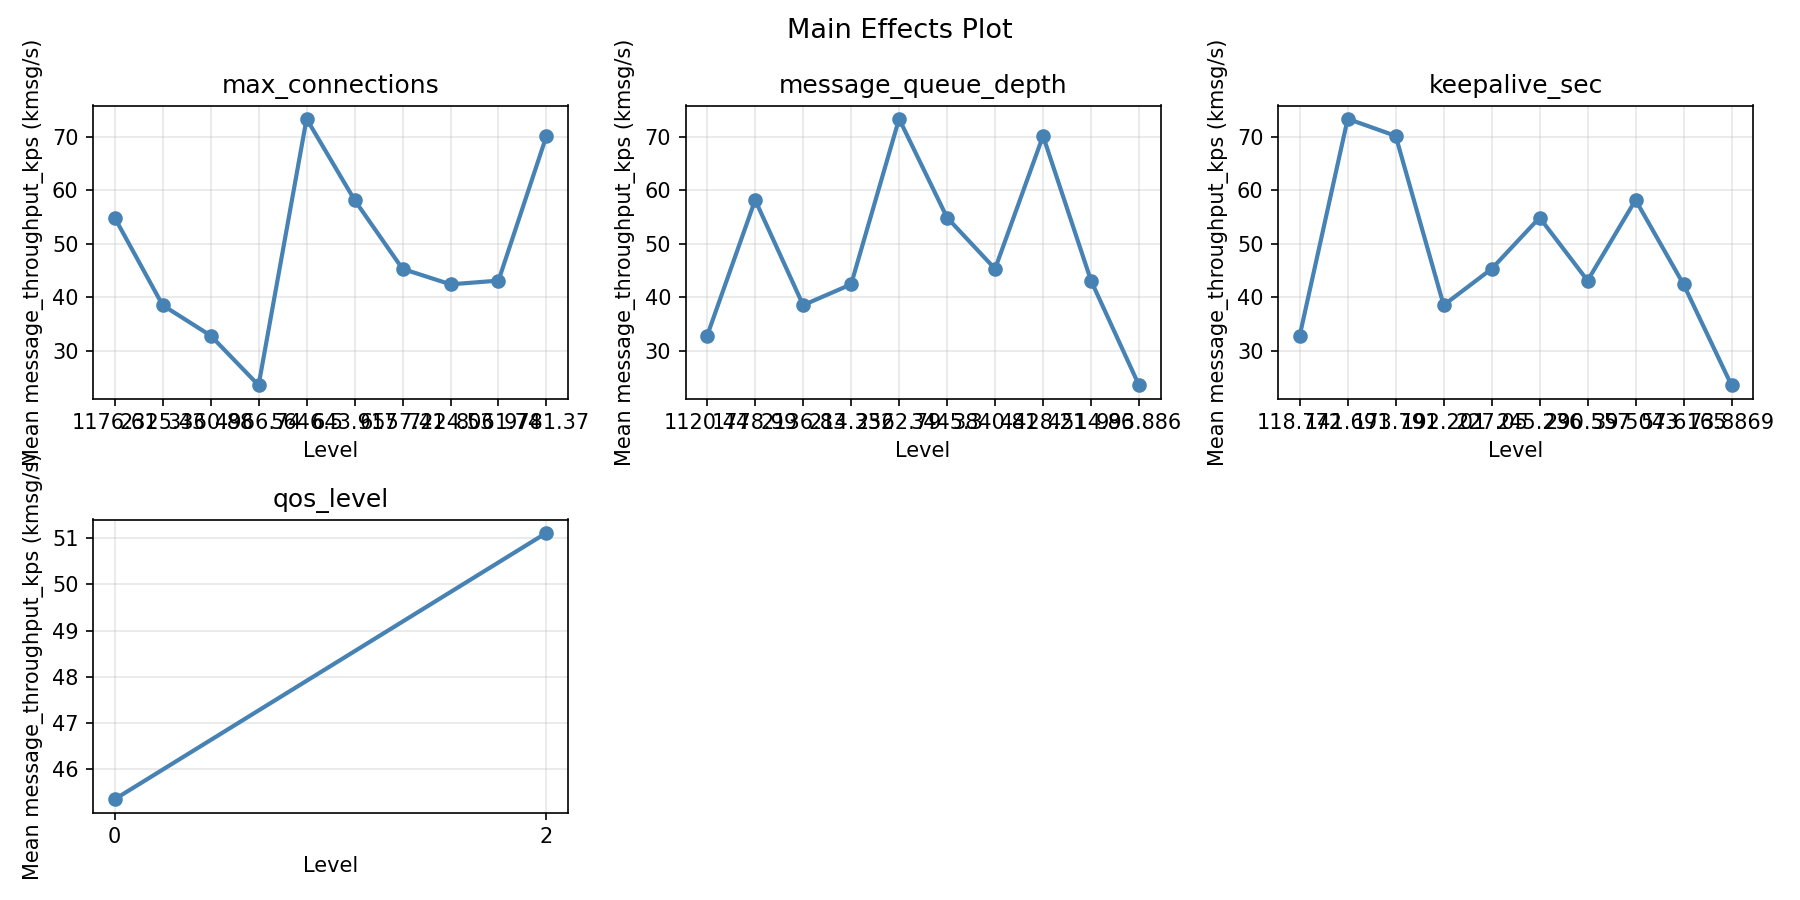
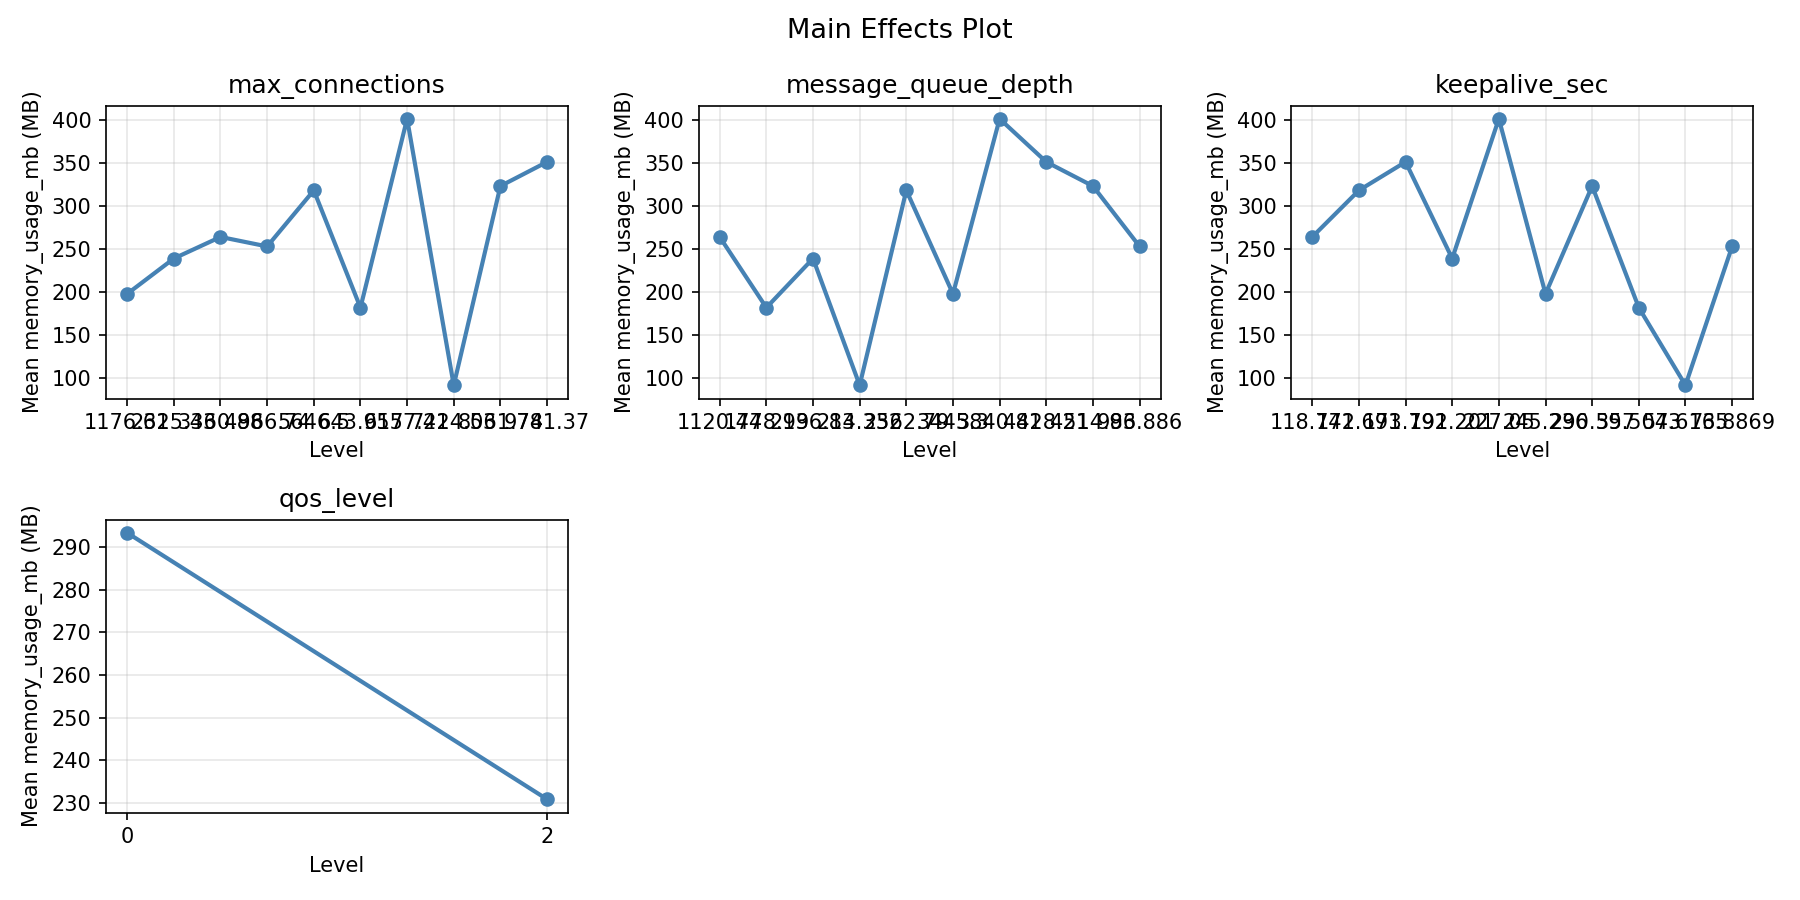
Main Effects Plot
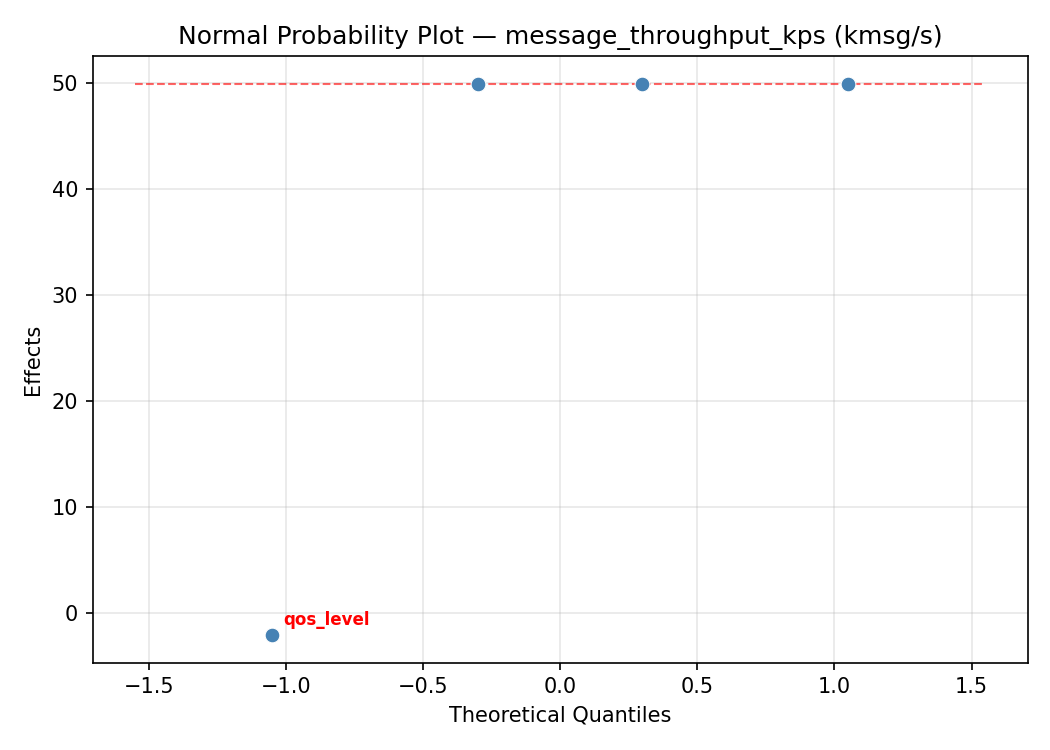
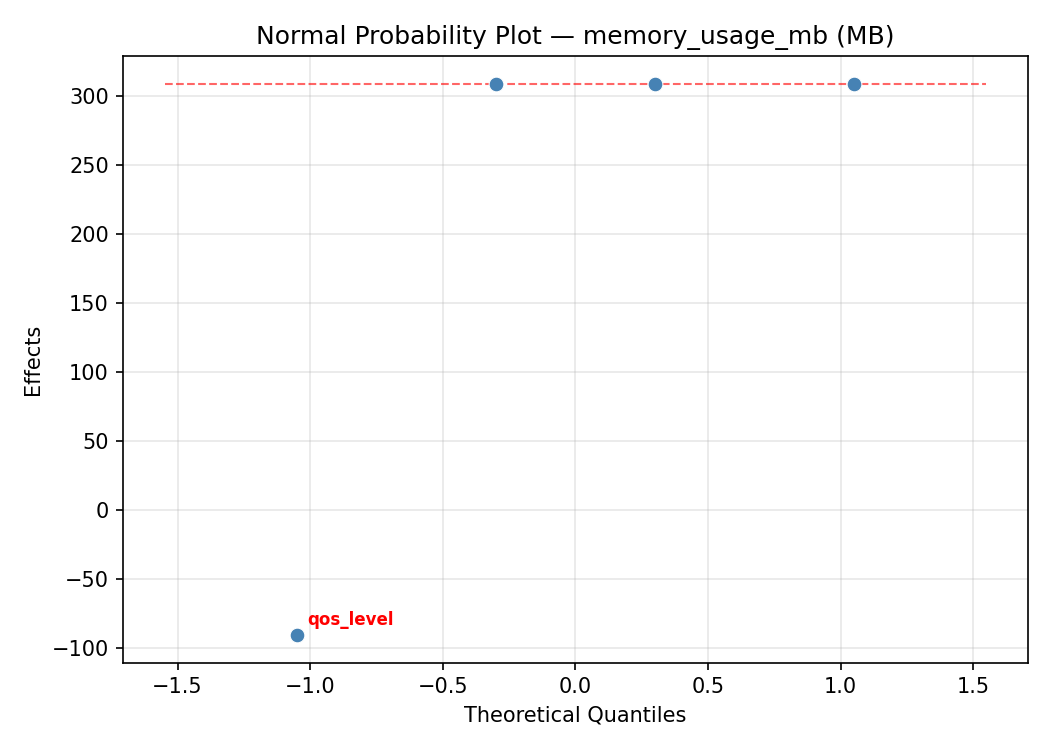
Normal Probability Plot of Effects
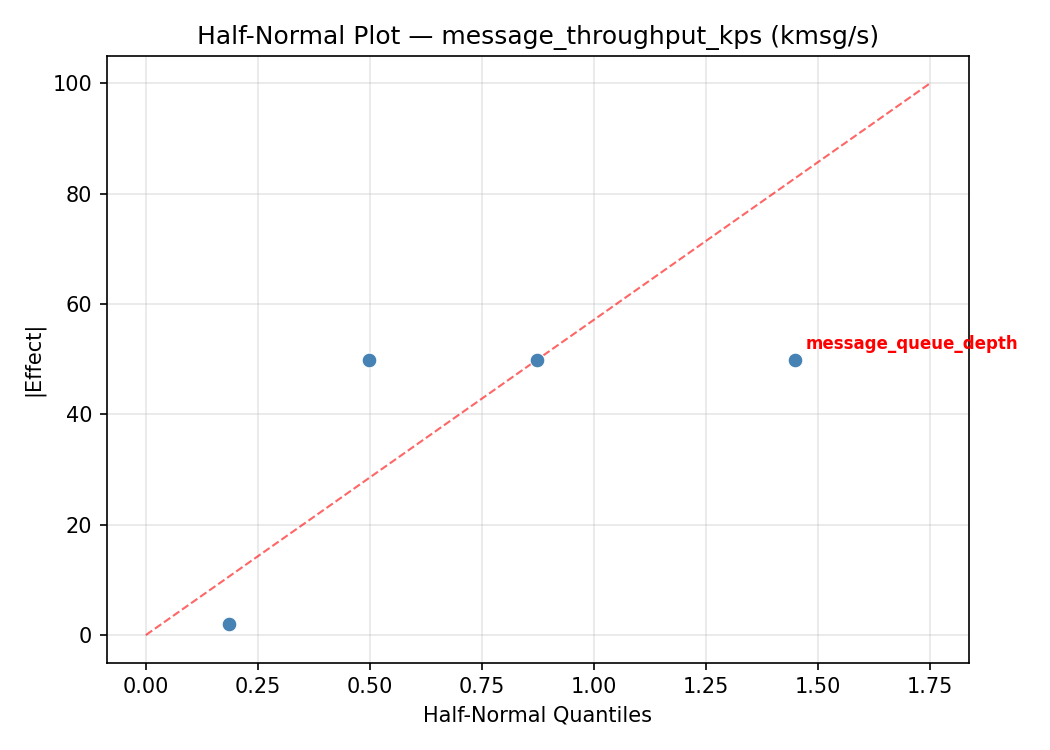
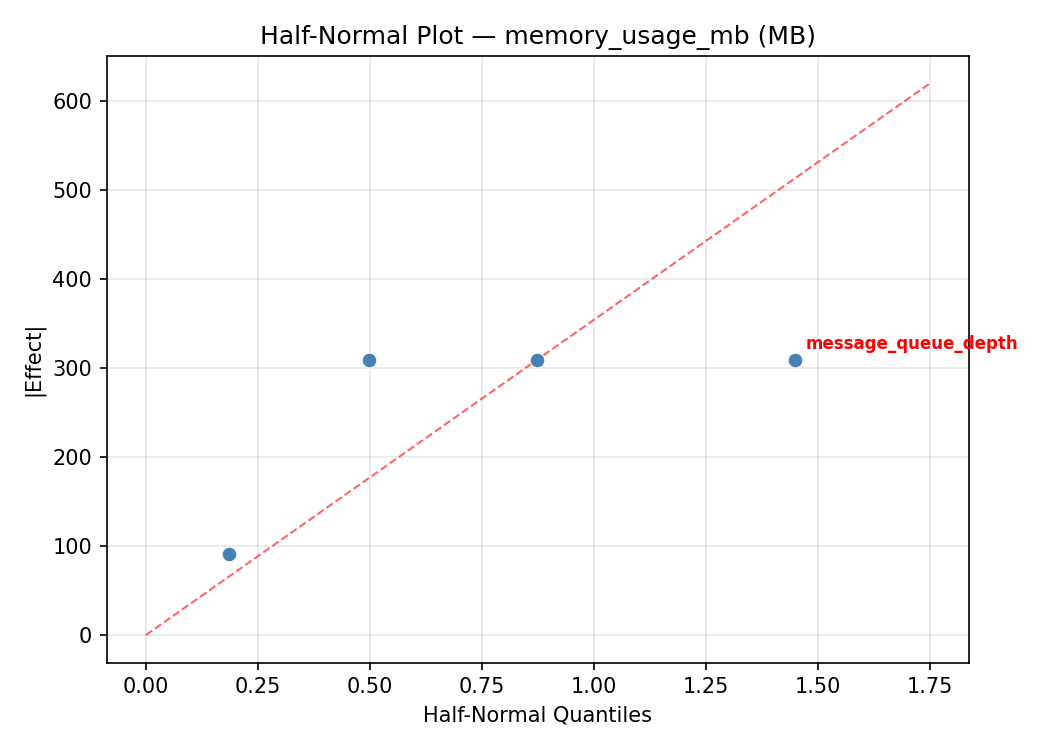
Half-Normal Plot of Effects
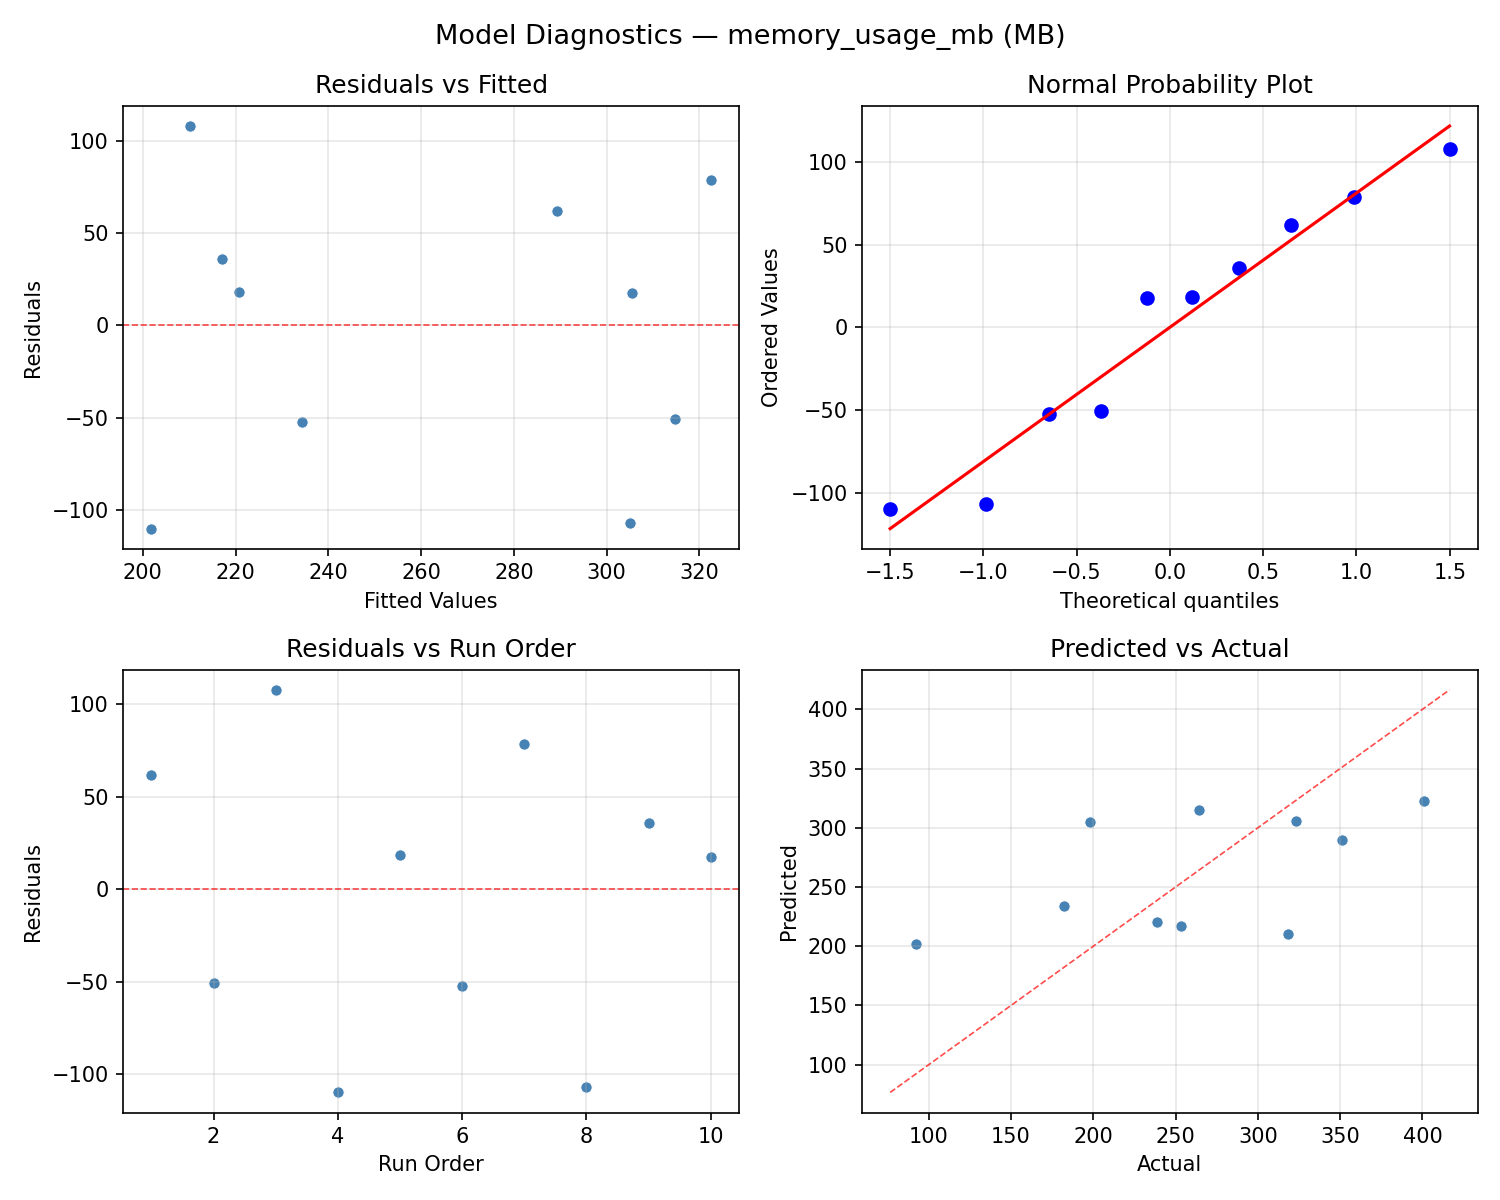
Model Diagnostics
Response: memory_usage_mb
Top factors: max_connections (32.9%), message_queue_depth (32.9%), keepalive_sec (32.9%).
ANOVA
| Source | DF | SS | MS | F | p-value |
|---|
| Source | DF | SS | MS | F | p-value |
| max_connections | 9 | 74108.9000 | 8234.3222 | 12.993 | 0.2123 |
| message_queue_depth | 9 | 74108.9000 | 8234.3222 | 12.993 | 0.2123 |
| keepalive_sec | 9 | 74108.9000 | 8234.3222 | 12.993 | 0.2123 |
| qos_level | 1 | 422.5000 | 422.5000 | 0.667 | 0.5641 |
| Error | (Lenth | PSE) | 1 | 633.7500 | 633.7500 |
| Total | 9 | 74108.9000 | 8234.3222 | | |
Pareto Chart
Main Effects Plot
Normal Probability Plot of Effects
Half-Normal Plot of Effects
Model Diagnostics
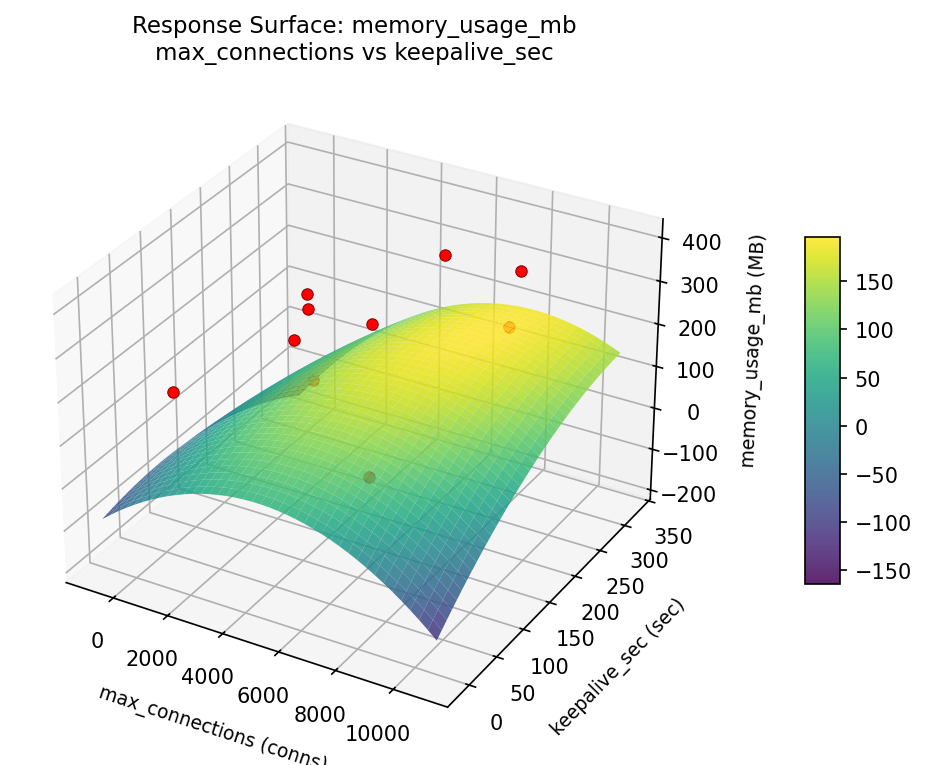
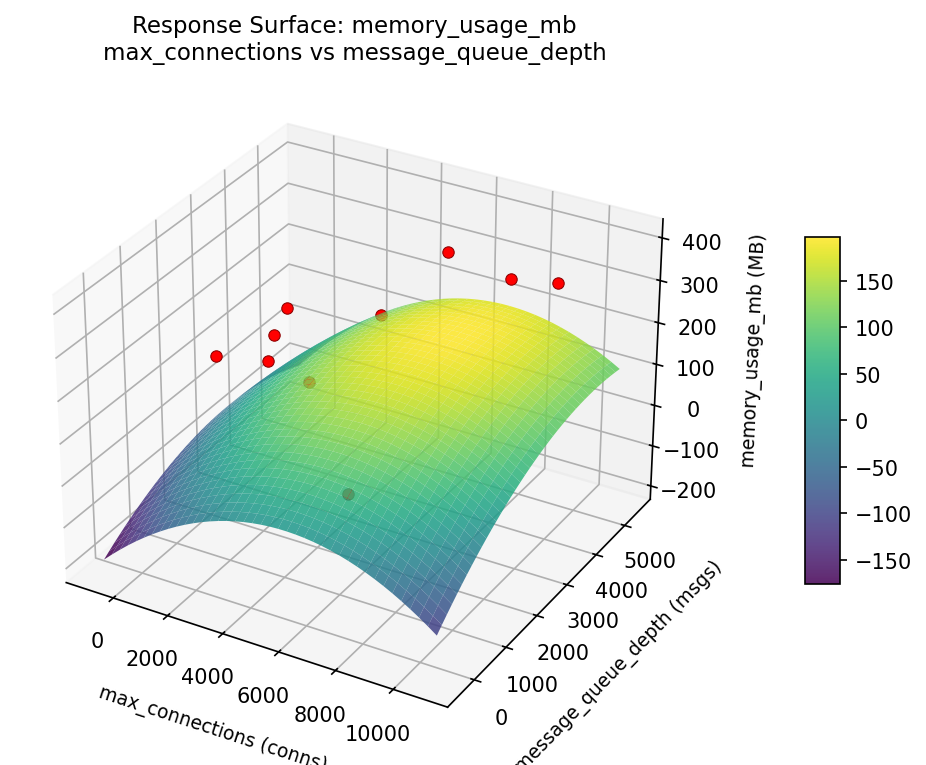
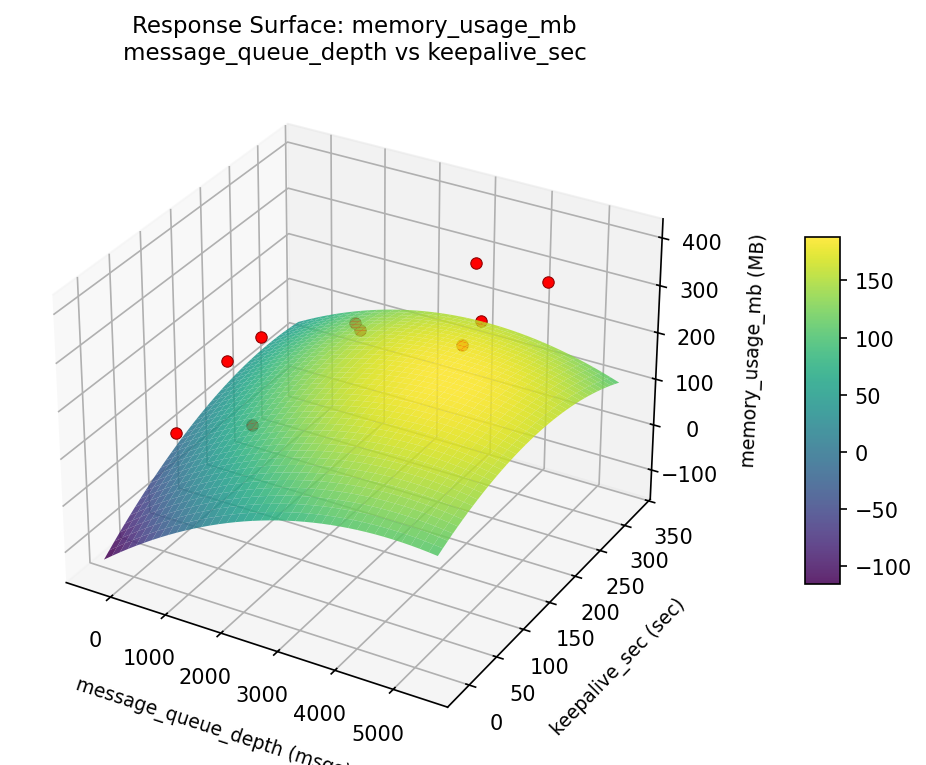
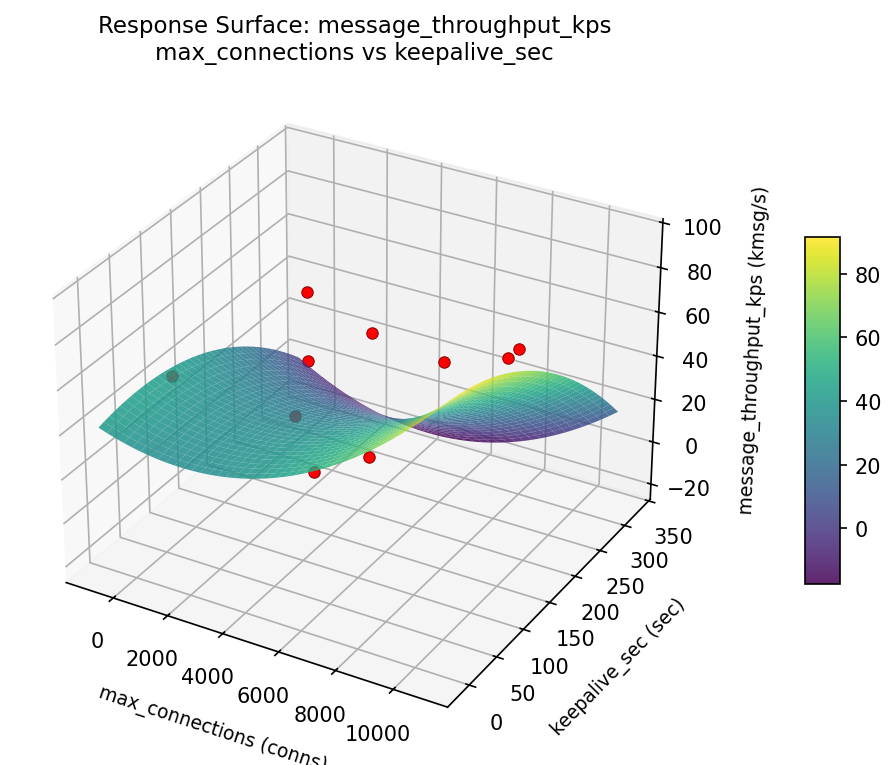
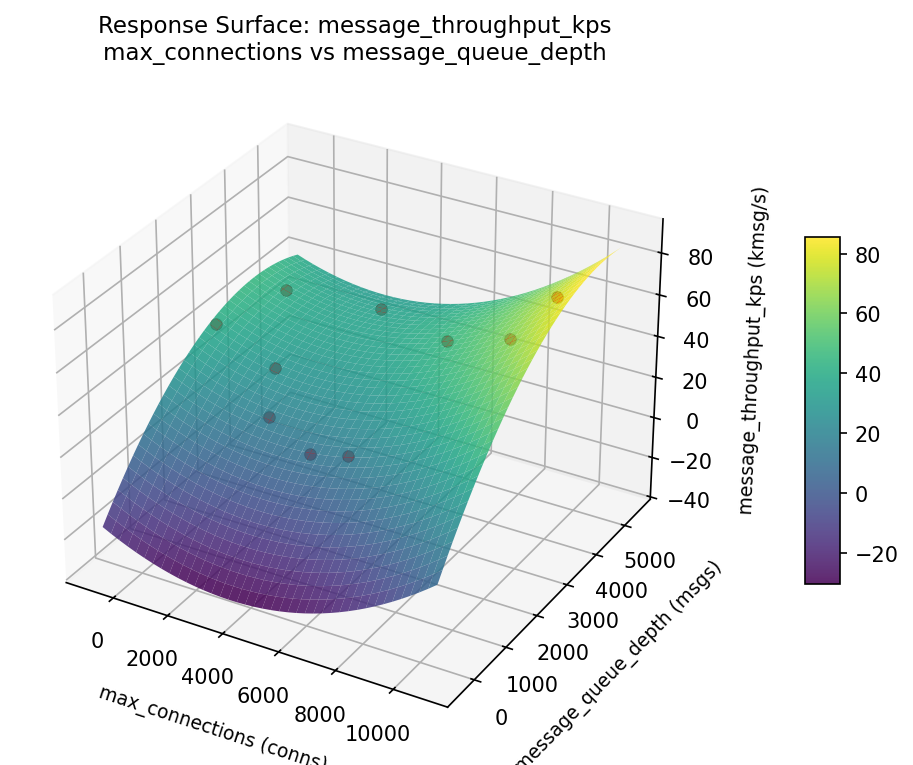
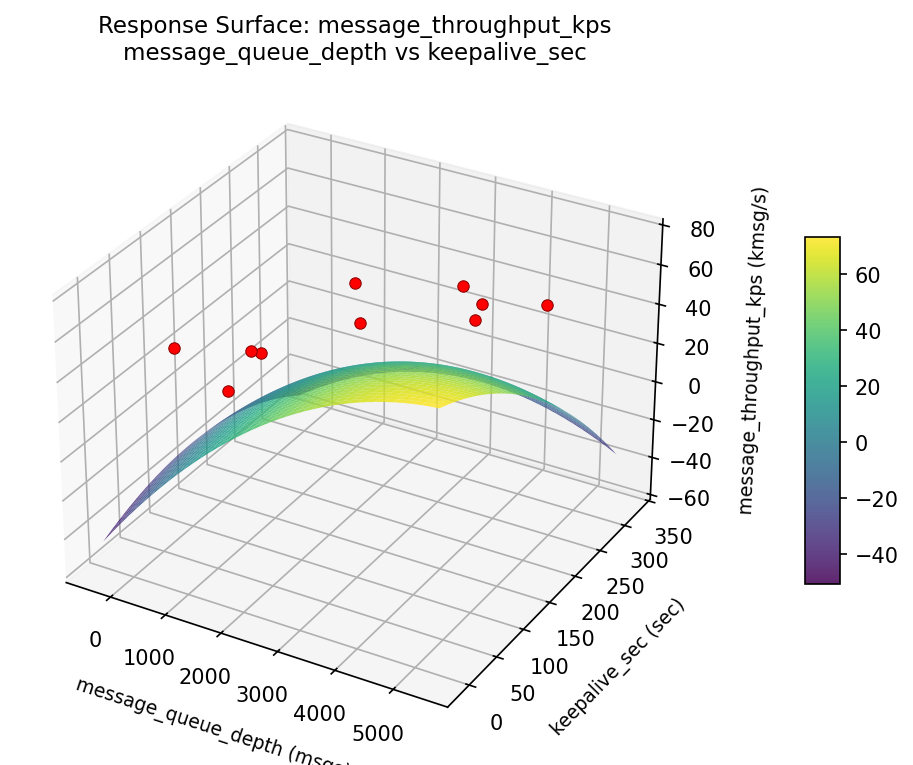
Response Surface Plots
3D surfaces fitted with quadratic RSM. Red dots are observed data points.
memory usage mb max connections vs keepalive sec
memory usage mb max connections vs message queue depth
memory usage mb message queue depth vs keepalive sec
message throughput kps max connections vs keepalive sec
message throughput kps max connections vs message queue depth
message throughput kps message queue depth vs keepalive sec
Multi-Objective Optimization
When responses compete, Derringer–Suich desirability finds the best compromise.
Each response is scaled to a 0–1 desirability, then combined via a weighted geometric mean.
Overall Desirability
D = 0.8974
Per-Response Desirability
| Response | Weight | Desirability | Predicted | Dir |
|---|
message_throughput_kps |
1.5 |
|
78.12 1.0000 78.12 kmsg/s |
↑ |
memory_usage_mb |
1.0 |
|
157.11 0.7630 157.11 MB |
↓ |
Recommended Settings
| Factor | Value |
|---|
max_connections | 9955 conns |
message_queue_depth | 272.3 msgs |
keepalive_sec | 29.96 sec |
qos_level | 2 |
Source: from RSM model prediction
Trade-off Summary
Sacrifice = how much worse than single-objective best.
| Response | Predicted | Best Observed | Sacrifice |
|---|
memory_usage_mb | 157.11 | 92.00 | +65.11 |
Top 3 Runs by Desirability
| Run | D | Factor Settings |
|---|
| #8 | 0.6275 | max_connections=4793.3, message_queue_depth=2354.45, keepalive_sec=36.8582, qos_level=2 |
| #3 | 0.5924 | max_connections=6322.7, message_queue_depth=1083.48, keepalive_sec=61.0574, qos_level=0 |
Model Quality
| Response | R² | Type |
|---|
memory_usage_mb | 0.4887 | linear |
Full Multi-Objective Output
============================================================
MULTI-OBJECTIVE OPTIMIZATION
Method: Derringer-Suich Desirability Function
============================================================
Overall desirability: D = 0.8974
Response Weight Desirability Predicted Direction
---------------------------------------------------------------------
message_throughput_kps 1.5 1.0000 78.12 kmsg/s ↑
memory_usage_mb 1.0 0.7630 157.11 MB ↓
Recommended settings:
max_connections = 9955 conns
message_queue_depth = 272.3 msgs
keepalive_sec = 29.96 sec
qos_level = 2
(from RSM model prediction)
Trade-off summary:
message_throughput_kps: 78.12 (best observed: 73.40, sacrifice: -4.72)
memory_usage_mb: 157.11 (best observed: 92.00, sacrifice: +65.11)
Model quality:
message_throughput_kps: R² = 0.3184 (linear)
memory_usage_mb: R² = 0.4887 (linear)
Top 3 observed runs by overall desirability:
1. Run #6 (D=0.6825): max_connections=376.083, message_queue_depth=373.733, keepalive_sec=289.006, qos_level=2
2. Run #8 (D=0.6275): max_connections=4793.3, message_queue_depth=2354.45, keepalive_sec=36.8582, qos_level=2
3. Run #3 (D=0.5924): max_connections=6322.7, message_queue_depth=1083.48, keepalive_sec=61.0574, qos_level=0
Full Analysis Output
=== Main Effects: message_throughput_kps ===
Factor Effect Std Error % Contribution
--------------------------------------------------------------
max_connections 49.9000 5.0258 33.2%
message_queue_depth 49.9000 5.0258 33.2%
keepalive_sec 49.9000 5.0258 33.2%
qos_level 0.4600 5.0258 0.3%
=== ANOVA Table: message_throughput_kps ===
Source DF SS MS F p-value
-----------------------------------------------------------------------------
max_connections 9 2273.3210 252.5912 318.325 0.0435
message_queue_depth 9 2273.3210 252.5912 318.325 0.0435
keepalive_sec 9 2273.3210 252.5912 318.325 0.0435
qos_level 1 0.5290 0.5290 0.667 0.5641
Error (Lenth PSE) 1 0.7935 0.7935
Total 9 2273.3210 252.5912
Note: Error estimated using Lenth's pseudo-standard-error (unreplicated design)
=== Summary Statistics: message_throughput_kps ===
max_connections:
Level N Mean Std Min Max
------------------------------------------------------------
1315.11 1 38.5000 0.0000 38.5000 38.5000
2848.83 1 43.1000 0.0000 43.1000 43.1000
3974.73 1 58.2000 0.0000 58.2000 58.2000
4686.17 1 32.8000 0.0000 32.8000 32.8000
5614.68 1 54.9000 0.0000 54.9000 54.9000
6292.97 1 70.2000 0.0000 70.2000 70.2000
7666.15 1 42.4000 0.0000 42.4000 42.4000
768.482 1 23.5000 0.0000 23.5000 23.5000
8983.24 1 45.3000 0.0000 45.3000 45.3000
9080.63 1 73.4000 0.0000 73.4000 73.4000
message_queue_depth:
Level N Mean Std Min Max
------------------------------------------------------------
1524.92 1 54.9000 0.0000 54.9000 54.9000
1635.81 1 23.5000 0.0000 23.5000 23.5000
177.374 1 45.3000 0.0000 45.3000 45.3000
2183.37 1 43.1000 0.0000 43.1000 43.1000
2928.45 1 70.2000 0.0000 70.2000 70.2000
3419.68 1 58.2000 0.0000 58.2000 58.2000
3916.95 1 38.5000 0.0000 38.5000 38.5000
4101.09 1 32.8000 0.0000 32.8000 32.8000
4913.99 1 73.4000 0.0000 73.4000 73.4000
913.579 1 42.4000 0.0000 42.4000 42.4000
keepalive_sec:
Level N Mean Std Min Max
------------------------------------------------------------
114.134 1 43.1000 0.0000 43.1000 43.1000
151.27 1 32.8000 0.0000 32.8000 32.8000
183.856 1 73.4000 0.0000 73.4000 73.4000
186.014 1 42.4000 0.0000 42.4000 42.4000
20.3771 1 70.2000 0.0000 70.2000 70.2000
231.97 1 58.2000 0.0000 58.2000 58.2000
244.732 1 23.5000 0.0000 23.5000 23.5000
273.463 1 54.9000 0.0000 54.9000 54.9000
61.4291 1 38.5000 0.0000 38.5000 38.5000
73.8596 1 45.3000 0.0000 45.3000 45.3000
qos_level:
Level N Mean Std Min Max
------------------------------------------------------------
0 5 48.0000 8.2644 38.5000 58.2000
2 5 48.4600 22.3584 23.5000 73.4000
=== Main Effects: memory_usage_mb ===
Factor Effect Std Error % Contribution
--------------------------------------------------------------
max_connections 309.0000 28.6955 32.9%
message_queue_depth 309.0000 28.6955 32.9%
keepalive_sec 309.0000 28.6955 32.9%
qos_level -13.0000 28.6955 1.4%
=== ANOVA Table: memory_usage_mb ===
Source DF SS MS F p-value
-----------------------------------------------------------------------------
max_connections 9 74108.9000 8234.3222 12.993 0.2123
message_queue_depth 9 74108.9000 8234.3222 12.993 0.2123
keepalive_sec 9 74108.9000 8234.3222 12.993 0.2123
qos_level 1 422.5000 422.5000 0.667 0.5641
Error (Lenth PSE) 1 633.7500 633.7500
Total 9 74108.9000 8234.3222
Note: Error estimated using Lenth's pseudo-standard-error (unreplicated design)
=== Summary Statistics: memory_usage_mb ===
max_connections:
Level N Mean Std Min Max
------------------------------------------------------------
1315.11 1 239.0000 0.0000 239.0000 239.0000
2848.83 1 323.0000 0.0000 323.0000 323.0000
3974.73 1 182.0000 0.0000 182.0000 182.0000
4686.17 1 264.0000 0.0000 264.0000 264.0000
5614.68 1 198.0000 0.0000 198.0000 198.0000
6292.97 1 351.0000 0.0000 351.0000 351.0000
7666.15 1 92.0000 0.0000 92.0000 92.0000
768.482 1 253.0000 0.0000 253.0000 253.0000
8983.24 1 401.0000 0.0000 401.0000 401.0000
9080.63 1 318.0000 0.0000 318.0000 318.0000
message_queue_depth:
Level N Mean Std Min Max
------------------------------------------------------------
1524.92 1 198.0000 0.0000 198.0000 198.0000
1635.81 1 253.0000 0.0000 253.0000 253.0000
177.374 1 401.0000 0.0000 401.0000 401.0000
2183.37 1 323.0000 0.0000 323.0000 323.0000
2928.45 1 351.0000 0.0000 351.0000 351.0000
3419.68 1 182.0000 0.0000 182.0000 182.0000
3916.95 1 239.0000 0.0000 239.0000 239.0000
4101.09 1 264.0000 0.0000 264.0000 264.0000
4913.99 1 318.0000 0.0000 318.0000 318.0000
913.579 1 92.0000 0.0000 92.0000 92.0000
keepalive_sec:
Level N Mean Std Min Max
------------------------------------------------------------
114.134 1 323.0000 0.0000 323.0000 323.0000
151.27 1 264.0000 0.0000 264.0000 264.0000
183.856 1 318.0000 0.0000 318.0000 318.0000
186.014 1 92.0000 0.0000 92.0000 92.0000
20.3771 1 351.0000 0.0000 351.0000 351.0000
231.97 1 182.0000 0.0000 182.0000 182.0000
244.732 1 253.0000 0.0000 253.0000 253.0000
273.463 1 198.0000 0.0000 198.0000 198.0000
61.4291 1 239.0000 0.0000 239.0000 239.0000
73.8596 1 401.0000 0.0000 401.0000 401.0000
qos_level:
Level N Mean Std Min Max
------------------------------------------------------------
0 5 268.6000 91.9908 182.0000 401.0000
2 5 255.6000 99.7963 92.0000 351.0000
Optimization Recommendations
=== Optimization: message_throughput_kps ===
Direction: maximize
Best observed run: #3
max_connections = 6829.26
message_queue_depth = 3528.83
keepalive_sec = 200.578
qos_level = 2
Value: 73.4
RSM Model (linear, R² = 0.5478, Adj R² = 0.1860):
Coefficients:
intercept +48.0019
max_connections -16.7269
message_queue_depth +24.7917
keepalive_sec +24.9108
qos_level +3.6466
Predicted optimum (from linear model, at observed points):
max_connections = 4394.35
message_queue_depth = 4575.19
keepalive_sec = 140.929
qos_level = 0
Predicted value: 64.1670
Surface optimum (via L-BFGS-B, linear model):
max_connections = 100
message_queue_depth = 5000
keepalive_sec = 300
qos_level = 2
Predicted value: 118.0779
Model quality: Moderate fit — use predictions directionally, not precisely.
Factor importance:
1. max_connections (effect: 49.9, contribution: 32.7%)
2. message_queue_depth (effect: 49.9, contribution: 32.7%)
3. keepalive_sec (effect: 49.9, contribution: 32.7%)
4. qos_level (effect: 2.8, contribution: 1.8%)
=== Optimization: memory_usage_mb ===
Direction: minimize
Best observed run: #4
max_connections = 7351.69
message_queue_depth = 245.886
keepalive_sec = 244.791
qos_level = 0
Value: 92.0
RSM Model (linear, R² = 0.5177, Adj R² = 0.1318):
Coefficients:
intercept +261.2520
max_connections +35.3126
message_queue_depth +107.3798
keepalive_sec +27.0557
qos_level +6.8018
Predicted optimum (from linear model, at observed points):
max_connections = 9372.41
message_queue_depth = 3727.79
keepalive_sec = 121.717
qos_level = 2
Predicted value: 343.7160
Surface optimum (via L-BFGS-B, linear model):
max_connections = 100
message_queue_depth = 100
keepalive_sec = 15
qos_level = 0
Predicted value: 84.7021
Model quality: Moderate fit — use predictions directionally, not precisely.
Factor importance:
1. max_connections (effect: 309.0, contribution: 32.0%)
2. message_queue_depth (effect: 309.0, contribution: 32.0%)
3. keepalive_sec (effect: 309.0, contribution: 32.0%)
4. qos_level (effect: 37.4, contribution: 3.9%)