Summary
This experiment investigates database performance tuning. Plackett-Burman screening of 6 PostgreSQL parameters with 2 replicate blocks.
The design varies 6 factors: shared buffers (MB), ranging from 256 to 1024, work mem (MB), ranging from 4 to 64, max connections, ranging from 50 to 200, effective cache (MB), ranging from 512 to 4096, wal level, ranging from minimal to replica, and checkpoint timeout (sec), ranging from 60 to 900. The goal is to optimize 2 responses: throughput (tps) (maximize) and p99 latency (ms) (minimize). Fixed conditions held constant across all runs include pg version = 16, storage = nvme.
A Plackett-Burman screening design was used to efficiently test 6 factors in only 16 runs. This design assumes interactions are negligible and focuses on identifying the most influential main effects.
Key Findings
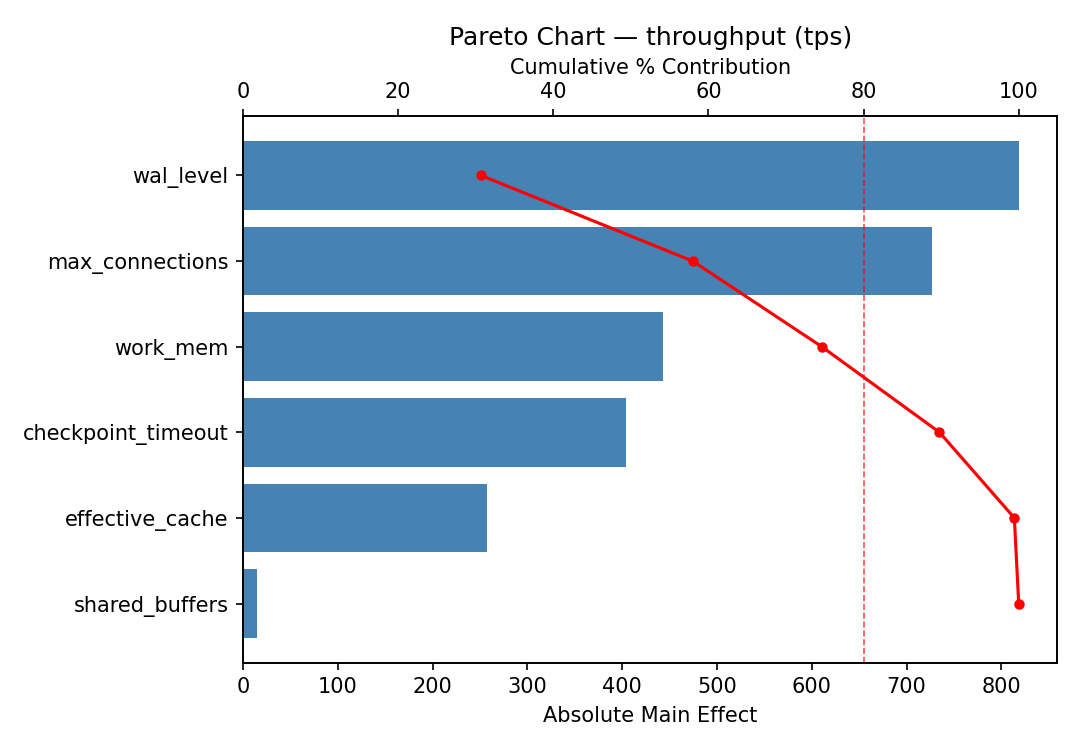
For throughput, the most influential factors were max connections (43.1%), work mem (17.6%), wal level (16.7%). The best observed value was 6654.0 (at shared buffers = 256, work mem = 4, max connections = 200).
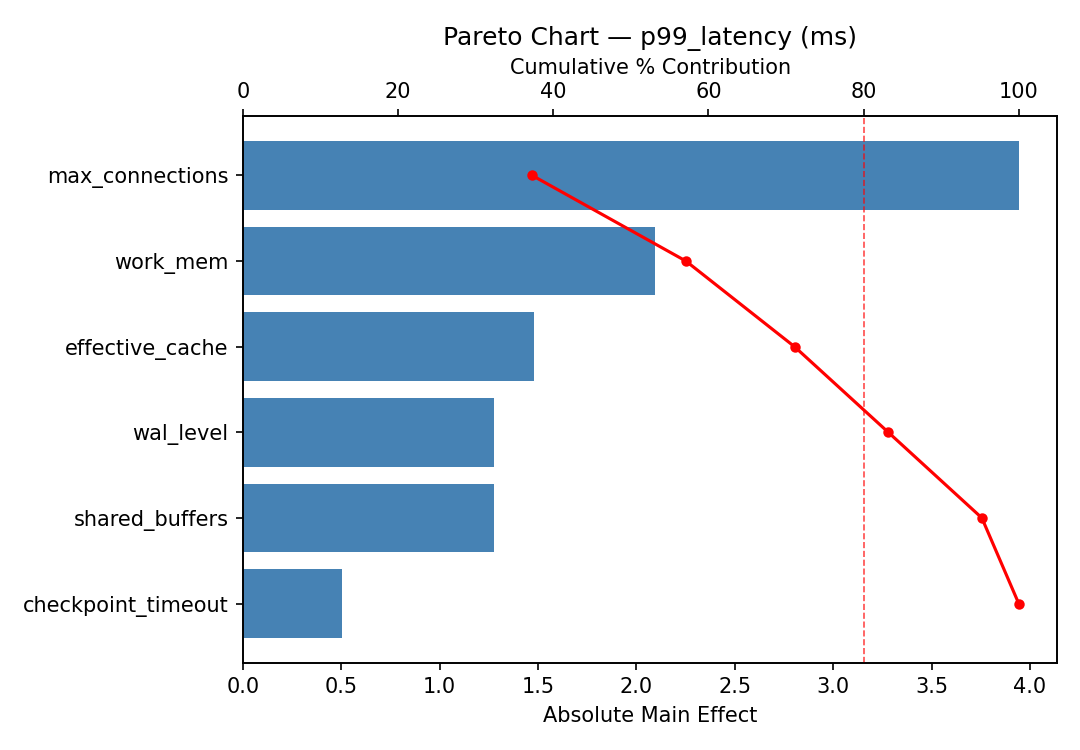
For p99 latency, the most influential factors were max connections (38.8%), wal level (18.0%), shared buffers (16.8%). The best observed value was 7.1 (at shared buffers = 256, work mem = 64, max connections = 50).
Recommended Next Steps
- Follow up with a response surface design (CCD or Box-Behnken) on the top 3–4 factors to model curvature and find the true optimum.
- Consider whether any fixed factors should be varied in a future study.
- The screening results can guide factor reduction — drop factors contributing less than 5% and re-run with a smaller, more focused design.
The Scenario
You are tuning a PostgreSQL database for an OLTP workload. There are 6 configuration parameters to investigate, but running benchmarks is time-consuming. A full factorial would require 64 runs — way too many. Plackett-Burman gives you the answer in 8 base runs, replicated across 2 blocks for 16 total.
Why Plackett-Burman with Blocking?
PB gives 8 runs for 6 factors (N+1 rounded to multiple of 4). With block_count: 2, you get 16 total runs and can assess run-to-run variability. If the same factors dominate in both blocks, the finding is robust.
Experimental Setup
Factors
| Factor | Low | High | Unit |
|---|---|---|---|
shared_buffers | 256 | 1024 | MB |
work_mem | 4 | 64 | MB |
max_connections | 50 | 200 | — |
effective_cache | 512 | 4096 | MB |
wal_level | minimal | replica | — |
checkpoint_timeout | 60 | 900 | sec |
Fixed: pg_version = 16, storage = nvme
Responses
| Response | Direction | Unit |
|---|---|---|
throughput | ↑ maximize | tps |
p99_latency | ↓ minimize | ms |
Experimental Matrix
The Plackett-Burman Design produces 16 runs. Each row is one experiment with specific factor settings.
| Run | Block | shared_buffers | work_mem | max_connections | effective_cache | wal_level | checkpoint_timeout |
|---|---|---|---|---|---|---|---|
| 1 | 1 | 1024 | 64 | 200 | 512 | minimal | 60 |
| 2 | 1 | 256 | 4 | 200 | 4096 | minimal | 60 |
| 3 | 1 | 256 | 64 | 50 | 4096 | minimal | 900 |
| 4 | 1 | 1024 | 64 | 200 | 4096 | replica | 900 |
| 5 | 1 | 256 | 64 | 50 | 512 | replica | 60 |
| 6 | 1 | 1024 | 4 | 50 | 4096 | replica | 60 |
| 7 | 1 | 256 | 4 | 200 | 512 | replica | 900 |
| 8 | 1 | 1024 | 4 | 50 | 512 | minimal | 900 |
| 9 | 2 | 1024 | 64 | 200 | 512 | minimal | 60 |
| 10 | 2 | 1024 | 64 | 200 | 4096 | replica | 900 |
| 11 | 2 | 256 | 64 | 50 | 512 | replica | 60 |
| 12 | 2 | 256 | 4 | 200 | 512 | replica | 900 |
| 13 | 2 | 256 | 4 | 200 | 4096 | minimal | 60 |
| 14 | 2 | 256 | 64 | 50 | 4096 | minimal | 900 |
| 15 | 2 | 1024 | 4 | 50 | 4096 | replica | 60 |
| 16 | 2 | 1024 | 4 | 50 | 512 | minimal | 900 |
Step-by-Step Workflow
Interpreting the Results
Typical PostgreSQL Findings
- shared_buffers and effective_cache usually have the largest throughput effects
- max_connections often drives latency (more connections = more contention)
- wal_level affects write throughput but not reads
Blocking Analysis
Replicate Consistency
If the same factors dominate in both blocks → robust finding. If results differ between blocks → environmental noise may be significant, consider more replicates.
Next Steps
- Drop unimportant factors (fix them at convenient values)
- Run a full factorial or CCD on the 2–3 important factors
- Fine-tune for your specific workload
Features Exercised
| Feature | Value |
|---|---|
| Design type | plackett_burman |
| Factor types | continuous (5) + categorical (1) |
| Blocking | block_count: 2 (16 total = 8 × 2) |
--no-plots | Headless analysis for CI/SSH |
--csv | Export 4 CSV files for downstream analysis |
| Arg style | double-dash (default) |
Analysis Results
Generated from actual experiment runs using the DOE Helper Tool.
Response: throughput
The Pareto chart shows which database configuration parameters have the greatest impact on throughput.
Pareto Chart
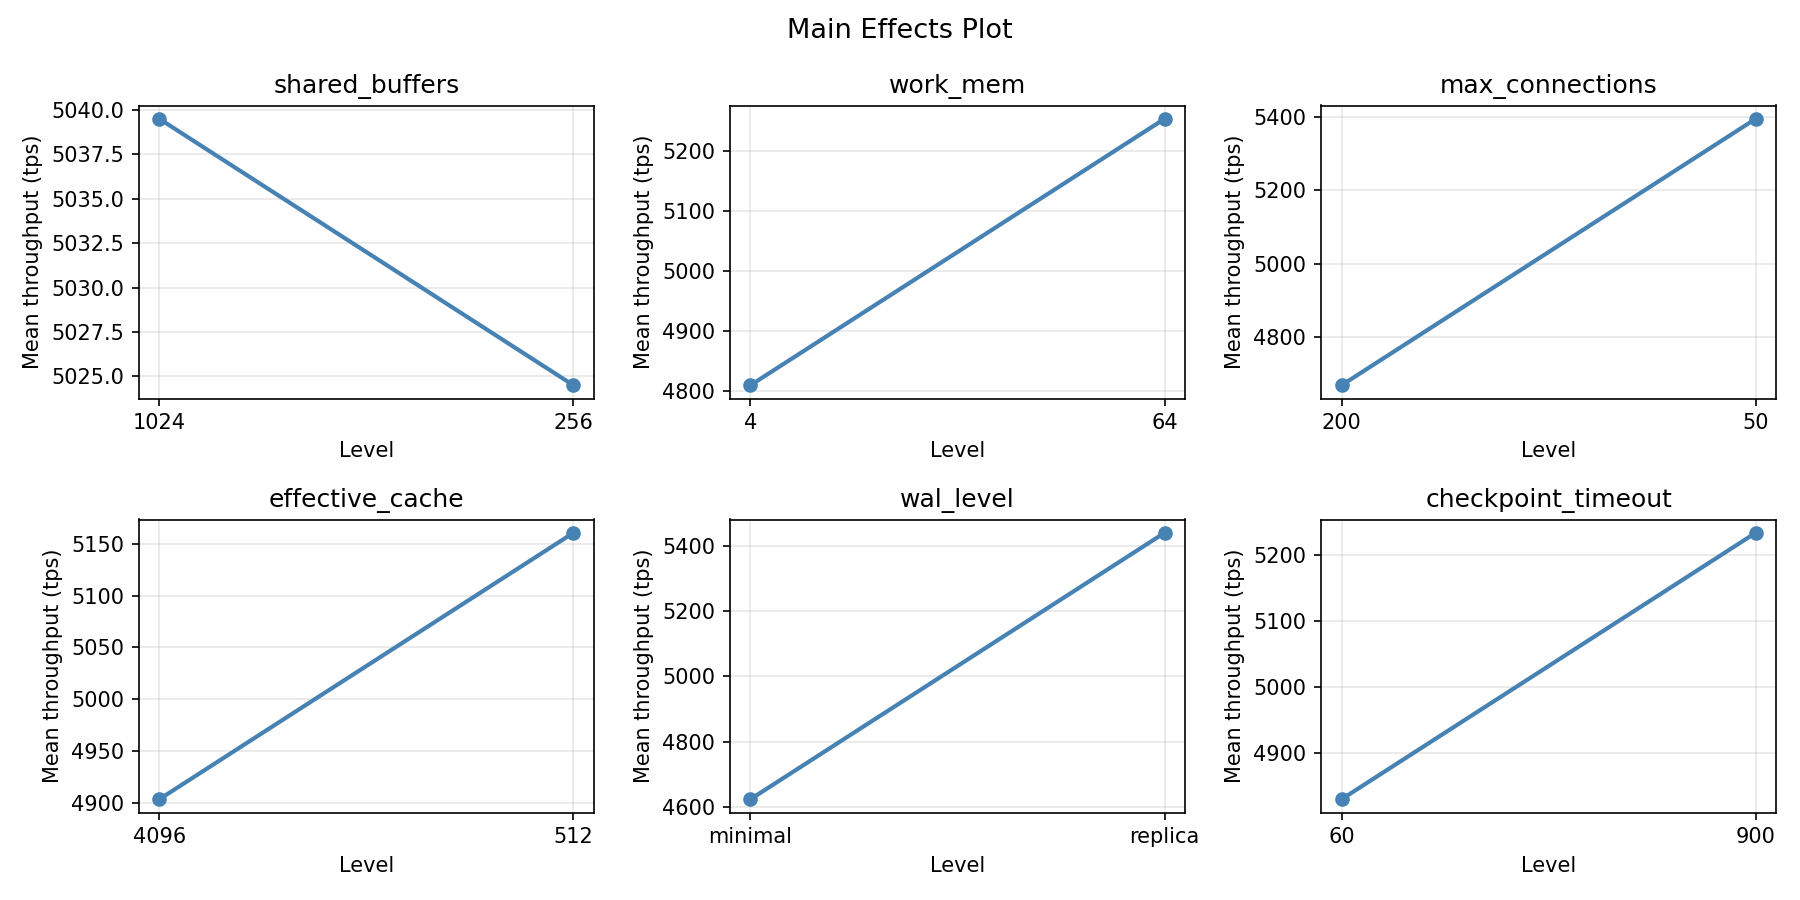
Main Effects Plot
Response: p99_latency
P99 latency is sensitive to a different mix of parameters, highlighting the need to balance throughput and tail latency.
Pareto Chart
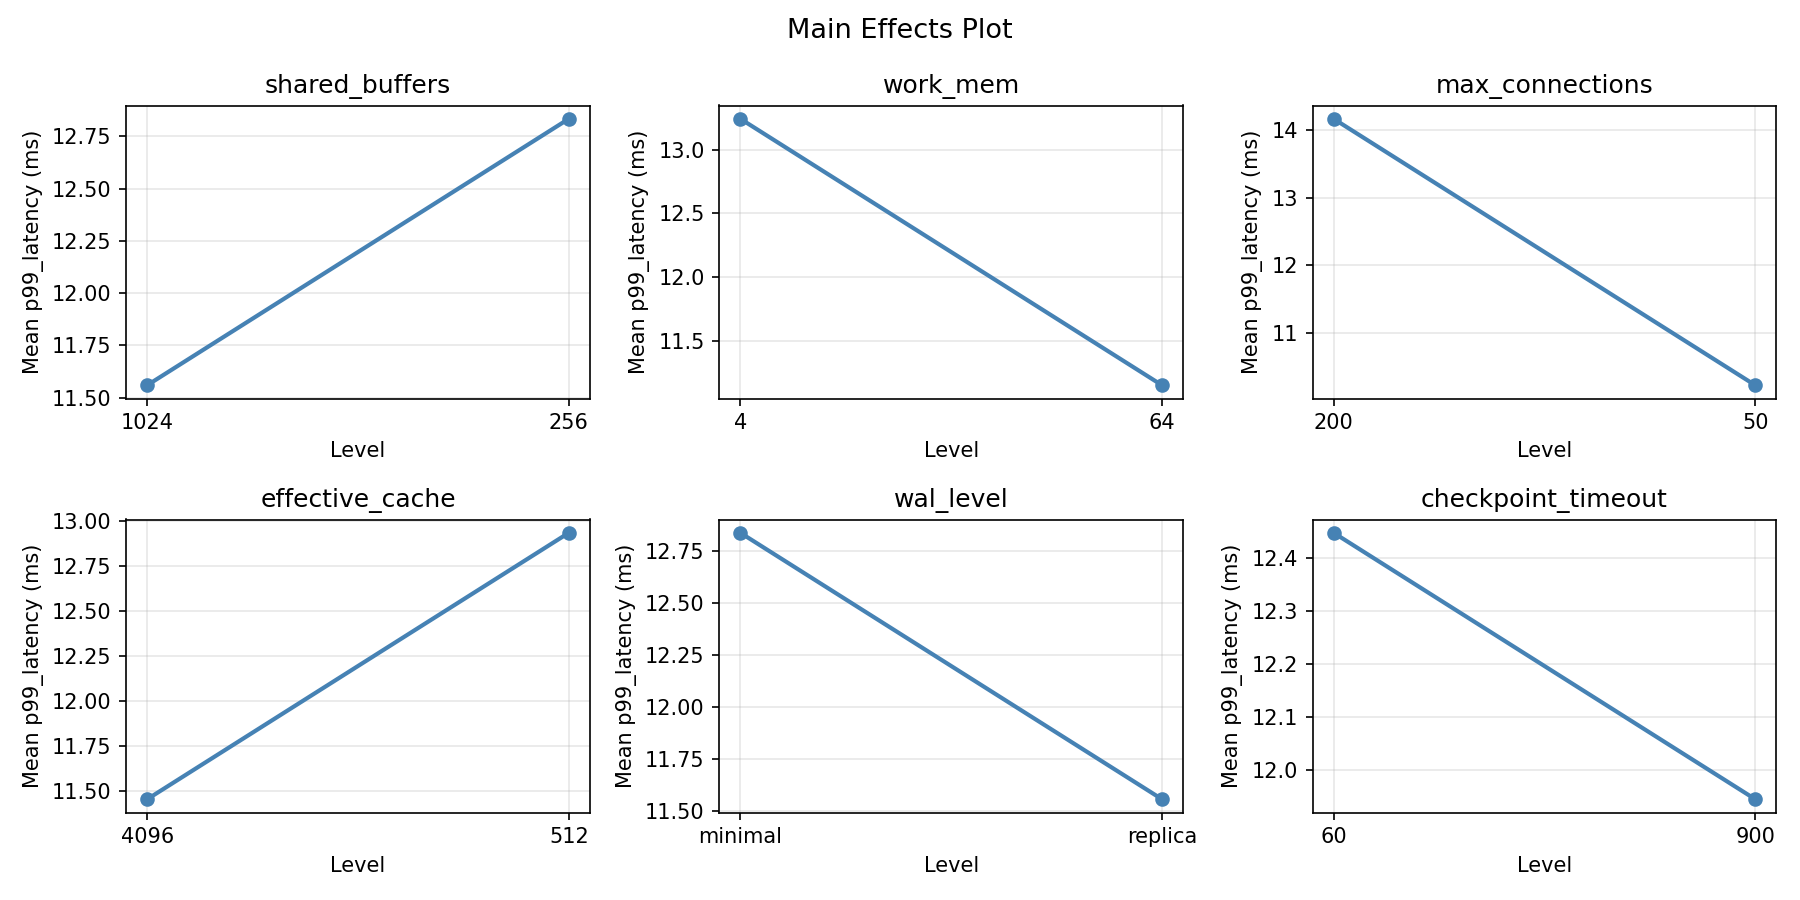
Main Effects Plot
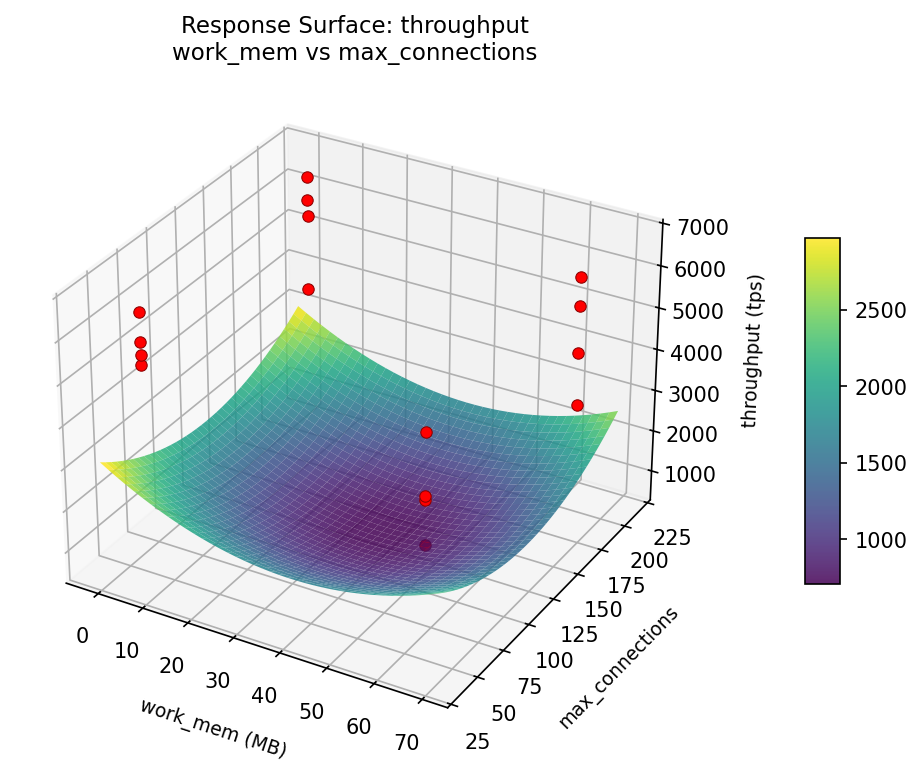
Response Surface Plots
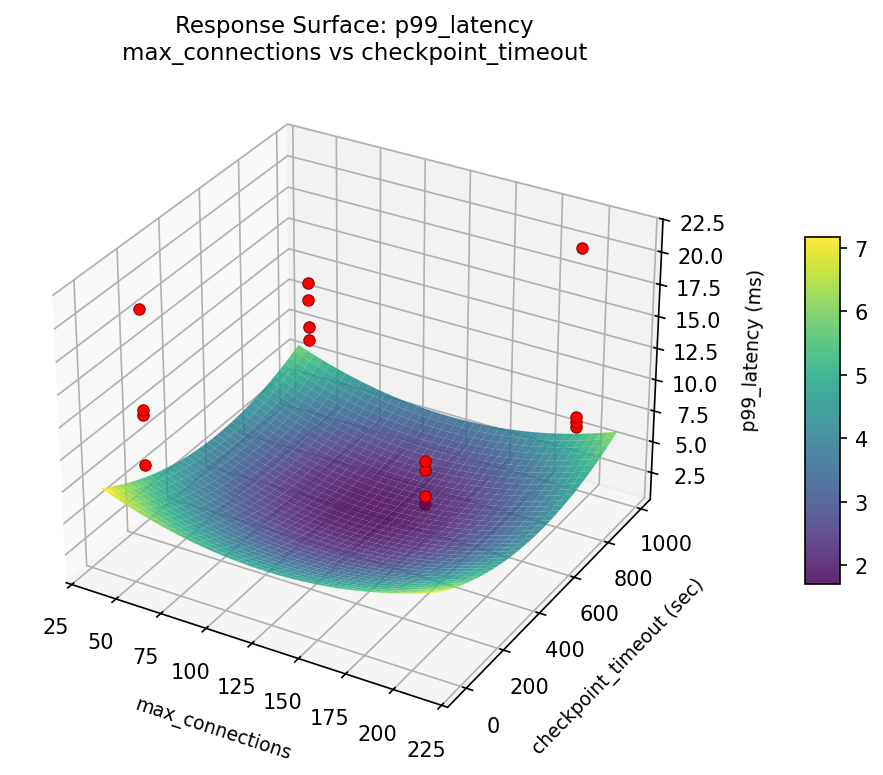
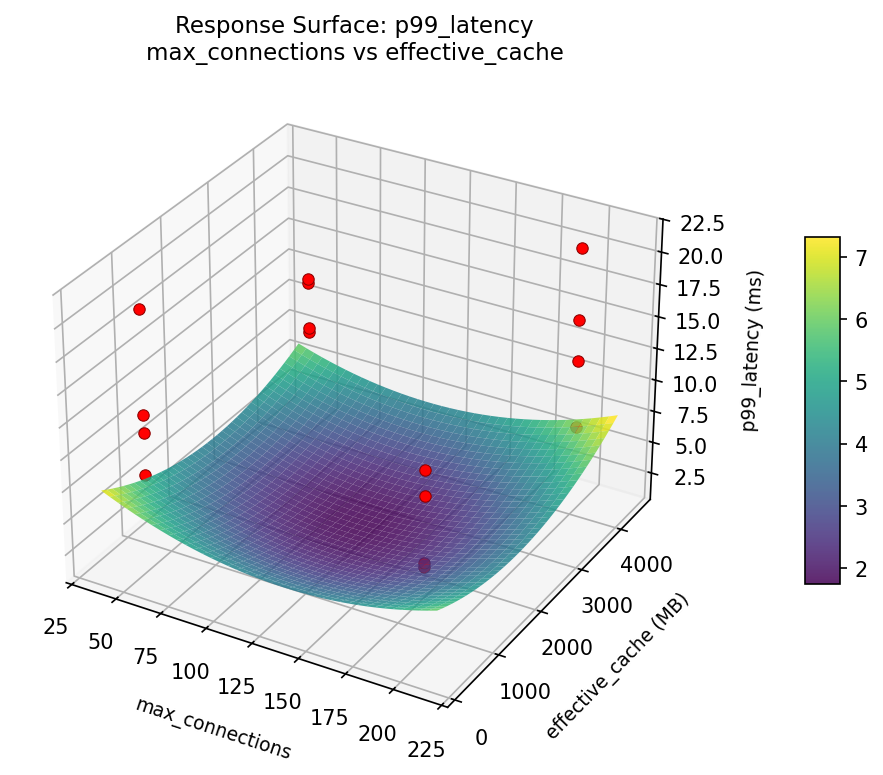
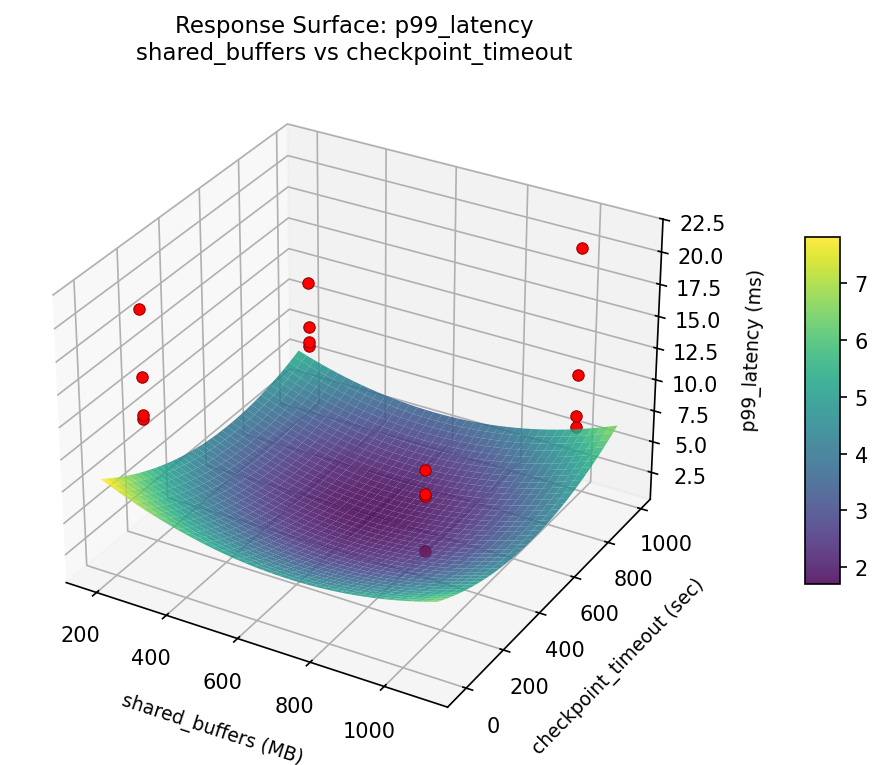
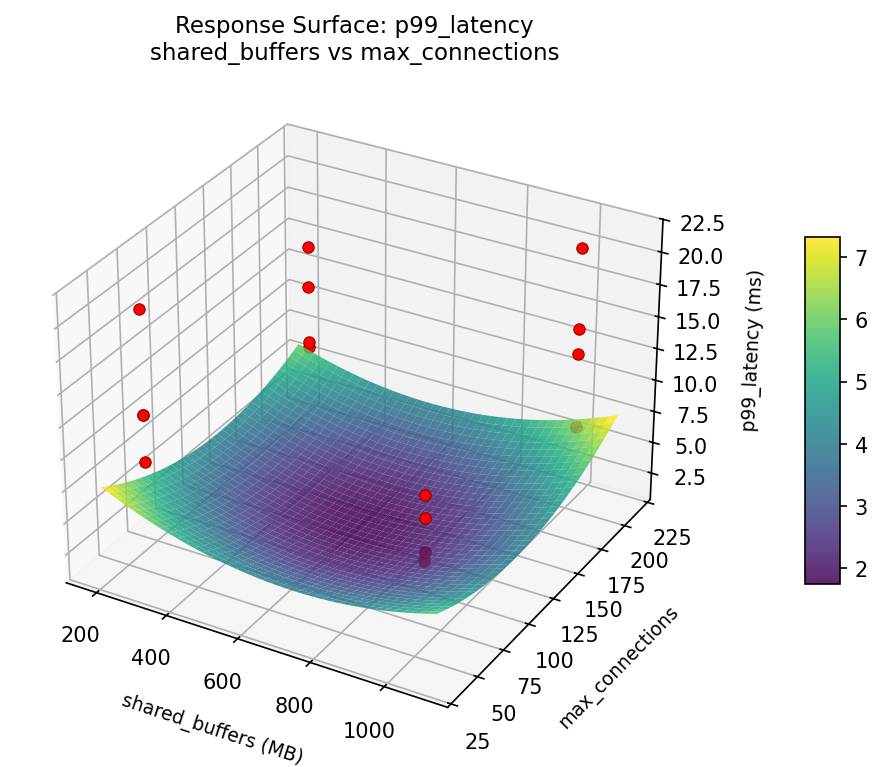
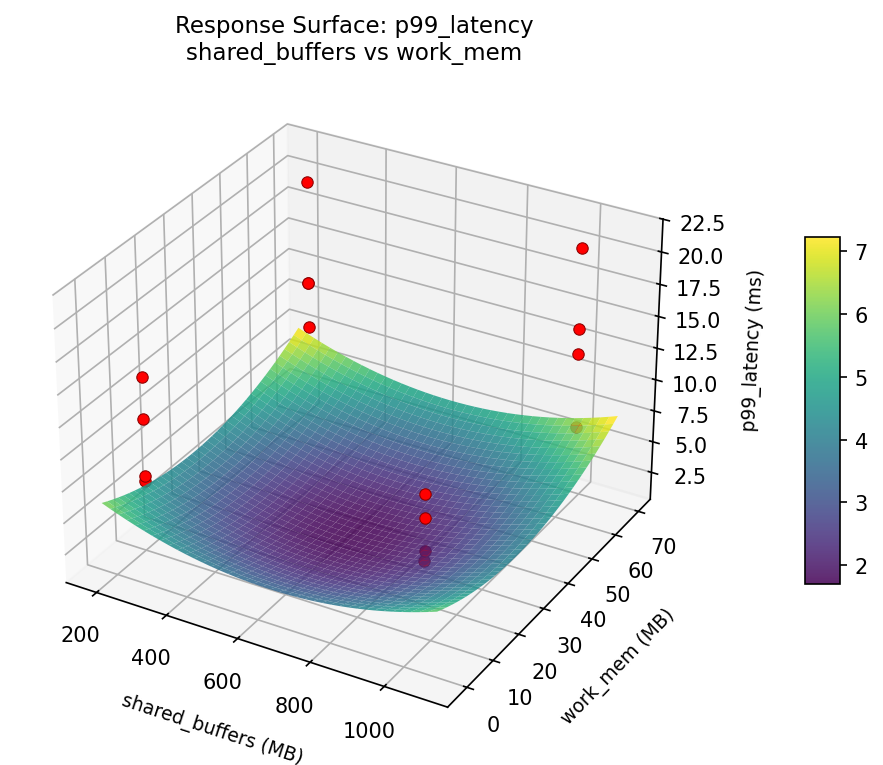
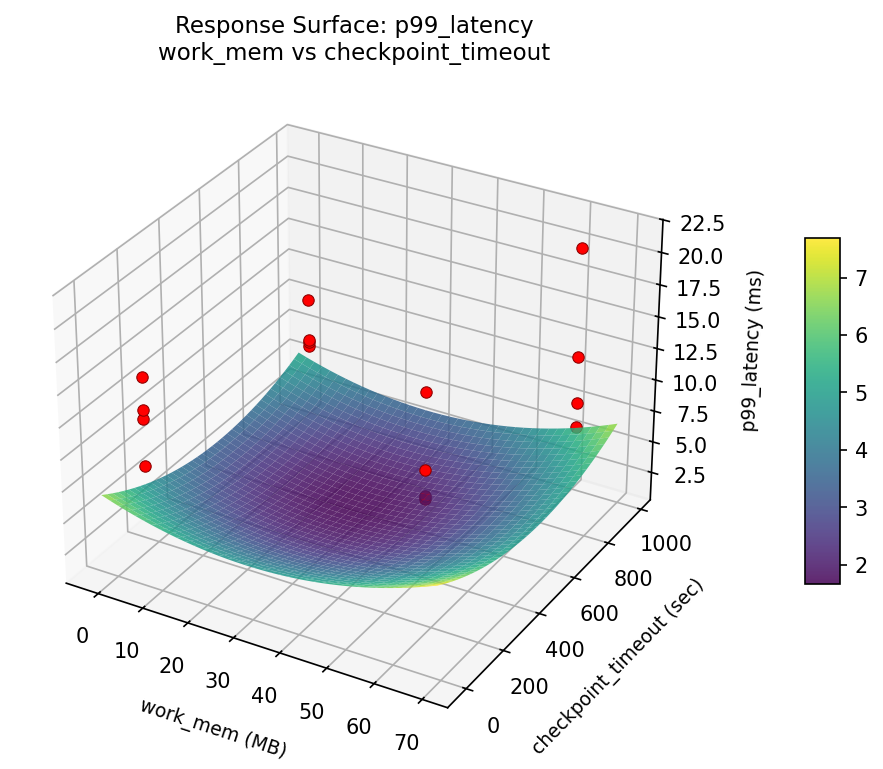
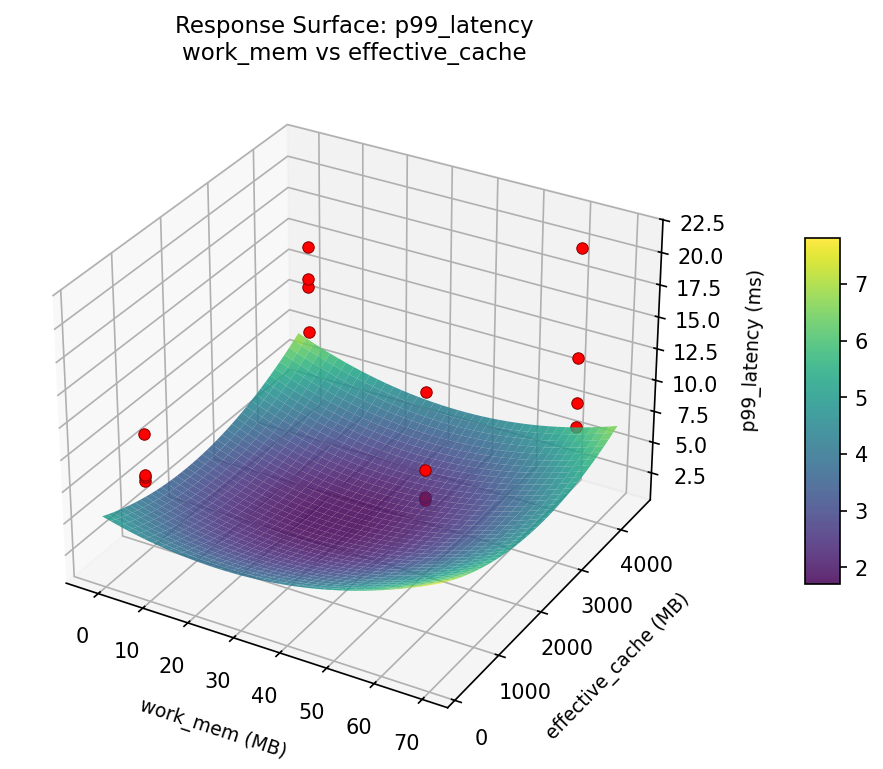
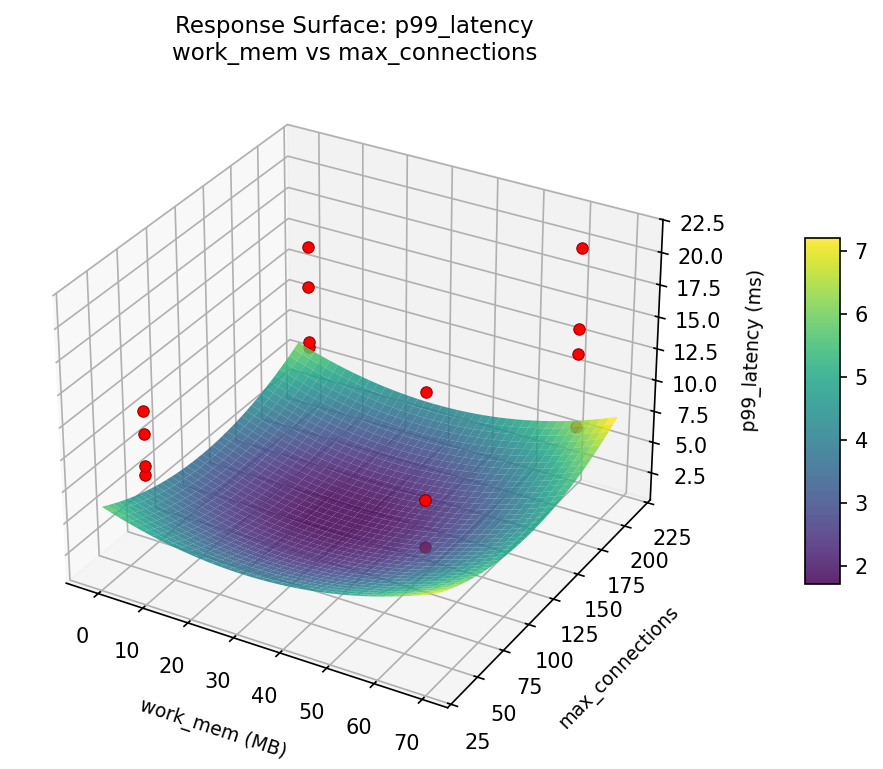
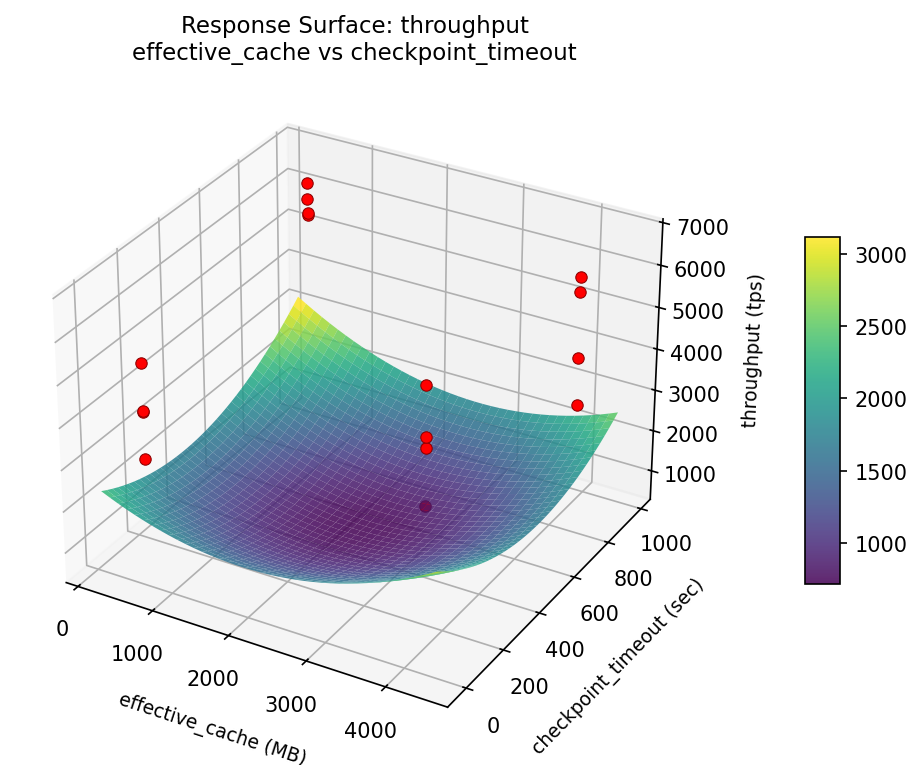
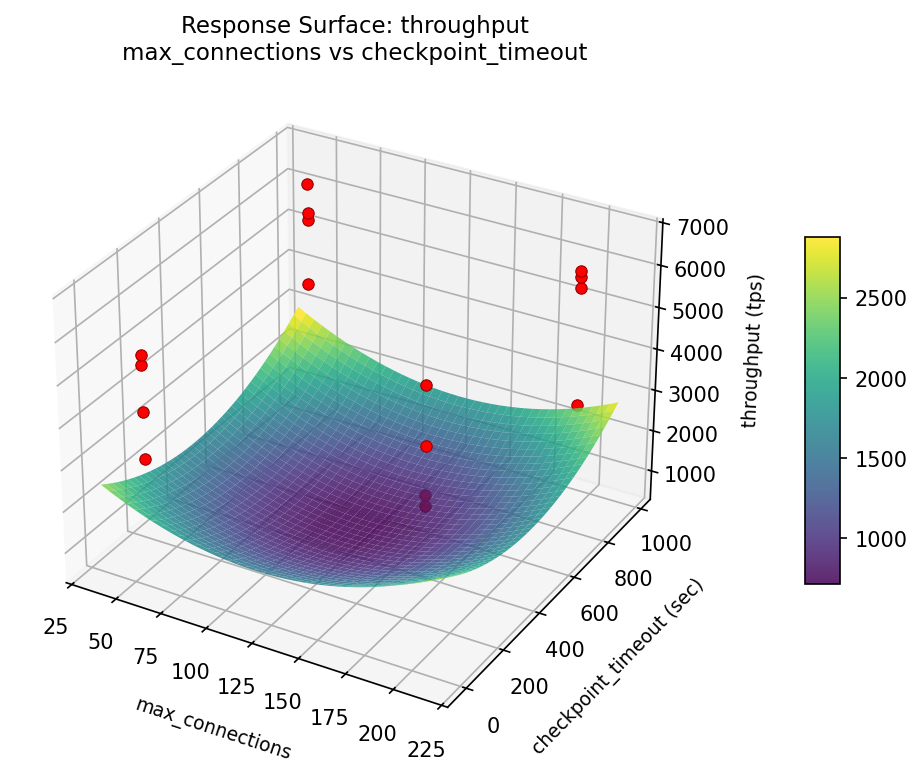
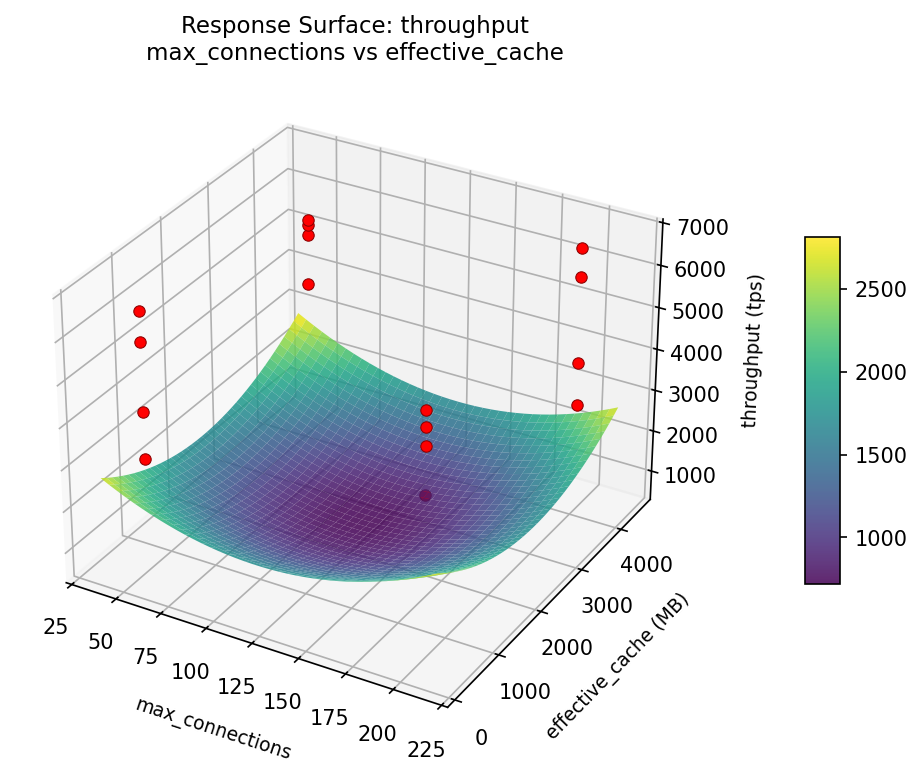
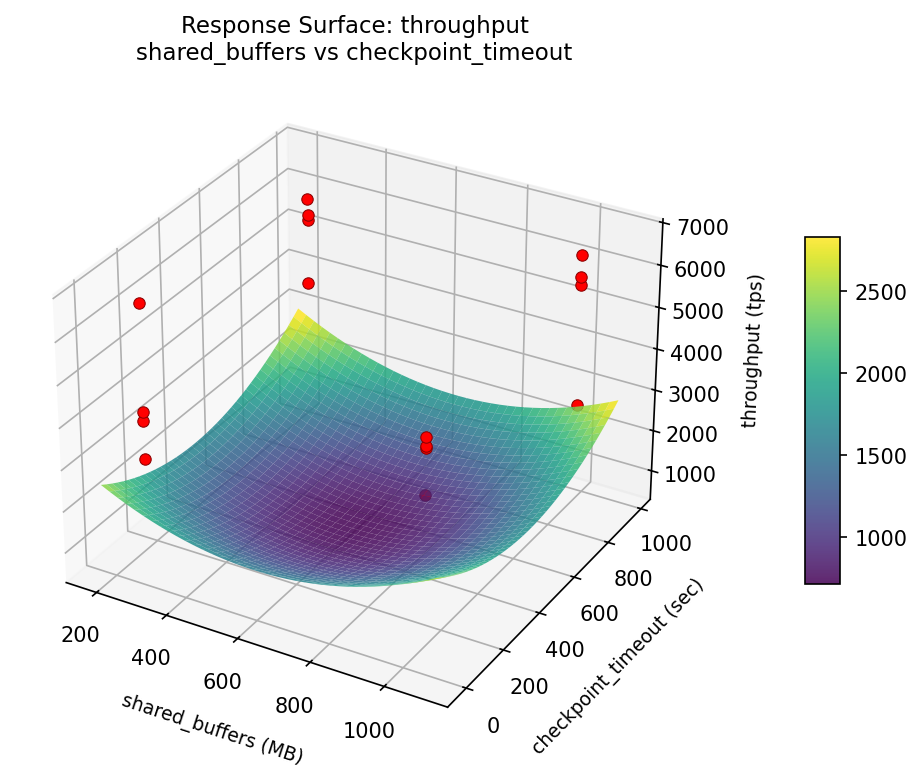
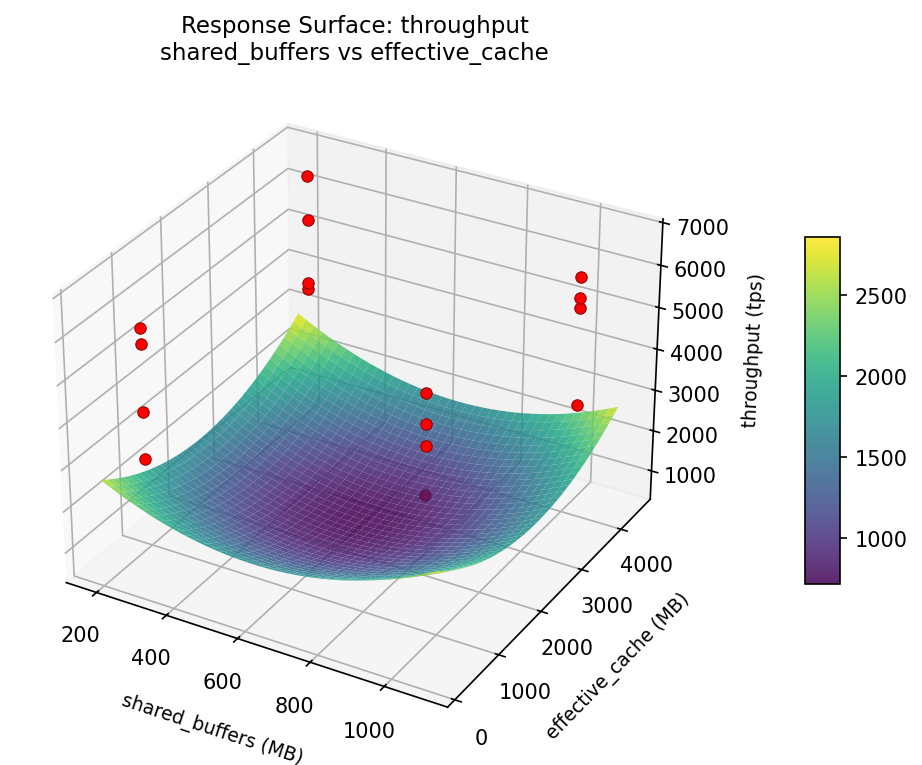
3D surfaces fitted with quadratic RSM. Red dots are observed data points.
How to Read These Surfaces
Each plot shows predicted response (vertical axis) across two factors while other factors are held at center. Red dots are actual experimental observations.
- Flat surface — these two factors have little effect on the response.
- Tilted plane — strong linear effect; moving along one axis consistently changes the response.
- Curved/domed surface — quadratic curvature; there is an optimum somewhere in the middle.
- Saddle shape — significant interaction; the best setting of one factor depends on the other.
- Red dots far from surface — poor model fit in that region; be cautious about predictions there.
throughput (tps) — R² = 0.184, Adj R² = 0.184
Weak fit — interpret the surface shape with caution.
Curvature detected in shared_buffers, work_mem — look for a peak or valley in the surface.
Strongest linear driver: shared_buffers (decreases throughput).
Notable interaction: effective_cache × wal_level — the effect of one depends on the level of the other. Look for a twisted surface.
p99_latency (ms) — R² = 0.378, Adj R² = 0.378
Weak fit — interpret the surface shape with caution.
Curvature detected in work_mem, max_connections — look for a peak or valley in the surface.
Strongest linear driver: checkpoint_timeout (decreases p99_latency).
Notable interaction: max_connections × wal_level — the effect of one depends on the level of the other. Look for a twisted surface.
p99: latency effective cache vs checkpoint timeout

p99: latency max connections vs checkpoint timeout
p99: latency max connections vs effective cache
p99: latency shared buffers vs checkpoint timeout
p99: latency shared buffers vs effective cache

p99: latency shared buffers vs max connections
p99: latency shared buffers vs work mem
p99: latency work mem vs checkpoint timeout
p99: latency work mem vs effective cache
p99: latency work mem vs max connections
throughput: effective cache vs checkpoint timeout
throughput: max connections vs checkpoint timeout
throughput: max connections vs effective cache
throughput: shared buffers vs checkpoint timeout
throughput: shared buffers vs effective cache
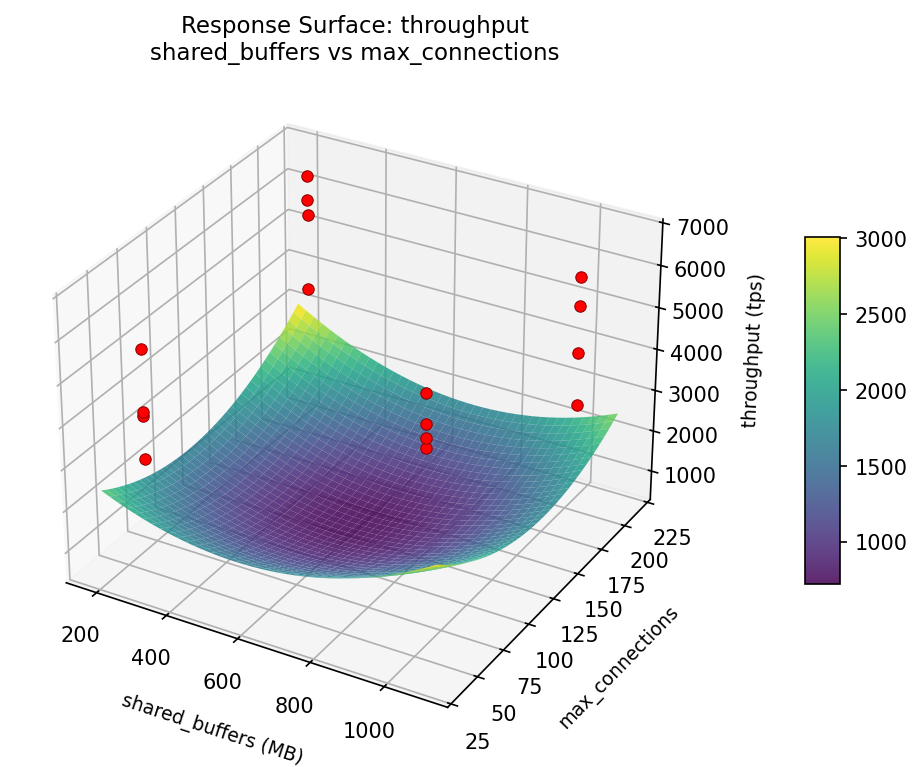
throughput: shared buffers vs max connections
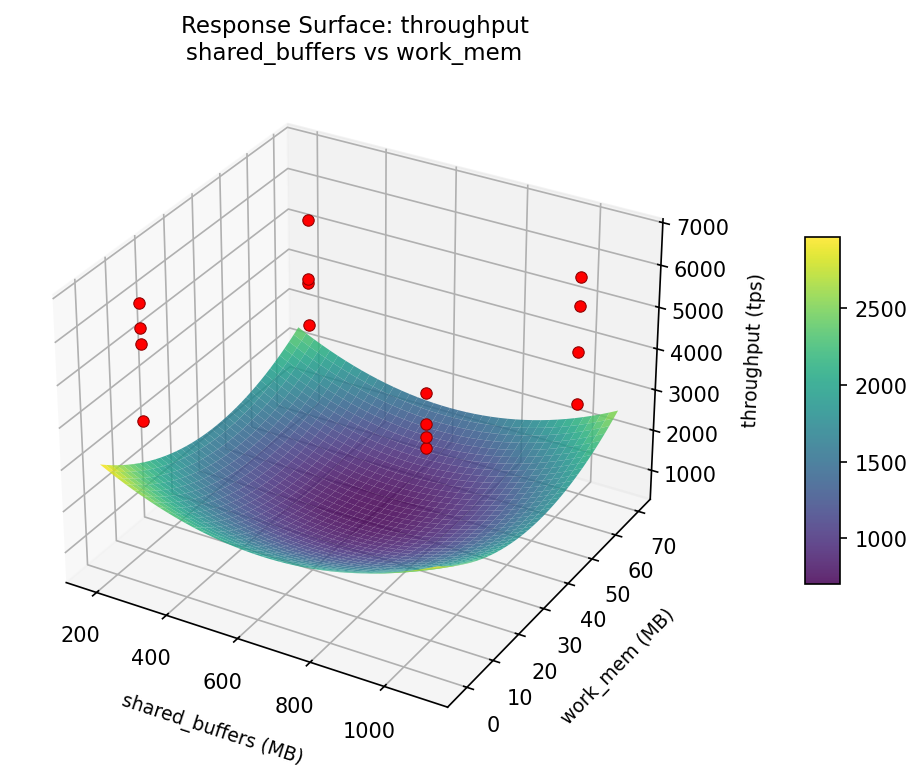
throughput: shared buffers vs work mem
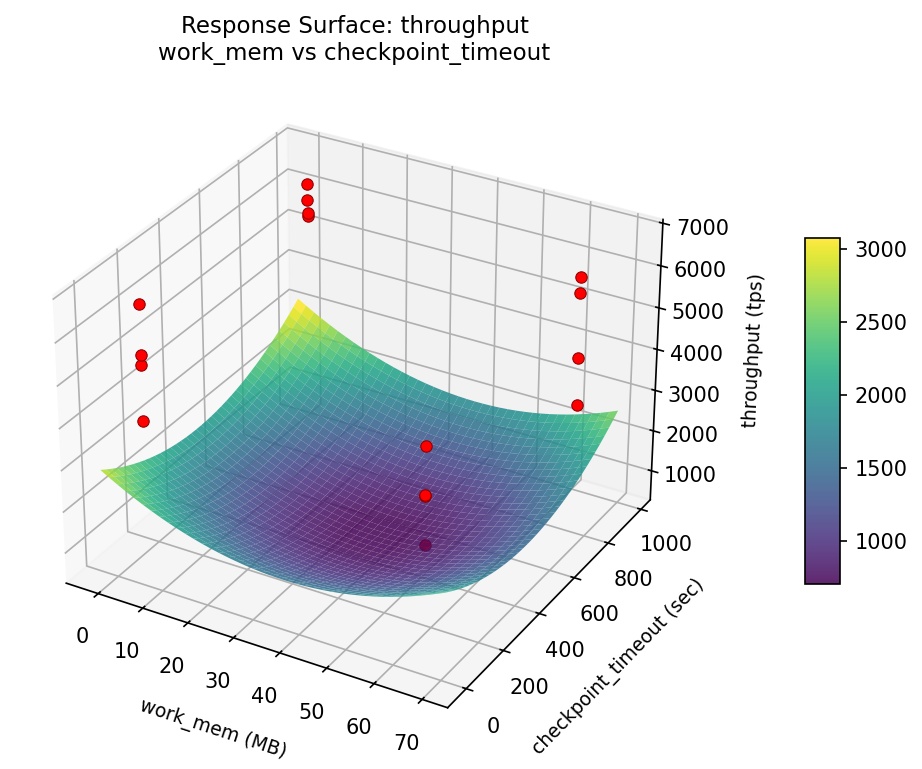
throughput: work mem vs checkpoint timeout
throughput: work mem vs effective cache

throughput: work mem vs max connections
Full Analysis Output
Optimization Recommendations
Multi-Objective Optimization
When responses compete, Derringer–Suich desirability finds the best compromise. Each response is scaled to a 0–1 desirability, then combined via a weighted geometric mean.
Per-Response Desirability
| Response | Weight | Desirability | Predicted | Dir |
|---|---|---|---|---|
throughput |
1.5 |
0.8701
|
6305.59 0.8701 6305.59 tps | ↑ |
p99_latency |
1.0 |
0.8866
|
8.15 0.8866 8.15 ms | ↓ |
Recommended Settings
| Factor | Value |
|---|---|
shared_buffers | 994.8 MB |
work_mem | 55.71 MB |
max_connections | 88.9 |
effective_cache | 3854 MB |
wal_level | minimal |
checkpoint_timeout | 829.7 sec |
Source: from RSM model prediction
Trade-off Summary
Sacrifice = how much worse than single-objective best.
| Response | Predicted | Best Observed | Sacrifice |
|---|---|---|---|
p99_latency | 8.15 | 7.10 | +1.05 |
Top 3 Runs by Desirability
| Run | D | Factor Settings |
|---|---|---|
| #14 | 0.8514 | shared_buffers=1024, work_mem=4, max_connections=50, effective_cache=4096, wal_level=replica, checkpoint_timeout=60 |
| #10 | 0.8140 | shared_buffers=1024, work_mem=64, max_connections=200, effective_cache=512, wal_level=minimal, checkpoint_timeout=60 |
Model Quality
| Response | R² | Type |
|---|---|---|
p99_latency | 0.2893 | linear |