Summary
This experiment investigates cache blocking strategy optimization. Optimize cache blocking tile sizes and prefetch distance for DGEMM on a 4096x4096 matrix.
The design varies 4 factors: block i (elements), ranging from 16 to 256, block j (elements), ranging from 16 to 256, block k (elements), ranging from 16 to 256, and prefetch dist (iterations), ranging from 1 to 8. The goal is to optimize 2 responses: gflops (GFLOPS) (maximize) and cache miss rate (%) (maximize).
Latin Hypercube Sampling was used to space 25 runs across the 4-dimensional factor space with good coverage and minimal gaps, making it ideal for computer experiments where the response surface may be complex.
Quadratic response surface models were fitted to capture potential curvature and factor interactions. The RSM contour plots below visualize how pairs of factors jointly affect each response.
Key Findings
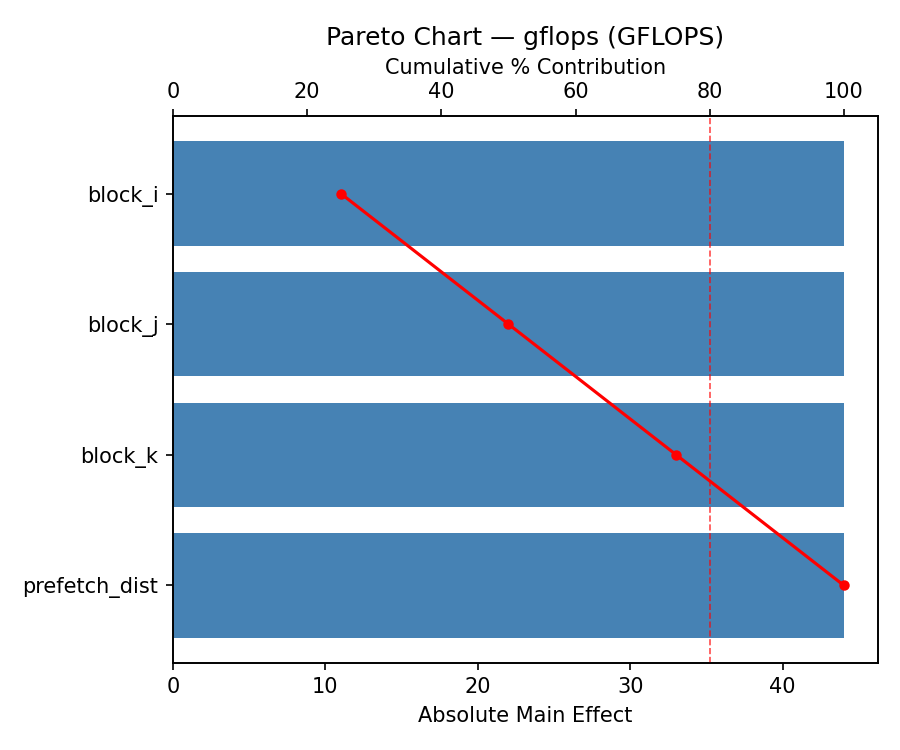
For gflops, the most influential factors were block i (25.0%), block j (25.0%), block k (25.0%). The best observed value was 52.02 (at block i = 37.0728, block j = 93.3655, block k = 57.6266).
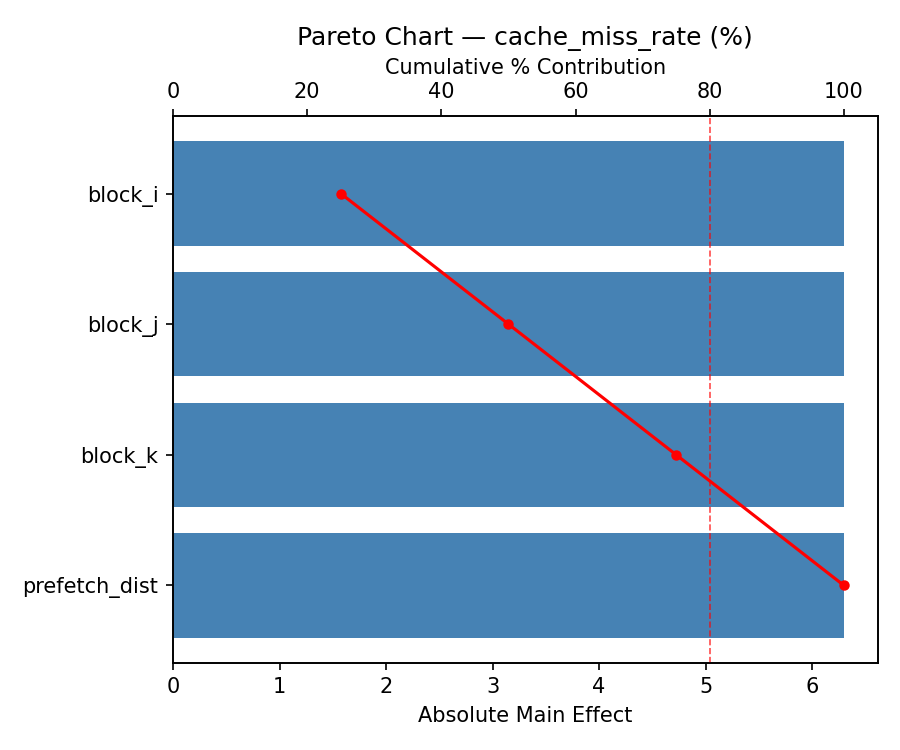
For cache miss rate, the most influential factors were block i (25.0%), block j (25.0%), block k (25.0%). The best observed value was 9.28 (at block i = 125.8, block j = 23.4436, block k = 84.1187).
Recommended Next Steps
- Consider whether any fixed factors should be varied in a future study.
Experimental Setup
Factors
| Factor | Levels | Type | Unit |
|---|
block_i | 16, 256 | continuous | elements |
block_j | 16, 256 | continuous | elements |
block_k | 16, 256 | continuous | elements |
prefetch_dist | 1, 8 | continuous | iterations |
Fixed: none
Responses
| Response | Direction | Unit |
|---|
gflops | ↑ maximize | GFLOPS |
cache_miss_rate | ↑ maximize | % |
Experimental Matrix
The Latin Hypercube Design produces 25 runs. Each row is one experiment with specific factor settings.
| Run | block_i | block_j | block_k | prefetch_dist |
|---|
| 1 | 125.565 | 93.9219 | 246.99 | 6.14317 |
| 2 | 253.366 | 135.373 | 109.113 | 1.58733 |
| 3 | 191.13 | 72.442 | 83.4999 | 4.06585 |
| 4 | 205.217 | 91.2761 | 229.287 | 1.99472 |
| 5 | 23.3792 | 220.391 | 37.4516 | 2.3045 |
| 6 | 31.3417 | 33.1503 | 217.371 | 5.67698 |
| 7 | 119.712 | 47.9475 | 147.486 | 1.08597 |
| 8 | 95.3808 | 63.2384 | 72.2209 | 2.57363 |
| 9 | 137.114 | 205.738 | 116.808 | 7.94096 |
| 10 | 65.4981 | 17.0158 | 122.866 | 3.73912 |
| 11 | 42.3318 | 180.021 | 196.229 | 7.65567 |
| 12 | 148.041 | 105.512 | 30.5067 | 6.50236 |
| 13 | 86.1808 | 244.233 | 225.707 | 4.9552 |
| 14 | 236.364 | 215.429 | 160.454 | 7.22458 |
| 15 | 83.0051 | 234.301 | 183.575 | 7.07721 |
| 16 | 179.17 | 152.993 | 155.23 | 2.774 |
| 17 | 211.767 | 247.23 | 101.146 | 6.73868 |
| 18 | 45.9894 | 41.2622 | 53.5912 | 3.29855 |
| 19 | 107.477 | 179.089 | 205.576 | 3.01821 |
| 20 | 160.35 | 127.63 | 244.219 | 4.2807 |
| 21 | 238.162 | 121.006 | 57.7357 | 5.82436 |
| 22 | 187.837 | 194.161 | 82.1465 | 4.84304 |
| 23 | 219.758 | 74.6757 | 134.286 | 4.61224 |
| 24 | 152.99 | 166.884 | 20.5865 | 1.38158 |
| 25 | 55.4892 | 142.126 | 178.238 | 5.28402 |
How to Run
$ doe info --config use_cases/14_cache_blocking/config.json
$ doe generate --config use_cases/14_cache_blocking/config.json --output results/run.sh --seed 42
$ bash results/run.sh
$ doe analyze --config use_cases/14_cache_blocking/config.json
$ doe optimize --config use_cases/14_cache_blocking/config.json
$ doe report --config use_cases/14_cache_blocking/config.json --output report.html
Analysis Results
Generated from actual experiment runs.
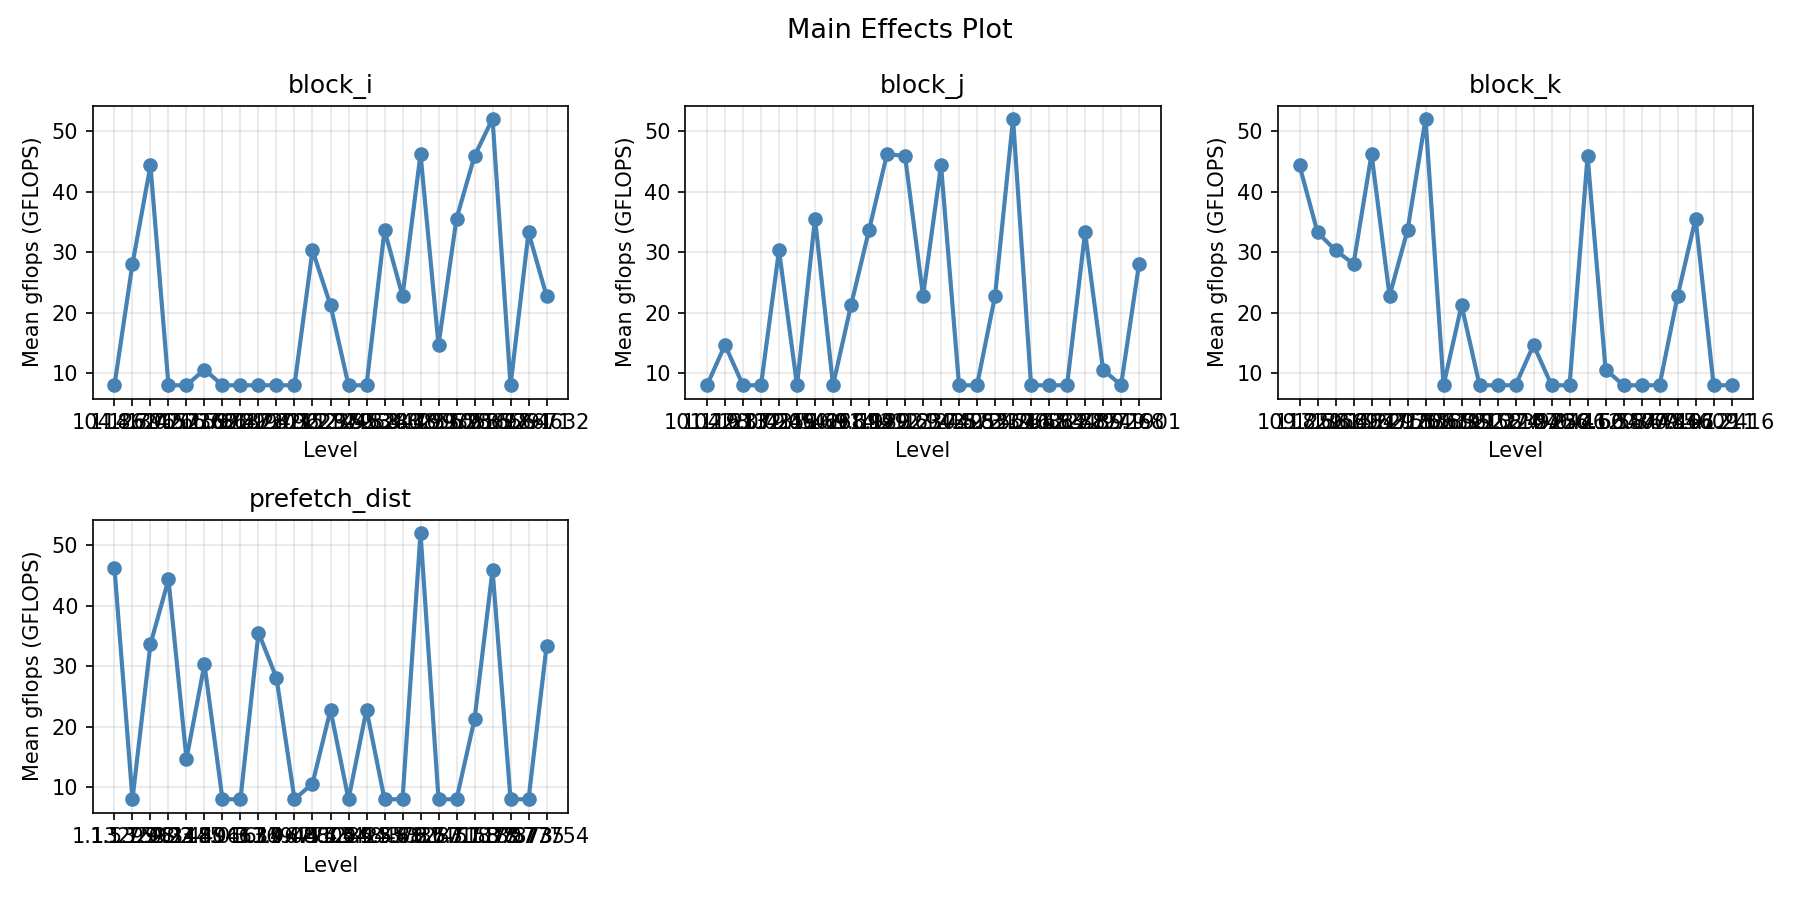
Response: gflops
Pareto Chart
Main Effects Plot
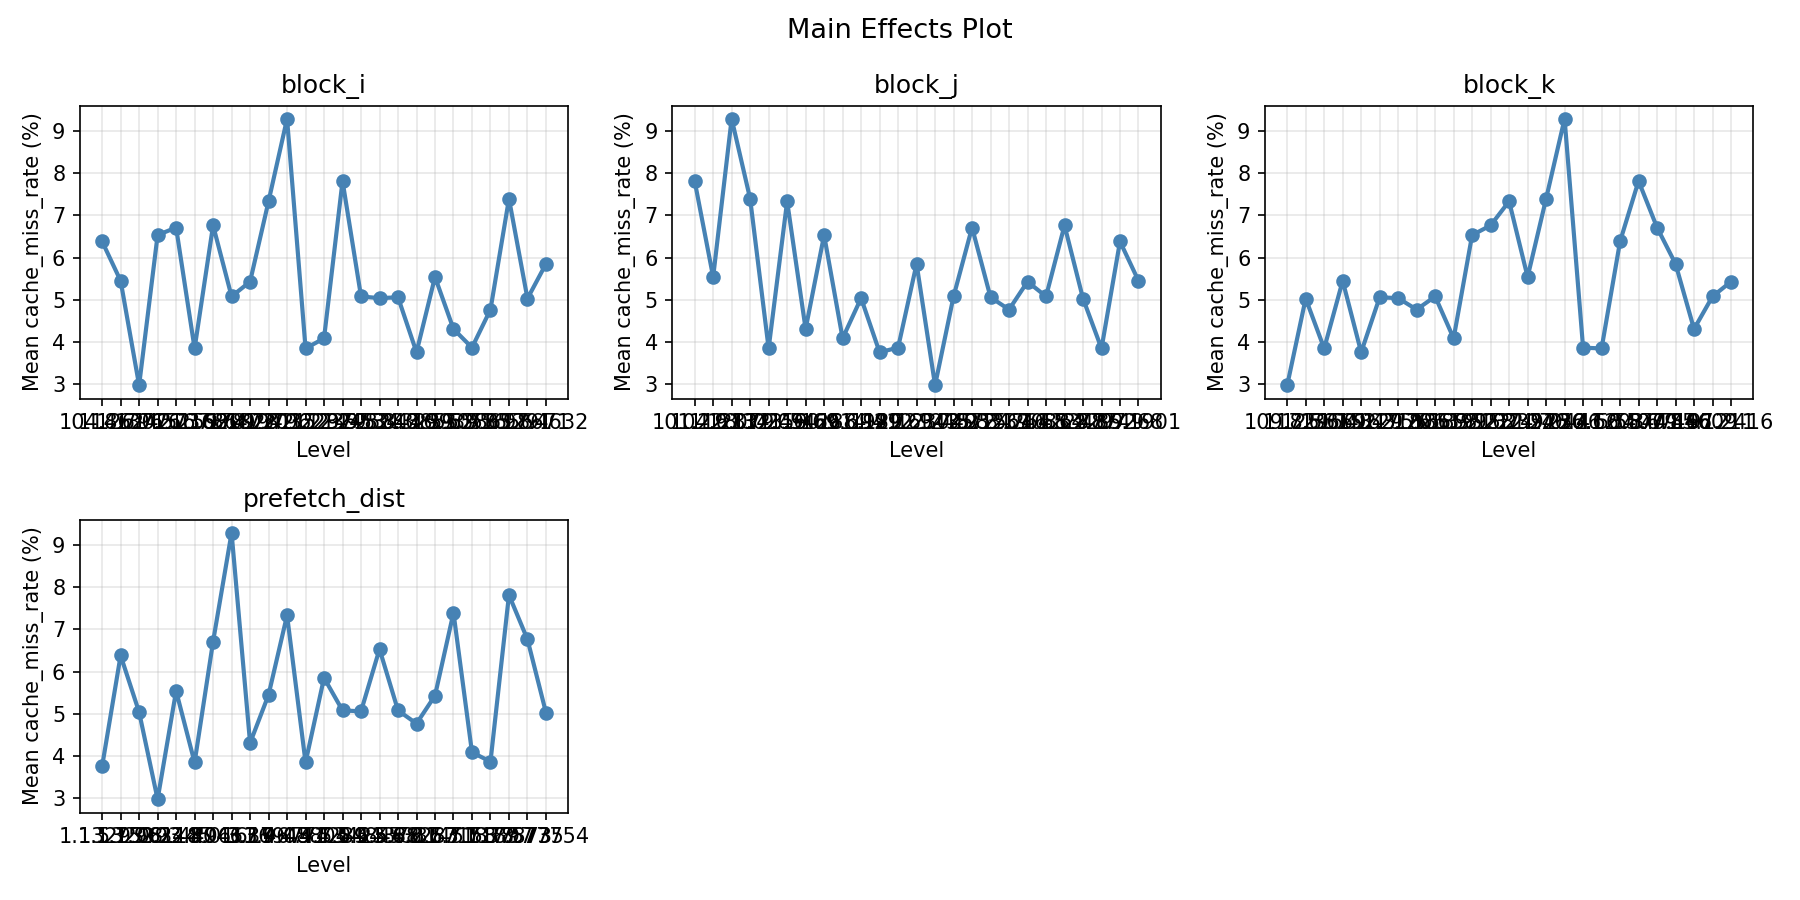
Response: cache_miss_rate
Pareto Chart
Main Effects Plot
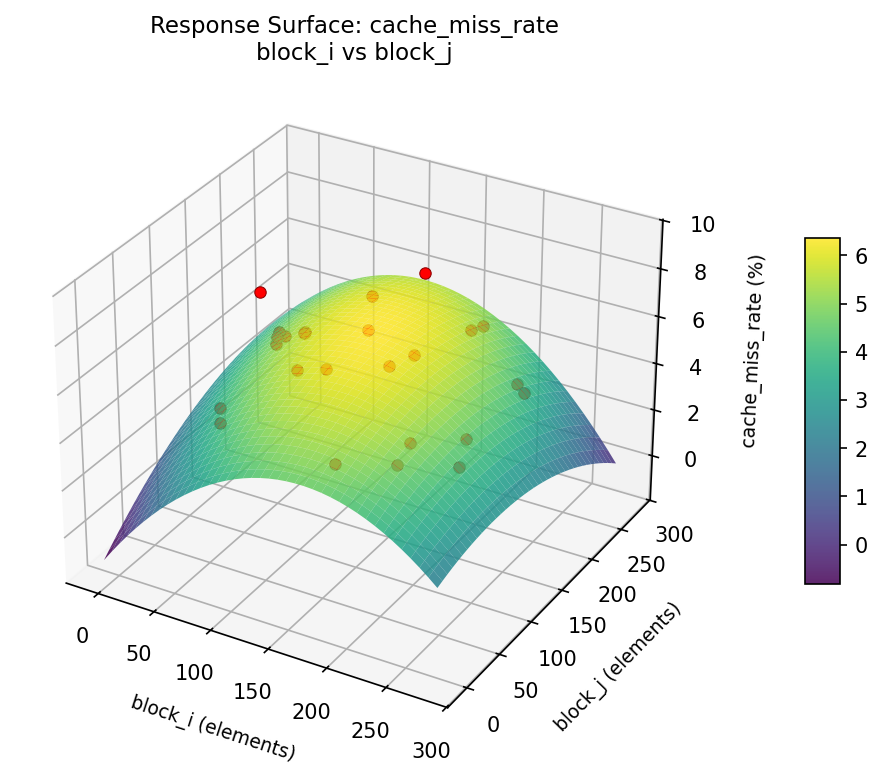
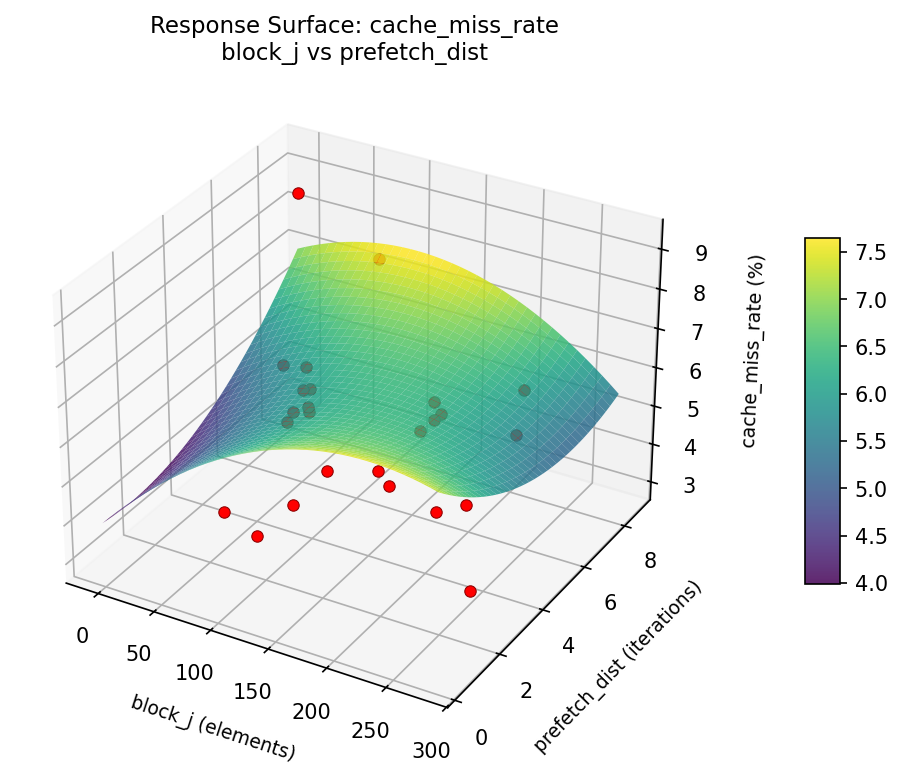
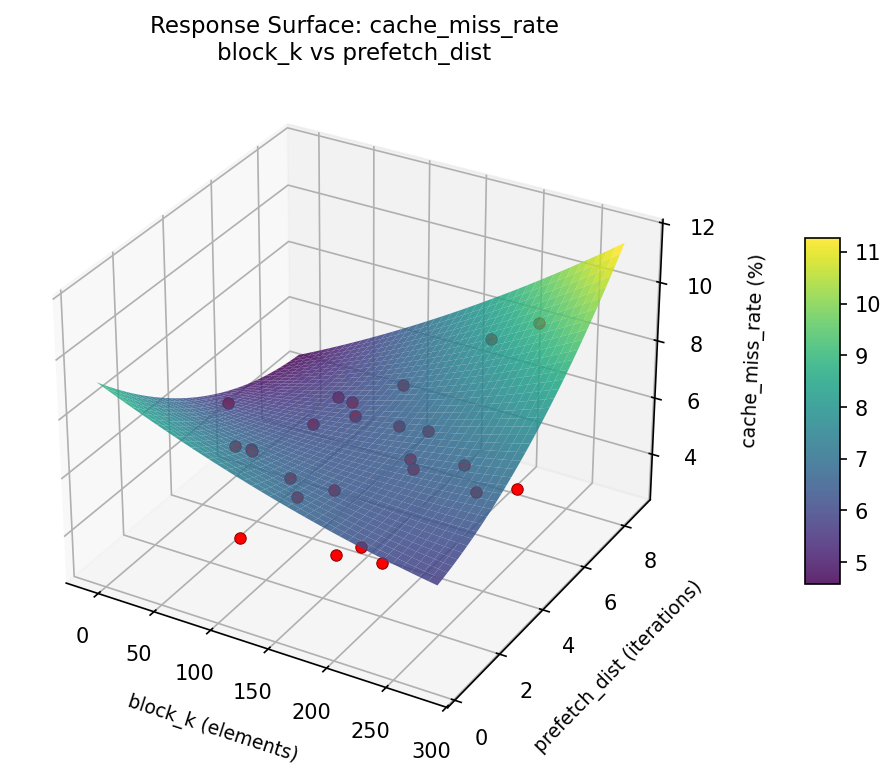
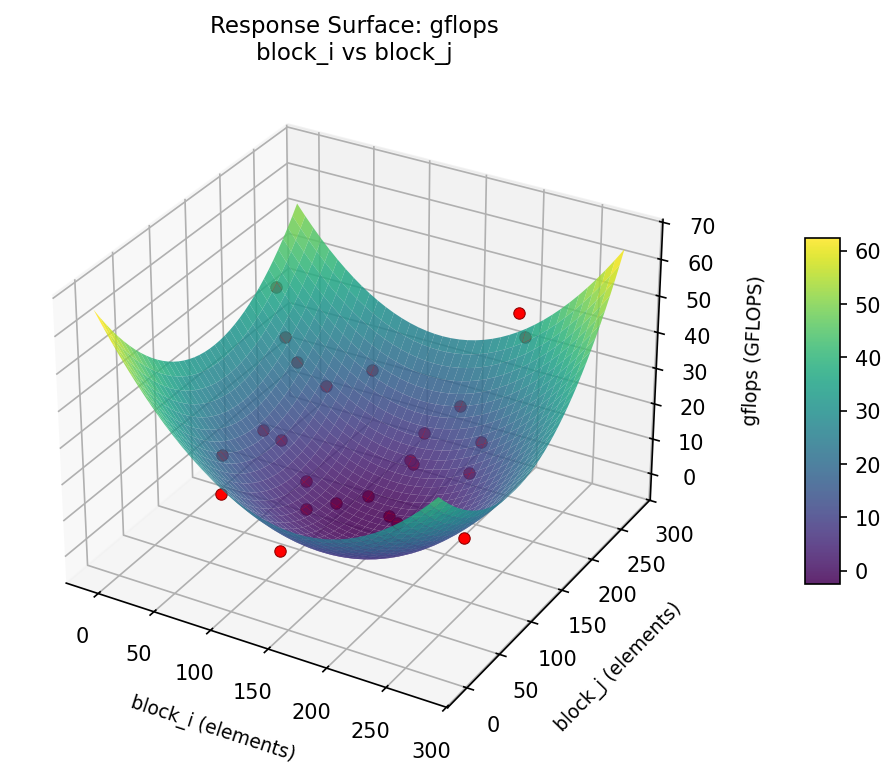
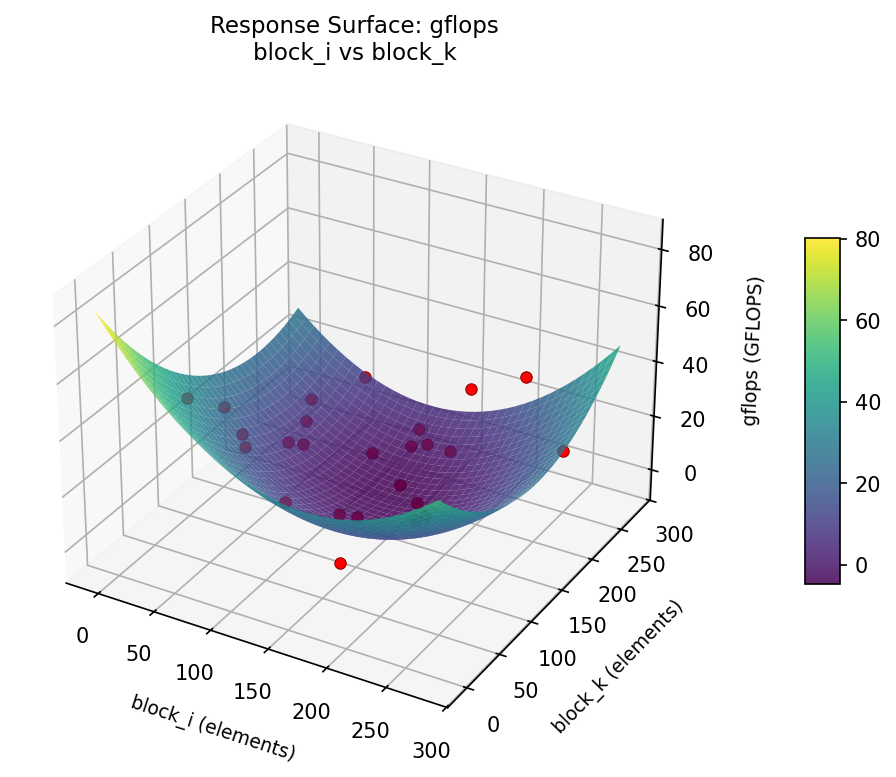
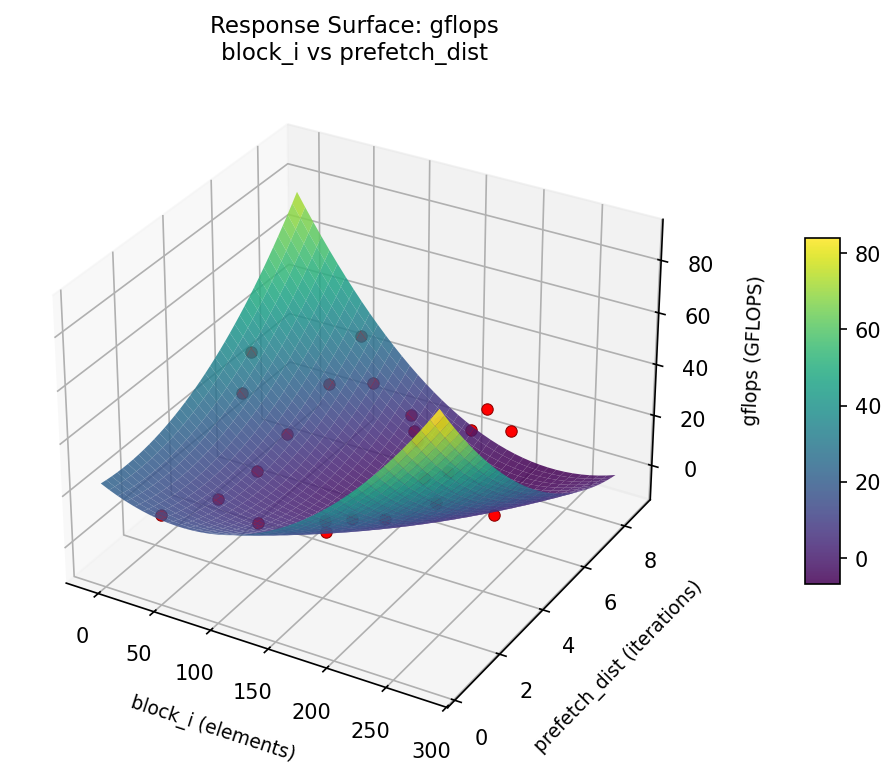
Response Surface Plots
3D surfaces fitted with quadratic RSM. Red dots are observed data points.
📊
How to Read These Surfaces
Each plot shows predicted response (vertical axis) across two factors while other factors are held at center. Red dots are actual experimental observations.
- Flat surface — these two factors have little effect on the response.
- Tilted plane — strong linear effect; moving along one axis consistently changes the response.
- Curved/domed surface — quadratic curvature; there is an optimum somewhere in the middle.
- Saddle shape — significant interaction; the best setting of one factor depends on the other.
- Red dots far from surface — poor model fit in that region; be cautious about predictions there.
gflops (GFLOPS) — R² = 0.656, Adj R² = 0.175
Moderate fit — surface shows general trends but some noise remains.
Curvature detected in prefetch_dist, block_i — look for a peak or valley in the surface.
Strongest linear driver: block_i (increases gflops).
Notable interaction: block_i × block_j — the effect of one depends on the level of the other. Look for a twisted surface.
cache_miss_rate (%) — R² = 0.446, Adj R² = -0.329
Weak fit — interpret the surface shape with caution.
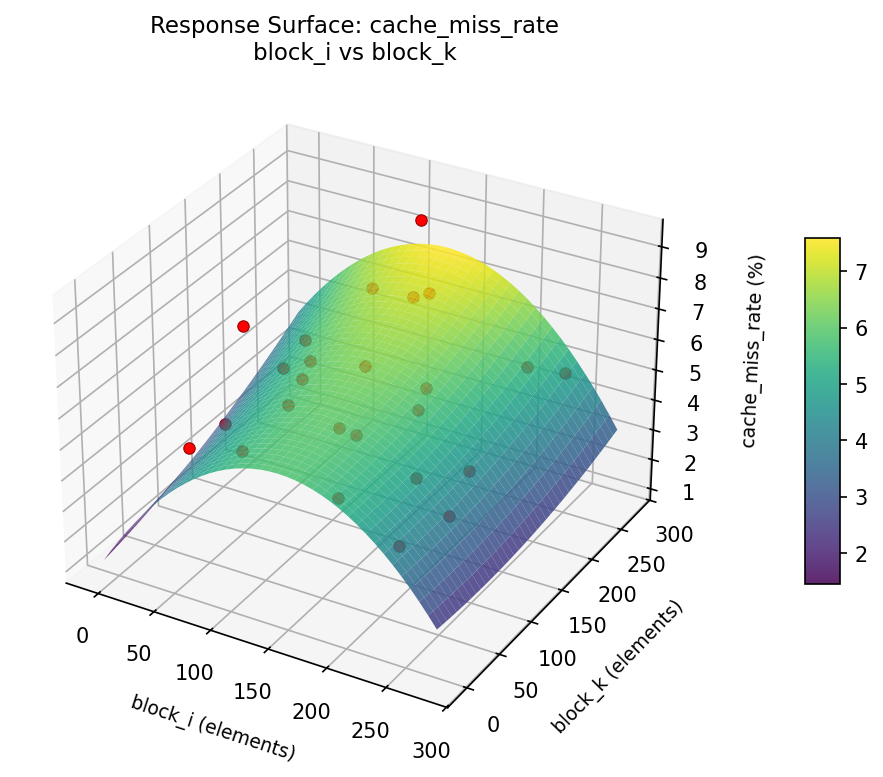
Curvature detected in block_k, block_i — look for a peak or valley in the surface.
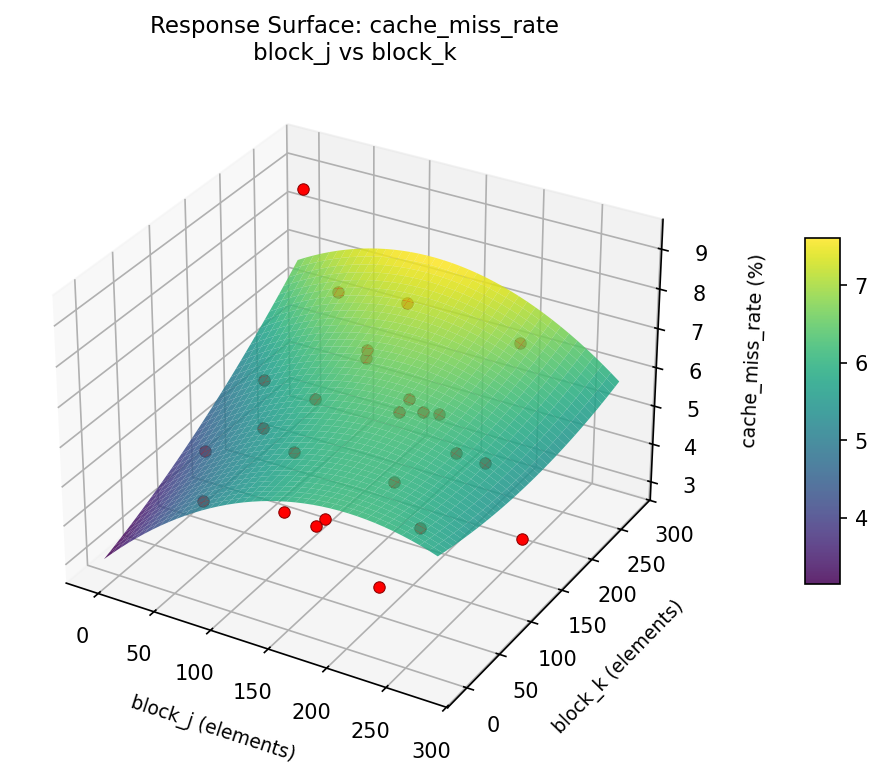
Strongest linear driver: block_j (increases cache_miss_rate).
Notable interaction: block_i × block_j — the effect of one depends on the level of the other. Look for a twisted surface.
cache: miss rate block i vs block j
cache: miss rate block i vs block k
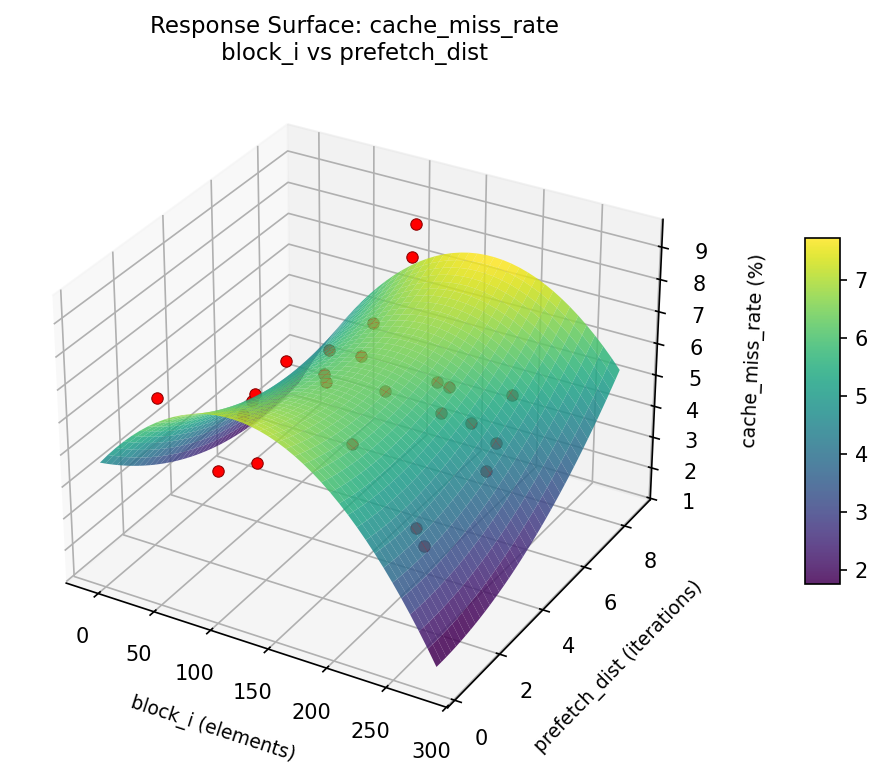
cache: miss rate block i vs prefetch dist
cache: miss rate block j vs block k
cache: miss rate block j vs prefetch dist
cache: miss rate block k vs prefetch dist
gflops: block i vs block j
gflops: block i vs block k
gflops: block i vs prefetch dist
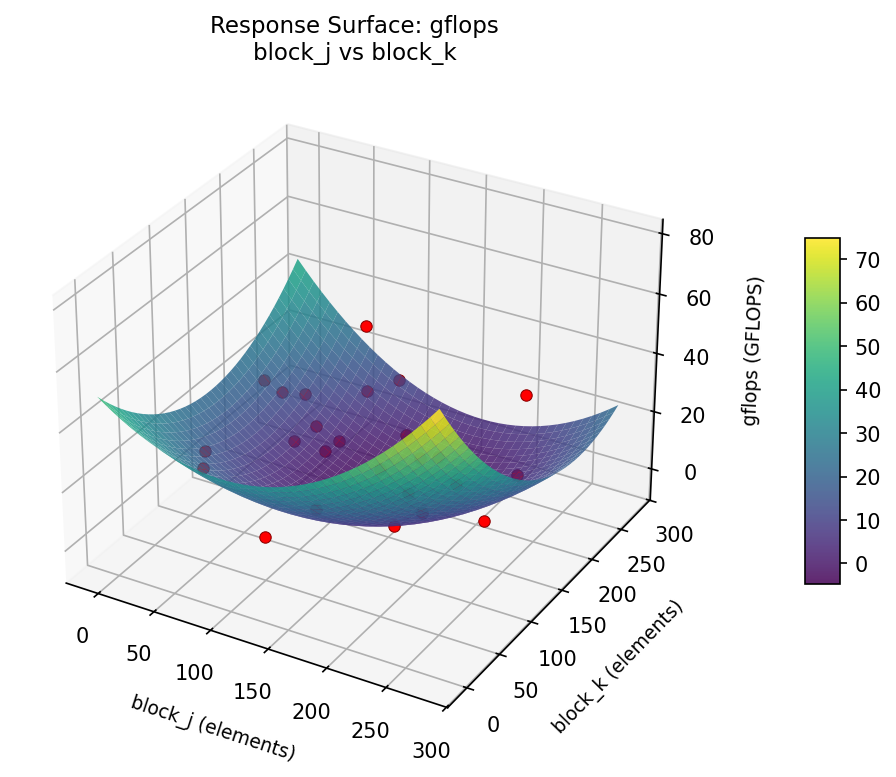
gflops: block j vs block k
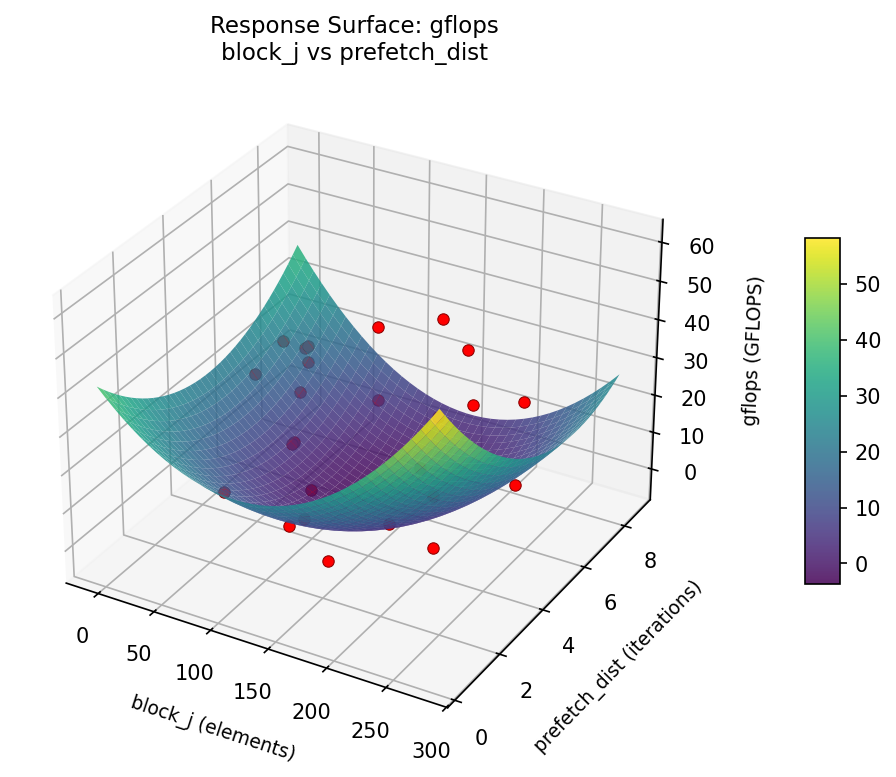
gflops: block j vs prefetch dist
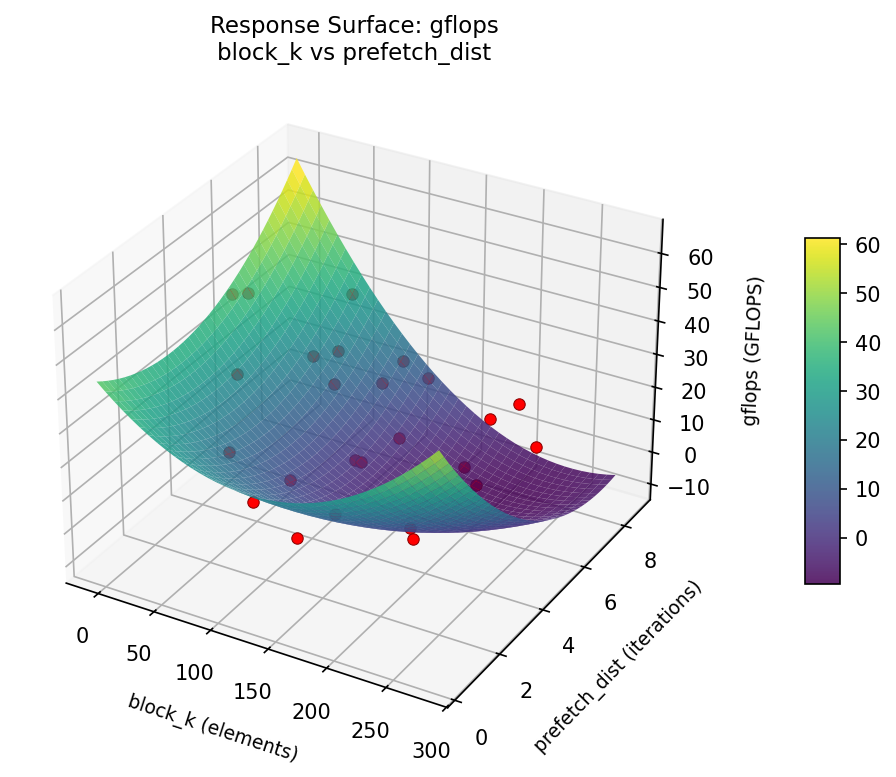
gflops: block k vs prefetch dist
Full Analysis Output
=== Main Effects: gflops ===
Factor Effect Std Error % Contribution
--------------------------------------------------------------
block_i 44.0200 3.0082 25.0%
block_j 44.0200 3.0082 25.0%
block_k 44.0200 3.0082 25.0%
prefetch_dist 44.0200 3.0082 25.0%
=== Summary Statistics: gflops ===
block_i:
Level N Mean Std Min Max
------------------------------------------------------------
100.441 1 8.0000 0.0000 8.0000 8.0000
108.716 1 8.0000 0.0000 8.0000 8.0000
117.135 1 8.0000 0.0000 8.0000 8.0000
122.48 1 8.0000 0.0000 8.0000 8.0000
135.282 1 8.0000 0.0000 8.0000 8.0000
146.065 1 46.2000 0.0000 46.2000 46.2000
155.04 1 8.0000 0.0000 8.0000 8.0000
162.672 1 22.7500 0.0000 22.7500 22.7500
176.471 1 22.7700 0.0000 22.7700 22.7700
185.381 1 44.3100 0.0000 44.3100 44.3100
196.569 1 8.0000 0.0000 8.0000 8.0000
205.77 1 14.6600 0.0000 14.6600 14.6600
21.5346 1 8.0000 0.0000 8.0000 8.0000
214.607 1 33.6200 0.0000 33.6200 33.6200
226.543 1 35.5400 0.0000 35.5400 35.5400
233.123 1 8.0000 0.0000 8.0000 8.0000
237.44 1 8.0000 0.0000 8.0000 8.0000
255.346 1 10.5900 0.0000 10.5900 10.5900
35.0991 1 30.3000 0.0000 30.3000 30.3000
38.9592 1 45.8800 0.0000 45.8800 45.8800
49.3449 1 52.0200 0.0000 52.0200 52.0200
59.482 1 28.0500 0.0000 28.0500 28.0500
64.5572 1 8.0000 0.0000 8.0000 8.0000
79.3272 1 21.2100 0.0000 21.2100 21.2100
89.2871 1 33.2500 0.0000 33.2500 33.2500
block_j:
Level N Mean Std Min Max
------------------------------------------------------------
104.313 1 45.8800 0.0000 45.8800 45.8800
118.972 1 30.3000 0.0000 30.3000 30.3000
122.525 1 44.3100 0.0000 44.3100 44.3100
131.734 1 14.6600 0.0000 14.6600 14.6600
146.999 1 8.0000 0.0000 8.0000 8.0000
159.9 1 8.0000 0.0000 8.0000 8.0000
165.97 1 33.2500 0.0000 33.2500 33.2500
173.031 1 8.0000 0.0000 8.0000 8.0000
185.565 1 35.5400 0.0000 35.5400 35.5400
193.468 1 10.5900 0.0000 10.5900 10.5900
205.02 1 8.0000 0.0000 8.0000 8.0000
21.2032 1 8.0000 0.0000 8.0000 8.0000
217.343 1 21.2100 0.0000 21.2100 21.2100
222.59 1 33.6200 0.0000 33.6200 33.6200
236.066 1 8.0000 0.0000 8.0000 8.0000
237.966 1 46.2000 0.0000 46.2000 46.2000
254.692 1 22.7700 0.0000 22.7700 22.7700
33.3359 1 8.0000 0.0000 8.0000 8.0000
38.2403 1 22.7500 0.0000 22.7500 22.7500
53.8312 1 8.0000 0.0000 8.0000 8.0000
63.5083 1 52.0200 0.0000 52.0200 52.0200
64.0667 1 28.0500 0.0000 28.0500 28.0500
75.2314 1 8.0000 0.0000 8.0000 8.0000
91.2207 1 8.0000 0.0000 8.0000 8.0000
98.0826 1 8.0000 0.0000 8.0000 8.0000
block_k:
Level N Mean Std Min Max
------------------------------------------------------------
101.38 1 21.2100 0.0000 21.2100 21.2100
109.289 1 8.0000 0.0000 8.0000 8.0000
118.737 1 22.7700 0.0000 22.7700 22.7700
123.817 1 28.0500 0.0000 28.0500 28.0500
135.075 1 8.0000 0.0000 8.0000 8.0000
146.78 1 35.5400 0.0000 35.5400 35.5400
157.73 1 8.0000 0.0000 8.0000 8.0000
167.406 1 46.2000 0.0000 46.2000 46.2000
175.099 1 45.8800 0.0000 45.8800 45.8800
185.835 1 8.0000 0.0000 8.0000 8.0000
195.306 1 8.0000 0.0000 8.0000 8.0000
205.069 1 33.2500 0.0000 33.2500 33.2500
209.282 1 30.3000 0.0000 30.3000 30.3000
219.528 1 14.6600 0.0000 14.6600 14.6600
227.546 1 8.0000 0.0000 8.0000 8.0000
24.2475 1 8.0000 0.0000 8.0000 8.0000
241.84 1 8.0000 0.0000 8.0000 8.0000
246.554 1 10.5900 0.0000 10.5900 10.5900
27.8374 1 22.7500 0.0000 22.7500 22.7500
38.5433 1 8.0000 0.0000 8.0000 8.0000
52.3275 1 33.6200 0.0000 33.6200 33.6200
62.6205 1 8.0000 0.0000 8.0000 8.0000
71.1996 1 8.0000 0.0000 8.0000 8.0000
82.1852 1 44.3100 0.0000 44.3100 44.3100
84.3081 1 52.0200 0.0000 52.0200 52.0200
prefetch_dist:
Level N Mean Std Min Max
------------------------------------------------------------
1.07742 1 8.0000 0.0000 8.0000 8.0000
1.50185 1 10.5900 0.0000 10.5900 10.5900
1.58273 1 45.8800 0.0000 45.8800 45.8800
1.86147 1 22.7500 0.0000 22.7500 22.7500
2.36858 1 8.0000 0.0000 8.0000 8.0000
2.59996 1 46.2000 0.0000 46.2000 46.2000
2.81946 1 30.3000 0.0000 30.3000 30.3000
3.23597 1 52.0200 0.0000 52.0200 52.0200
3.50345 1 44.3100 0.0000 44.3100 44.3100
3.70061 1 8.0000 0.0000 8.0000 8.0000
4.06586 1 8.0000 0.0000 8.0000 8.0000
4.11329 1 8.0000 0.0000 8.0000 8.0000
4.6244 1 14.6600 0.0000 14.6600 14.6600
4.74691 1 8.0000 0.0000 8.0000 8.0000
5.03241 1 8.0000 0.0000 8.0000 8.0000
5.43876 1 21.2100 0.0000 21.2100 21.2100
5.70389 1 8.0000 0.0000 8.0000 8.0000
5.86451 1 33.2500 0.0000 33.2500 33.2500
6.28784 1 33.6200 0.0000 33.6200 33.6200
6.52731 1 28.0500 0.0000 28.0500 28.0500
6.72222 1 8.0000 0.0000 8.0000 8.0000
6.93657 1 8.0000 0.0000 8.0000 8.0000
7.24071 1 35.5400 0.0000 35.5400 35.5400
7.69683 1 8.0000 0.0000 8.0000 8.0000
7.88867 1 22.7700 0.0000 22.7700 22.7700
=== Main Effects: cache_miss_rate ===
Factor Effect Std Error % Contribution
--------------------------------------------------------------
block_i 6.3000 0.2999 25.0%
block_j 6.3000 0.2999 25.0%
block_k 6.3000 0.2999 25.0%
prefetch_dist 6.3000 0.2999 25.0%
=== Summary Statistics: cache_miss_rate ===
block_i:
Level N Mean Std Min Max
------------------------------------------------------------
100.441 1 6.3800 0.0000 6.3800 6.3800
108.716 1 6.5300 0.0000 6.5300 6.5300
117.135 1 5.0800 0.0000 5.0800 5.0800
122.48 1 5.0800 0.0000 5.0800 5.0800
135.282 1 6.7100 0.0000 6.7100 6.7100
146.065 1 3.7600 0.0000 3.7600 3.7600
155.04 1 6.7600 0.0000 6.7600 6.7600
162.672 1 5.8500 0.0000 5.8500 5.8500
176.471 1 5.0600 0.0000 5.0600 5.0600
185.381 1 2.9800 0.0000 2.9800 2.9800
196.569 1 5.4300 0.0000 5.4300 5.4300
205.77 1 5.5400 0.0000 5.5400 5.5400
21.5346 1 7.3900 0.0000 7.3900 7.3900
214.607 1 5.0400 0.0000 5.0400 5.0400
226.543 1 4.3100 0.0000 4.3100 4.3100
233.123 1 9.2800 0.0000 9.2800 9.2800
237.44 1 7.8100 0.0000 7.8100 7.8100
255.346 1 3.8500 0.0000 3.8500 3.8500
35.0991 1 3.8500 0.0000 3.8500 3.8500
38.9592 1 3.8700 0.0000 3.8700 3.8700
49.3449 1 4.7700 0.0000 4.7700 4.7700
59.482 1 5.4500 0.0000 5.4500 5.4500
64.5572 1 7.3300 0.0000 7.3300 7.3300
79.3272 1 4.0900 0.0000 4.0900 4.0900
89.2871 1 5.0300 0.0000 5.0300 5.0300
block_j:
Level N Mean Std Min Max
------------------------------------------------------------
104.313 1 3.8700 0.0000 3.8700 3.8700
118.972 1 3.8500 0.0000 3.8500 3.8500
122.525 1 2.9800 0.0000 2.9800 2.9800
131.734 1 5.5400 0.0000 5.5400 5.5400
146.999 1 5.4300 0.0000 5.4300 5.4300
159.9 1 5.0800 0.0000 5.0800 5.0800
165.97 1 5.0300 0.0000 5.0300 5.0300
173.031 1 7.3900 0.0000 7.3900 7.3900
185.565 1 4.3100 0.0000 4.3100 4.3100
193.468 1 3.8500 0.0000 3.8500 3.8500
205.02 1 6.7600 0.0000 6.7600 6.7600
21.2032 1 7.3300 0.0000 7.3300 7.3300
217.343 1 4.0900 0.0000 4.0900 4.0900
222.59 1 5.0400 0.0000 5.0400 5.0400
236.066 1 5.0800 0.0000 5.0800 5.0800
237.966 1 3.7600 0.0000 3.7600 3.7600
254.692 1 5.0600 0.0000 5.0600 5.0600
33.3359 1 7.8100 0.0000 7.8100 7.8100
38.2403 1 5.8500 0.0000 5.8500 5.8500
53.8312 1 6.7100 0.0000 6.7100 6.7100
63.5083 1 4.7700 0.0000 4.7700 4.7700
64.0667 1 5.4500 0.0000 5.4500 5.4500
75.2314 1 6.3800 0.0000 6.3800 6.3800
91.2207 1 9.2800 0.0000 9.2800 9.2800
98.0826 1 6.5300 0.0000 6.5300 6.5300
block_k:
Level N Mean Std Min Max
------------------------------------------------------------
101.38 1 4.0900 0.0000 4.0900 4.0900
109.289 1 9.2800 0.0000 9.2800 9.2800
118.737 1 5.0600 0.0000 5.0600 5.0600
123.817 1 5.4500 0.0000 5.4500 5.4500
135.075 1 7.3900 0.0000 7.3900 7.3900
146.78 1 4.3100 0.0000 4.3100 4.3100
157.73 1 5.0800 0.0000 5.0800 5.0800
167.406 1 3.7600 0.0000 3.7600 3.7600
175.099 1 3.8700 0.0000 3.8700 3.8700
185.835 1 6.7600 0.0000 6.7600 6.7600
195.306 1 6.3800 0.0000 6.3800 6.3800
205.069 1 5.0300 0.0000 5.0300 5.0300
209.282 1 3.8500 0.0000 3.8500 3.8500
219.528 1 5.5400 0.0000 5.5400 5.5400
227.546 1 7.8100 0.0000 7.8100 7.8100
24.2475 1 5.0800 0.0000 5.0800 5.0800
241.84 1 6.7100 0.0000 6.7100 6.7100
246.554 1 3.8500 0.0000 3.8500 3.8500
27.8374 1 5.8500 0.0000 5.8500 5.8500
38.5433 1 5.4300 0.0000 5.4300 5.4300
52.3275 1 5.0400 0.0000 5.0400 5.0400
62.6205 1 6.5300 0.0000 6.5300 6.5300
71.1996 1 7.3300 0.0000 7.3300 7.3300
82.1852 1 2.9800 0.0000 2.9800 2.9800
84.3081 1 4.7700 0.0000 4.7700 4.7700
prefetch_dist:
Level N Mean Std Min Max
------------------------------------------------------------
1.07742 1 7.3300 0.0000 7.3300 7.3300
1.50185 1 3.8500 0.0000 3.8500 3.8500
1.58273 1 3.8700 0.0000 3.8700 3.8700
1.86147 1 5.8500 0.0000 5.8500 5.8500
2.36858 1 6.3800 0.0000 6.3800 6.3800
2.59996 1 3.7600 0.0000 3.7600 3.7600
2.81946 1 3.8500 0.0000 3.8500 3.8500
3.23597 1 4.7700 0.0000 4.7700 4.7700
3.50345 1 2.9800 0.0000 2.9800 2.9800
3.70061 1 7.8100 0.0000 7.8100 7.8100
4.06586 1 6.7600 0.0000 6.7600 6.7600
4.11329 1 5.0800 0.0000 5.0800 5.0800
4.6244 1 5.5400 0.0000 5.5400 5.5400
4.74691 1 5.0800 0.0000 5.0800 5.0800
5.03241 1 7.3900 0.0000 7.3900 7.3900
5.43876 1 4.0900 0.0000 4.0900 4.0900
5.70389 1 9.2800 0.0000 9.2800 9.2800
5.86451 1 5.0300 0.0000 5.0300 5.0300
6.28784 1 5.0400 0.0000 5.0400 5.0400
6.52731 1 5.4500 0.0000 5.4500 5.4500
6.72222 1 6.5300 0.0000 6.5300 6.5300
6.93657 1 5.4300 0.0000 5.4300 5.4300
7.24071 1 4.3100 0.0000 4.3100 4.3100
7.69683 1 6.7100 0.0000 6.7100 6.7100
7.88867 1 5.0600 0.0000 5.0600 5.0600
Optimization Recommendations
=== Optimization: gflops ===
Direction: maximize
Best observed run: #25
block_i = 178.763
block_j = 159.836
block_k = 200.864
prefetch_dist = 4.24895
Value: 52.02
RSM Model (linear, R² = 0.02):
Coefficients:
intercept: +21.1777
block_i: +0.5849
block_j: -0.8405
block_k: -0.9666
prefetch_dist: +3.7788
Predicted optimum:
block_i = 153.05
block_j = 40.55
block_k = 39.4576
prefetch_dist = 6.72165
Predicted value: 25.1056
Factor importance:
1. block_i (effect: 44.0, contribution: 25.0%)
2. block_j (effect: 44.0, contribution: 25.0%)
3. block_k (effect: 44.0, contribution: 25.0%)
4. prefetch_dist (effect: 44.0, contribution: 25.0%)
=== Optimization: cache_miss_rate ===
Direction: maximize
Best observed run: #24
block_i = 65.4257
block_j = 235.986
block_k = 80.5579
prefetch_dist = 2.06055
Value: 9.28
RSM Model (linear, R² = 0.15):
Coefficients:
intercept: +5.4943
block_i: +0.4046
block_j: +0.4066
block_k: -0.4976
prefetch_dist: -0.4461
Predicted optimum:
block_i = 226.979
block_j = 196.757
block_k = 93.4081
prefetch_dist = 2.71501
Predicted value: 6.4110
Factor importance:
1. block_i (effect: 6.3, contribution: 25.0%)
2. block_j (effect: 6.3, contribution: 25.0%)
3. block_k (effect: 6.3, contribution: 25.0%)
4. prefetch_dist (effect: 6.3, contribution: 25.0%)
Multi-Objective Optimization
When responses compete, Derringer–Suich desirability finds the best compromise.
Each response is scaled to a 0–1 desirability, then combined via a weighted geometric mean.
Overall Desirability
D = 0.7543
Per-Response Desirability
| Response | Weight | Desirability | Predicted | Dir |
|---|
gflops |
1.5 |
|
57.91 1.0000 57.91 GFLOPS |
↑ |
cache_miss_rate |
1.0 |
|
6.09 0.4941 6.09 % |
↑ |
Recommended Settings
| Factor | Value |
|---|
block_i | 251.5 elements |
block_j | 228.5 elements |
block_k | 202.9 elements |
prefetch_dist | 1.243 iterations |
Source: from RSM model prediction
Trade-off Summary
Sacrifice = how much worse than single-objective best.
| Response | Predicted | Best Observed | Sacrifice |
|---|
cache_miss_rate | 6.09 | 9.28 | +3.19 |
Top 3 Runs by Desirability
| Run | D | Factor Settings |
|---|
| #14 | 0.4673 | block_i=153.207, block_j=70.2871, block_k=171.652, prefetch_dist=2.17463 |
| #16 | 0.4628 | block_i=181.498, block_j=131.038, block_k=247.396, prefetch_dist=4.1246 |
Model Quality
| Response | R² | Type |
|---|
cache_miss_rate | 0.0618 | linear |
Full Multi-Objective Output
============================================================
MULTI-OBJECTIVE OPTIMIZATION
Method: Derringer-Suich Desirability Function
============================================================
Overall desirability: D = 0.7543
Response Weight Desirability Predicted Direction
---------------------------------------------------------------------
gflops 1.5 1.0000 57.91 GFLOPS ↑
cache_miss_rate 1.0 0.4941 6.09 % ↑
Recommended settings:
block_i = 251.5 elements
block_j = 228.5 elements
block_k = 202.9 elements
prefetch_dist = 1.243 iterations
(from RSM model prediction)
Trade-off summary:
gflops: 57.91 (best observed: 52.02, sacrifice: -5.89)
cache_miss_rate: 6.09 (best observed: 9.28, sacrifice: +3.19)
Model quality:
gflops: R² = 0.6796 (quadratic)
cache_miss_rate: R² = 0.0618 (linear)
Top 3 observed runs by overall desirability:
1. Run #25 (D=0.6038): block_i=42.5109, block_j=54.9322, block_k=105.318, prefetch_dist=4.39188
2. Run #14 (D=0.4673): block_i=153.207, block_j=70.2871, block_k=171.652, prefetch_dist=2.17463
3. Run #16 (D=0.4628): block_i=181.498, block_j=131.038, block_k=247.396, prefetch_dist=4.1246